<?xml version="1.0" encoding="utf-8"?>
<feed xmlns="http://www.w3.org/2005/Atom">
    <id>https://docs-staging.fused.io/pr/1353/blog/</id>
    <title>Fused Blog</title>
    <updated>2026-10-16T00:00:00.000Z</updated>
    <generator>https://github.com/jpmonette/feed</generator>
    <link rel="alternate" href="https://docs-staging.fused.io/pr/1353/blog/"/>
    <subtitle>Fused Blog</subtitle>
    <icon>https://docs-staging.fused.io/pr/1353/img/favicon.png</icon>
    <entry>
        <title type="html"><![CDATA[Recap of H3 Conference 2026]]></title>
        <id>https://docs-staging.fused.io/pr/1353/blog/h3-conference-2026/</id>
        <link href="https://docs-staging.fused.io/pr/1353/blog/h3-conference-2026/"/>
        <updated>2026-10-16T00:00:00.000Z</updated>
        <summary type="html"><![CDATA[Recordings and write-ups from the first H3 Conference, hosted by Fused and Uber in New York City on September 23, 2026.]]></summary>
        <content type="html"><![CDATA[<p>On September 23, 2026, the <a href="https://h3geo.org/" target="_blank" rel="noopener noreferrer" class="">H3</a> community met at Uber's office in New York City for the first <a href="https://www.fused.io/h3-conference" target="_blank" rel="noopener noreferrer" class="">H3 Conference</a>, hosted by <a href="https://www.fused.io/" target="_blank" rel="noopener noreferrer" class="">Fused</a> and Uber. The talks covered crop acreage, land suitability, climate data, basketball, energy infrastructure, indoor positioning, newsroom maps and more.</p>
<p>Every recording is in the <a href="https://www.youtube.com/playlist?list=PLV-YgmSOYvwQ" target="_blank" rel="noopener noreferrer" class="">H3 Conference 2026 playlist</a>. Below is a short guide to each talk, with a link to its full write-up.</p>
<!-- -->
<h3 class="anchor anchorTargetStickyNavbar_Vzrq" id="the-talks">The talks<a href="https://docs-staging.fused.io/pr/1353/blog/h3-conference-2026/#the-talks" class="hash-link" aria-label="Direct link to The talks" title="Direct link to The talks" translate="no">​</a></h3>
<ul>
<li class=""><strong><a class="" href="https://docs-staging.fused.io/pr/1353/blog/spatial-intelligence-using-hexagons/">Spatial Intelligence Using Hexagons</a></strong> by Sina Kashuk and Isaac Brodsky (Fused). Eight years after presenting H3 at Uber around the time it was open-sourced, Sina rebuilds that talk with AI and scores the "vibe" of every hexagon in a city from Overture places. Isaac closes with roughly 100 TB of ERA5 and gridMET climate data in an H3-native format on Source Cooperative.</li>
<li class=""><strong><a class="" href="https://docs-staging.fused.io/pr/1353/blog/h3-parcel-suitability/">H3 Parcel Suitability</a></strong> by Tula van Balen (BCG). A canvas that puts crops, soil, terrain, weather, vegetation and irrigation on one H3 grid to cluster and query land parcels. This session wasn't recorded, so the write-up walks through the canvas.</li>
<li class=""><strong><a class="" href="https://docs-staging.fused.io/pr/1353/blog/the-decision-satellites-cant-see/">The Decision Satellites Can't See</a></strong> by Kristin Scholten (Nationwide). Predicting crop acreage for the 2026 season with H3, and when to convert from H3 back to field boundaries.</li>
<li class=""><strong><a class="" href="https://docs-staging.fused.io/pr/1353/blog/h3-geoparquet-pyramid-builder/">H3 as a GeoParquet Pyramid Builder</a></strong> by Guillaume Sueur (Geomermaids). Using H3 cells to build level-of-detail pyramids for GeoParquet, the way overviews work for Cloud Optimized GeoTIFFs.</li>
<li class=""><strong><a class="" href="https://docs-staging.fused.io/pr/1353/blog/mapping-earth-observation-data-with-h3/">Lessons from Mapping Earth Observation Data with H3</a></strong> by Marie Hoeger (Carbon Mapper). Combining multi-resolution layers on H3 to score tree planting sites in Brazil, computed on request in Fused, and mapping sparse methane plume detections.</li>
<li class=""><strong><a class="" href="https://docs-staging.fused.io/pr/1353/blog/geography-of-basketball/">The Geography of Basketball</a></strong> by Matt Forrest (Wherobots). An H3 index of basketball built from about 91,000 outdoor courts, indoor courts, team territories and player hometowns.</li>
<li class=""><strong><a class="" href="https://docs-staging.fused.io/pr/1353/blog/geoai-for-earth-or-flat-maps/">Is Your GeoAI Solving for Earth or for Flat Maps?</a></strong> by Levente Juhász (University of Florida). How projection distortion leaks into pixel-based models, and how H3 compares with S2, A5, ISEA and HEALPix grids.</li>
<li class=""><strong><a class="" href="https://docs-staging.fused.io/pr/1353/blog/h3-in-the-field/">H3 in the Field</a></strong> by Mo Fotouhi (John Deere). Extending H3 for field-level, time-aware agricultural analysis without changing its core.</li>
<li class=""><strong><a class="" href="https://docs-staging.fused.io/pr/1353/blog/indexing-energy-infrastructure-with-h3/">Indexing Energy-Intensive Infrastructure with H3</a></strong> by Robert Murphy (Othersphere). Indexing global infrastructure data on H3 for site screening and asset financial modeling.</li>
<li class=""><strong><a class="" href="https://docs-staging.fused.io/pr/1353/blog/one-grid-for-outdoors-and-indoors/">One Grid for Outdoors and Indoors</a></strong> by Sean Gorman (Zephr). Organizing GNSS corrections and indoor visual map tiles on two resolutions of the same H3 index.</li>
<li class=""><strong><a class="" href="https://docs-staging.fused.io/pr/1353/blog/foursquare-h3-hub/">The Foursquare H3 Hub</a></strong> by Xun Li (Foursquare). An open Apache Iceberg catalog of 103 H3-indexed datasets, a desktop app and a spatial agent that joins layers on shared cells.</li>
<li class=""><strong><a class="" href="https://docs-staging.fused.io/pr/1353/blog/maps-from-newsroom-to-pen-plotter/">Maps from the Newsroom to the Pen Plotter</a></strong> by Tim Wallace (The New York Times). A tour of maps made for the news and for fun.</li>
</ul>
<h3 class="anchor anchorTargetStickyNavbar_Vzrq" id="closing-remarks">Closing remarks<a href="https://docs-staging.fused.io/pr/1353/blog/h3-conference-2026/#closing-remarks" class="hash-link" aria-label="Direct link to Closing remarks" title="Direct link to Closing remarks" translate="no">​</a></h3>
<iframe style="width:100%;max-width:800px;aspect-ratio:16/9;height:auto;margin:0 auto 2rem auto;display:block" src="https://www.youtube.com/embed/9UVH2YOH85k" title="Closing Remarks" frameborder="0" allow="accelerometer; autoplay; clipboard-write; encrypted-media; gyroscope; picture-in-picture; web-share" referrerpolicy="strict-origin-when-cross-origin" allowfullscreen=""></iframe>
<p>Isaac Brodsky, CTO and co-founder of Fused, closed the day by thanking the sponsors: Fused, PyData, John Deere, the Overture Maps Foundation, the Cloud-Native Geospatial Forum and Uber. Isaac also pointed attendees to the H3 Slack, which is linked from the <a href="https://h3geo.org/" target="_blank" rel="noopener noreferrer" class="">H3 website</a> and the <a href="https://github.com/uber/h3" target="_blank" rel="noopener noreferrer" class="">H3 GitHub repository</a>, as the place to hear about H3 events and community news.</p>
<h3 class="anchor anchorTargetStickyNavbar_Vzrq" id="learn-more">Learn more<a href="https://docs-staging.fused.io/pr/1353/blog/h3-conference-2026/#learn-more" class="hash-link" aria-label="Direct link to Learn more" title="Direct link to Learn more" translate="no">​</a></h3>
<ul>
<li class="">Watch the full <a href="https://www.youtube.com/playlist?list=PLV-YgmSOYvwQ" target="_blank" rel="noopener noreferrer" class="">H3 Conference 2026 playlist</a></li>
<li class="">Get started with <a class="" href="https://docs-staging.fused.io/pr/1353/guide/h3-analytics/h3-overview/">H3 Analytics in Fused</a></li>
<li class="">Learn the H3 workflow in <a class="" href="https://docs-staging.fused.io/pr/1353/guide/working-with-udfs/udf-best-practices/working-with-h3/">Working with H3</a></li>
</ul>]]></content>
        <author>
            <name>Isaac Brodsky</name>
            <uri>https://www.linkedin.com/in/isaacbrodsky/</uri>
        </author>
        <author>
            <name>Sina Kashuk</name>
            <uri>https://www.linkedin.com/in/skashuk/</uri>
        </author>
        <category label="h3" term="h3"/>
        <category label="h3 conference" term="h3 conference"/>
        <category label="conferences" term="conferences"/>
        <category label="announcements" term="announcements"/>
    </entry>
    <entry>
        <title type="html"><![CDATA[H3 Parcel Suitability]]></title>
        <id>https://docs-staging.fused.io/pr/1353/blog/h3-parcel-suitability/</id>
        <link href="https://docs-staging.fused.io/pr/1353/blog/h3-parcel-suitability/"/>
        <updated>2026-09-23T12:10:30.000Z</updated>
        <summary type="html"><![CDATA[Tula van Balen of BCG shows how to judge land parcels by putting crops, soil, terrain, weather, vegetation and irrigation on one H3 grid, then clustering fields and querying them from a dashboard.]]></summary>
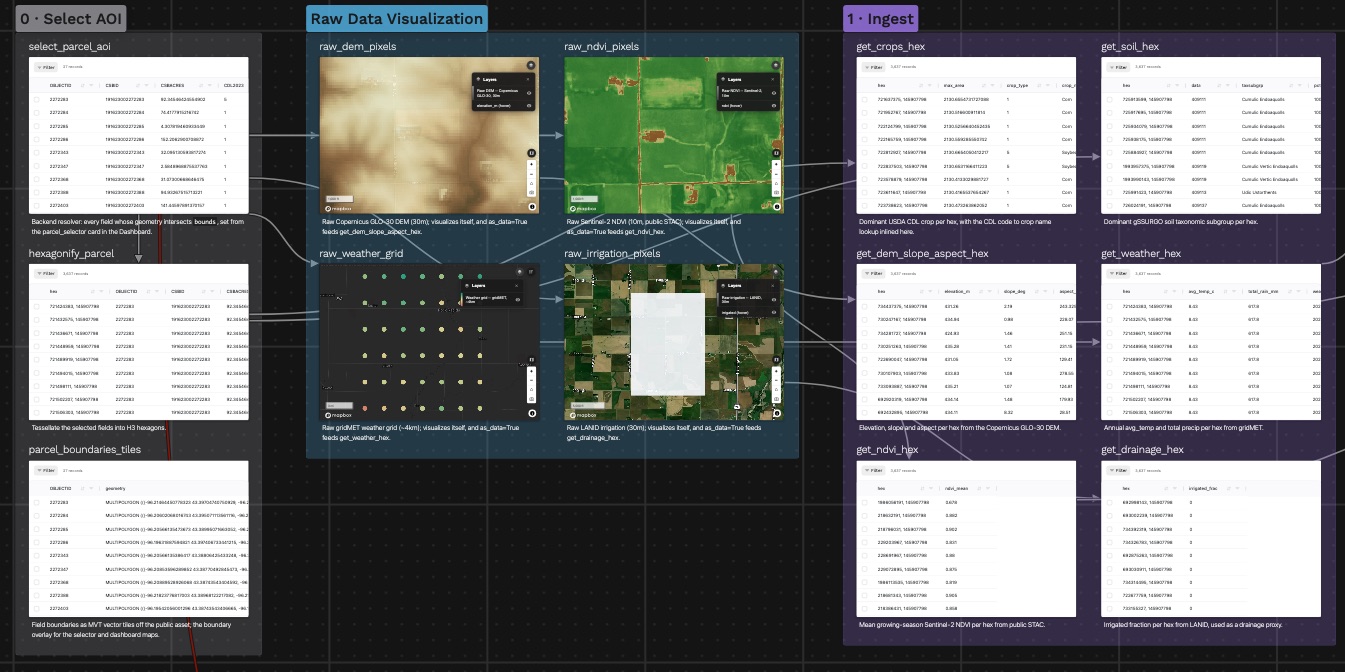
        <content type="html"><![CDATA[<p>Tula van Balen of <a href="https://www.bcg.com/" target="_blank" rel="noopener noreferrer" class="">BCG</a> presented H3 Parcel Suitability at the <a class="" href="https://docs-staging.fused.io/pr/1353/blog/h3-conference-2026/">H3 Conference 2026</a> in New York City: a single Fused canvas that answers how well suited a piece of land is by putting every relevant dataset on the same H3 grid. The session wasn't recorded, so this post walks through the canvas Tula presented.</p>
<!-- -->
<p><a href="https://www.fused.io/canvas/fc_fused/H3_Parcel_Suitability" target="_blank" rel="noopener noreferrer" class="">Open the H3 Parcel Suitability canvas →</a></p>
<p><img decoding="async" loading="lazy" alt="The H3 Parcel Suitability canvas: select an area, view the raw layers, then ingest each one into H3 hexagons" src="https://docs-staging.fused.io/pr/1353/assets/images/canvas-pipeline-e633090bc1f8bb7ee3b8aaa4b23b1352.jpg" width="1345" height="672" class="img_ev3q"></p>
<h3 class="anchor anchorTargetStickyNavbar_Vzrq" id="start-with-a-parcel">Start with a parcel<a href="https://docs-staging.fused.io/pr/1353/blog/h3-parcel-suitability/#start-with-a-parcel" class="hash-link" aria-label="Direct link to Start with a parcel" title="Direct link to Start with a parcel" translate="no">​</a></h3>
<p>The canvas works on real field boundaries: USDA Crop Sequence Boundaries for Lyon County, Iowa. Pick a preset region or draw a box on the map, and every field that intersects it becomes the area of interest. Those fields are then tessellated into H3 hexagons at resolution 11, and that hex set is the backbone for everything that follows.</p>
<h3 class="anchor anchorTargetStickyNavbar_Vzrq" id="six-datasets-one-grid">Six datasets, one grid<a href="https://docs-staging.fused.io/pr/1353/blog/h3-parcel-suitability/#six-datasets-one-grid" class="hash-link" aria-label="Direct link to Six datasets, one grid" title="Direct link to Six datasets, one grid" translate="no">​</a></h3>
<p>Suitability depends on many layers that arrive in different shapes and resolutions. The canvas first shows each raw source at its native resolution, then brings each one onto the parcel's hexagons:</p>
<ul>
<li class=""><strong>Crops:</strong> the dominant USDA Cropland Data Layer crop per hex</li>
<li class=""><strong>Soil:</strong> the dominant gSSURGO soil taxonomic subgroup per hex</li>
<li class=""><strong>Terrain:</strong> elevation, slope and aspect from the 30 m Copernicus GLO-30 DEM</li>
<li class=""><strong>Weather:</strong> annual average temperature and total precipitation from the roughly 4 km gridMET grid</li>
<li class=""><strong>Vegetation:</strong> mean growing-season NDVI from 10 m Sentinel-2 imagery</li>
<li class=""><strong>Irrigation:</strong> the irrigated fraction from the 30 m LANID dataset, used as a drainage proxy</li>
</ul>
<p>Once everything shares a cell ID, combining the layers is a join on the hex column instead of a spatial overlay. The canvas joins them into one wide table with a row per hexagon, then rolls that up to one row per farm: averages for the numeric layers, a circular mean for aspect (it is a compass bearing), and the majority crop and soil.</p>
<h3 class="anchor anchorTargetStickyNavbar_Vzrq" id="clustering-fields-by-land-quality">Clustering fields by land quality<a href="https://docs-staging.fused.io/pr/1353/blog/h3-parcel-suitability/#clustering-fields-by-land-quality" class="hash-link" aria-label="Direct link to Clustering fields by land quality" title="Direct link to Clustering fields by land quality" translate="no">​</a></h3>
<p>To turn the table into a suitability signal, the canvas runs KMeans on two per-field measures, mean NDVI and mean slope. The three clusters are ranked by vegetation vigor against terrain roughness and labeled "High vegetation · Low slope", "Moderate" and "Low vegetation · High slope". A linked map and scatter plot let you hover a field on either side and see where it falls.</p>
<h3 class="anchor anchorTargetStickyNavbar_Vzrq" id="a-dashboard-you-can-ask-questions">A dashboard you can ask questions<a href="https://docs-staging.fused.io/pr/1353/blog/h3-parcel-suitability/#a-dashboard-you-can-ask-questions" class="hash-link" aria-label="Direct link to A dashboard you can ask questions" title="Direct link to A dashboard you can ask questions" translate="no">​</a></h3>
<p>Everything ends in a Land Intelligence dashboard:</p>
<ul>
<li class=""><strong>Parcel selector:</strong> sets the area for the whole pipeline</li>
<li class=""><strong>Multi-layer map:</strong> every feature as a toggleable hex layer, with farm boundaries on top, elevation and slope in 3D, and hexes switching between resolutions 8 and 11 as you zoom</li>
<li class=""><strong>Filter bar:</strong> narrows farms by NDVI, slope, elevation, temperature, rain, irrigation, crop, soil or land-cover cluster</li>
<li class=""><strong>"Ask your data" chat:</strong> an AI assistant that answers questions with read-only SQL over the parcel's per-hex table</li>
</ul>
<p>The demo uses farmland in Iowa, but the workflow (ingest diverse layers, standardize them to one hex grid, then query and model) applies to any land-parcel dataset.</p>
<h3 class="anchor anchorTargetStickyNavbar_Vzrq" id="learn-more">Learn more<a href="https://docs-staging.fused.io/pr/1353/blog/h3-parcel-suitability/#learn-more" class="hash-link" aria-label="Direct link to Learn more" title="Direct link to Learn more" translate="no">​</a></h3>
<ul>
<li class=""><a href="https://www.fused.io/canvas/fc_fused/H3_Parcel_Suitability" target="_blank" rel="noopener noreferrer" class="">Open the H3 Parcel Suitability canvas</a></li>
<li class=""><a class="" href="https://docs-staging.fused.io/pr/1353/guide/h3-analytics/h3-large-datasets/">Ingest, Index &amp; Query H3 Datasets</a></li>
<li class=""><a class="" href="https://docs-staging.fused.io/pr/1353/guide/h3-analytics/raster-ingestion/">Raster Ingestion Pipeline</a></li>
<li class=""><a class="" href="https://docs-staging.fused.io/pr/1353/guide/h3-analytics/joining/">Joining</a></li>
</ul>]]></content>
        <author>
            <name>Tula van Balen</name>
            <uri>https://www.linkedin.com/in/tula-van-balen-01b7a299/</uri>
        </author>
        <category label="h3" term="h3"/>
        <category label="h3 conference" term="h3 conference"/>
        <category label="agriculture" term="agriculture"/>
        <category label="land suitability" term="land suitability"/>
        <category label="canvas" term="canvas"/>
    </entry>
    <entry>
        <title type="html"><![CDATA[Spatial Intelligence Using Hexagons]]></title>
        <id>https://docs-staging.fused.io/pr/1353/blog/spatial-intelligence-using-hexagons/</id>
        <link href="https://docs-staging.fused.io/pr/1353/blog/spatial-intelligence-using-hexagons/"/>
        <updated>2026-09-23T12:10:00.000Z</updated>
        <summary type="html"><![CDATA[Sina Kashuk rebuilds his 2018 H3 talk with AI, shows ring-based smoothing kernels and an offline demo that scores the vibe of every hexagon in a city, and Isaac Brodsky queries a new H3-native climate dataset of about 100 TB.]]></summary>
        <content type="html"><![CDATA[<p>Sina Kashuk, CEO of <a href="https://www.fused.io/" target="_blank" rel="noopener noreferrer" class="">Fused</a>, and Isaac Brodsky, CTO and co-founder of Fused, both worked on H3 at Uber. In this talk at the <a class="" href="https://docs-staging.fused.io/pr/1353/blog/h3-conference-2026/">H3 Conference 2026</a> in New York City, they revisited the H3 ideas Sina presented eight years ago and showed two new things built on them: an AI model that scores hexagons offline on a laptop, and an open H3-native climate dataset.</p>
<!-- -->
<iframe style="width:100%;max-width:800px;aspect-ratio:16/9;height:auto;margin:0 auto 2rem auto;display:block" src="https://www.youtube.com/embed/FOtCjHLFiNQ" title="Spatial Intelligence Using Hexagons" frameborder="0" allow="accelerometer; autoplay; clipboard-write; encrypted-media; gyroscope; picture-in-picture; web-share" referrerpolicy="strict-origin-when-cross-origin" allowfullscreen=""></iframe>
<h3 class="anchor anchorTargetStickyNavbar_Vzrq" id="eight-years-later-the-same-ideas">Eight years later, the same ideas<a href="https://docs-staging.fused.io/pr/1353/blog/spatial-intelligence-using-hexagons/#eight-years-later-the-same-ideas" class="hash-link" aria-label="Direct link to Eight years later, the same ideas" title="Direct link to Eight years later, the same ideas" translate="no">​</a></h3>
<p>Eight years ago, Sina presented H3 at Uber's office around the time it was open-sourced. His first commit to Uber's main H3 repository was an example of how to unify data with it. For this talk he gave an AI a short prompt asking it to rebuild that 2018 presentation, and it produced a new version of the same material.</p>
<p>The core concepts have not changed: H3 as a unified data layer, and its hierarchy of resolutions. What has changed is some of the API naming. The function Sina used in 2018 to convert a latitude and longitude to a cell, <code>geoToH3</code>, is now <code>latLngToCell</code>. He asked the AI to list the API changes since 2018, and it handled the migration in one shot.</p>
<h3 class="anchor anchorTargetStickyNavbar_Vzrq" id="ring-based-kernels-for-smoothing">Ring-based kernels for smoothing<a href="https://docs-staging.fused.io/pr/1353/blog/spatial-intelligence-using-hexagons/#ring-based-kernels-for-smoothing" class="hash-link" aria-label="Direct link to Ring-based kernels for smoothing" title="Direct link to Ring-based kernels for smoothing" translate="no">​</a></h3>
<p>The main demo from the original talk is convolution-style analysis on H3. Because every cell is surrounded by rings of neighbors, you can assign a weight to each ring and spread a value outward, turning your data into a smooth heat map.</p>
<p>Sina's kernel used the center cell plus three rings around it, and a chart beside the map showed the weights as half of a bell curve, a normal distribution over distance. When he raised the weight of the outermost ring, the heat map recalculated in real time and stopped looking normal, because distant cells now carried more weight than nearby ones.</p>
<h3 class="anchor anchorTargetStickyNavbar_Vzrq" id="scoring-the-vibe-of-a-hexagon">Scoring the vibe of a hexagon<a href="https://docs-staging.fused.io/pr/1353/blog/spatial-intelligence-using-hexagons/#scoring-the-vibe-of-a-hexagon" class="hash-link" aria-label="Direct link to Scoring the vibe of a hexagon" title="Direct link to Scoring the vibe of a hexagon" translate="no">​</a></h3>
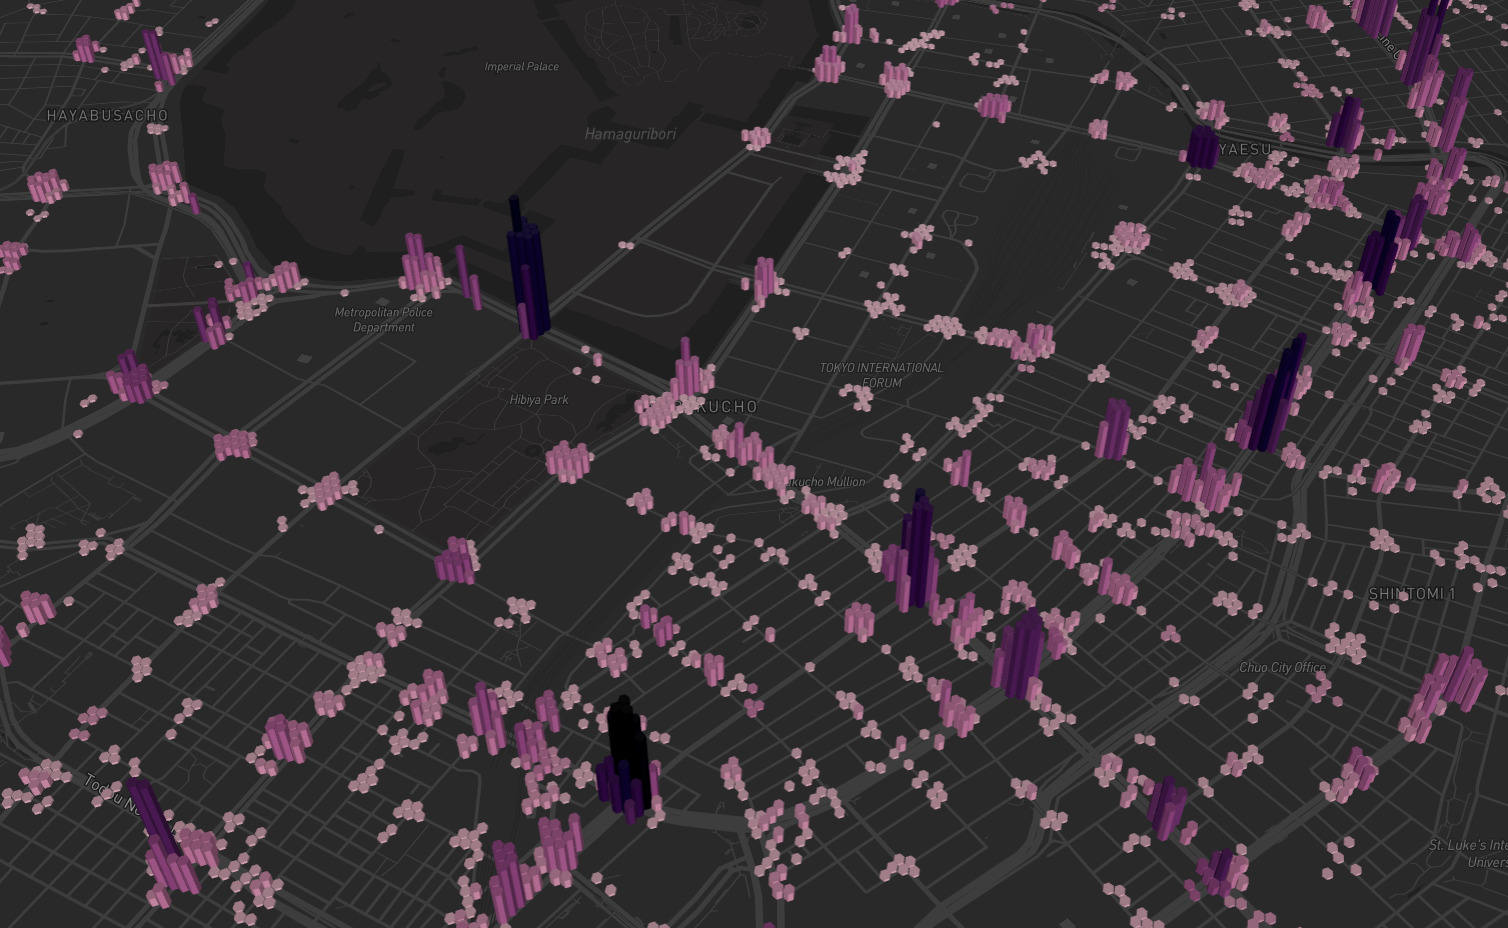
<p>The night before the conference, Sina used AI to build a second app. It takes Overture places, looks at the category of each point of interest, groups them into hexagons, and asks what the "vibe" of each hexagon is.</p>
<p>Sina writes a sentence, and a new AI classification model compares it with the categories found in each hexagon to produce a similarity score. The model takes about 10 ms per classification. After loading once, it worked through every hexagon on stage one call after another, in series rather than in parallel. He asked two questions:</p>
<ul>
<li class="">Where are the touristic areas in the city?</li>
<li class="">How dog friendly is each area?</li>
</ul>
<p>The app runs in Fused Render, a new Fused product that is 100% local software. You install it on your own computer and run models like this for free, with no data center involved. Sina noted it keeps working with Wi-Fi turned off.</p>
<h3 class="anchor anchorTargetStickyNavbar_Vzrq" id="100-tb-of-h3-native-climate-data">100 TB of H3-native climate data<a href="https://docs-staging.fused.io/pr/1353/blog/spatial-intelligence-using-hexagons/#100-tb-of-h3-native-climate-data" class="hash-link" aria-label="Direct link to 100 TB of H3-native climate data" title="Direct link to 100 TB of H3-native climate data" translate="no">​</a></h3>
<p>Isaac closed the talk by retrieving hourly climate data for San Francisco from two different years: several hundred thousand observations for a single location, loaded in a few seconds.</p>
<p>The access layer is something Fused built to make open geospatial data quick and easy to reach. The data itself is hosted on <a href="https://source.coop/" target="_blank" rel="noopener noreferrer" class="">Source Cooperative</a>. It is a new dataset of ERA5 and gridMET climate data, on the order of 100 TB, published in an H3-native format as open data.</p>
<h3 class="anchor anchorTargetStickyNavbar_Vzrq" id="learn-more">Learn more<a href="https://docs-staging.fused.io/pr/1353/blog/spatial-intelligence-using-hexagons/#learn-more" class="hash-link" aria-label="Direct link to Learn more" title="Direct link to Learn more" translate="no">​</a></h3>
<ul>
<li class=""><a href="https://www.youtube.com/watch?v=FOtCjHLFiNQ" target="_blank" rel="noopener noreferrer" class="">Watch the talk on YouTube</a></li>
<li class=""><a href="https://render.fused.io/" target="_blank" rel="noopener noreferrer" class="">Fused Render</a>, the local app Sina used for the vibe demo</li>
<li class=""><a class="" href="https://docs-staging.fused.io/pr/1353/guide/h3-analytics/h3-overview/">H3 Analytics Overview</a></li>
</ul>]]></content>
        <author>
            <name>Sina Kashuk</name>
            <uri>https://www.linkedin.com/in/skashuk/</uri>
        </author>
        <author>
            <name>Isaac Brodsky</name>
            <uri>https://www.linkedin.com/in/isaacbrodsky/</uri>
        </author>
        <category label="h3" term="h3"/>
        <category label="h3 conference" term="h3 conference"/>
        <category label="ai" term="ai"/>
        <category label="climate data" term="climate data"/>
        <category label="overture" term="overture"/>
    </entry>
    <entry>
        <title type="html"><![CDATA[The Decision Satellites Can't See]]></title>
        <id>https://docs-staging.fused.io/pr/1353/blog/the-decision-satellites-cant-see/</id>
        <link href="https://docs-staging.fused.io/pr/1353/blog/the-decision-satellites-cant-see/"/>
        <updated>2026-09-23T12:09:00.000Z</updated>
        <summary type="html"><![CDATA[Kristin Scholten shows how local grain prices drive what farmers plant, and how she used H3 to give every field in North Dakota a crop probability for the 2026 growing season.]]></summary>
        <content type="html"><![CDATA[<p><a href="https://www.nationwide.com/" target="_blank" rel="noopener noreferrer" class="">Kristin Scholten</a> is a farmer turned data scientist in the advanced analytics department at Nationwide, and she is building OpenFields, an AI prediction engine for agriculture. At the <a class="" href="https://docs-staging.fused.io/pr/1353/blog/h3-conference-2026/">H3 Conference 2026</a> in New York City, she argued that crop acreage is decided months before any satellite can see a plant, and showed how she used H3 to put a crop probability on every field in North Dakota.</p>
<!-- -->
<iframe style="width:100%;max-width:800px;aspect-ratio:16/9;height:auto;margin:0 auto 2rem auto;display:block" src="https://www.youtube.com/embed/CzQDt5DkvAw" title="The Decision Satellites Can't See" frameborder="0" allow="accelerometer; autoplay; clipboard-write; encrypted-media; gyroscope; picture-in-picture; web-share" referrerpolicy="strict-origin-when-cross-origin" allowfullscreen=""></iframe>
<h3 class="anchor anchorTargetStickyNavbar_Vzrq" id="acreage-moves-the-market">Acreage moves the market<a href="https://docs-staging.fused.io/pr/1353/blog/the-decision-satellites-cant-see/#acreage-moves-the-market" class="hash-link" aria-label="Direct link to Acreage moves the market" title="Direct link to Acreage moves the market" translate="no">​</a></h3>
<p>A couple of years ago, Kristin gave a talk on estimating crop yield from satellites using solar-induced fluorescence, which she calls a heart rate monitor for plants. Afterward, an agricultural commodity trader asked: can you do this for acreage? Acreage causes bigger swings in the market, and it is better to know it early.</p>
<p>According to Kristin, the USDA misses its acreage number by about 5 million acres every year. That is 582 cells at H3 resolution 6, roughly the size of New Jersey, and about $3 to $4 billion in the market.</p>
<p>Satellites see the crop too late to help. The USDA publishes projections in March, farmers plant in April and May, projections are updated in June, harvest runs through October and November, and the final numbers come out in January. The planting decision itself is made the previous fall, before there is anything to photograph.</p>
<h3 class="anchor anchorTargetStickyNavbar_Vzrq" id="a-farmers-choice-comes-down-to-local-prices">A farmer's choice comes down to local prices<a href="https://docs-staging.fused.io/pr/1353/blog/the-decision-satellites-cant-see/#a-farmers-choice-comes-down-to-local-prices" class="hash-link" aria-label="Direct link to A farmer's choice comes down to local prices" title="Direct link to A farmer's choice comes down to local prices" translate="no">​</a></h3>
<p>To make the point, Kristin invited an audience member to run a field in North Dakota and pick a crop for 2027. The field's history since 2018 followed a corn and soybean rotation that pointed to corn. Then she added information a farmer actually weighs:</p>
<ul>
<li class=""><strong>Input costs.</strong> Corn needs a lot of fertilizer, soybeans need little, and spring wheat sits in between.</li>
<li class=""><strong>National prices.</strong> December 2027 futures were $5.26 per bushel for corn, $12.87 for soybeans and $7.45 for spring wheat.</li>
<li class=""><strong>Local basis.</strong> The grain elevator, where farmers sell their harvest, adjusts prices based on its own supply. After the discount, the elevator paid $4.31 for corn, $12 for soybeans and $7 for spring wheat.</li>
</ul>
<p>With national prices and the rotation, corn looked like the answer. With the local elevator price, soybeans came out ahead, and the volunteer switched. That flip is what Kristin wants to predict.</p>
<h3 class="anchor anchorTargetStickyNavbar_Vzrq" id="from-hexagons-back-to-fields">From hexagons back to fields<a href="https://docs-staging.fused.io/pr/1353/blog/the-decision-satellites-cant-see/#from-hexagons-back-to-fields" class="hash-link" aria-label="Direct link to From hexagons back to fields" title="Direct link to From hexagons back to fields" translate="no">​</a></h3>
<p>H3 is how she gets a local price for every field. Using elevator locations, and the cost of hauling grain to them (some farms can choose between two elevators), she calculates a price for each hexagon. That value is then assigned to the fields inside each hex, which lets her estimate, field by field, the probability that a farmer flips their rotation. A single field might come out as a 52% chance of corn and a 41% chance of soybeans.</p>
<p>Asked why not compute distances point to point, Kristin said that would be the most granular approach but too compute heavy. Each hex holds hundreds of fields, so aggregating at the hex level and assigning values back to fields keeps the analysis manageable. The usual alternative, county-level aggregation, is not granular enough.</p>
<h3 class="anchor anchorTargetStickyNavbar_Vzrq" id="900000-fields-and-counting">900,000 fields and counting<a href="https://docs-staging.fused.io/pr/1353/blog/the-decision-satellites-cant-see/#900000-fields-and-counting" class="hash-link" aria-label="Direct link to 900,000 fields and counting" title="Direct link to 900,000 fields and counting" translate="no">​</a></h3>
<p>Kristin ran the model for all of North Dakota: more than 900,000 fields, predicting the 2026 growing season that was weeks from harvest at the time of the talk. The field boundaries are open data, much of it from the USDA, in line with the OpenFields mission of sharing data openly.</p>
<p>The fall model updates about once a month. In the spring it updates weekly, using factors such as frost-free days: North Dakota is getting more of them, so more farmers can grow corn, but a wet spring pushes acreage toward soybeans, which have a shorter growing season.</p>
<p>Her next step is measuring accuracy, including checking this season's predictions against satellite observations, and she invited collaborators to help.</p>
<h3 class="anchor anchorTargetStickyNavbar_Vzrq" id="learn-more">Learn more<a href="https://docs-staging.fused.io/pr/1353/blog/the-decision-satellites-cant-see/#learn-more" class="hash-link" aria-label="Direct link to Learn more" title="Direct link to Learn more" translate="no">​</a></h3>
<ul>
<li class=""><a href="https://www.youtube.com/watch?v=CzQDt5DkvAw" target="_blank" rel="noopener noreferrer" class="">Watch the talk on YouTube</a></li>
<li class=""><a class="" href="https://docs-staging.fused.io/pr/1353/guide/h3-analytics/aggregations/">Aggregations</a></li>
<li class=""><a class="" href="https://docs-staging.fused.io/pr/1353/guide/h3-analytics/joining/">Joining</a></li>
</ul>]]></content>
        <author>
            <name>Kristin Scholten</name>
            <uri>https://www.linkedin.com/in/kristinscholten/</uri>
        </author>
        <category label="h3" term="h3"/>
        <category label="h3 conference" term="h3 conference"/>
        <category label="agriculture" term="agriculture"/>
        <category label="crop prediction" term="crop prediction"/>
        <category label="commodities" term="commodities"/>
    </entry>
    <entry>
        <title type="html"><![CDATA[H3 as a GeoParquet Pyramid Builder]]></title>
        <id>https://docs-staging.fused.io/pr/1353/blog/h3-geoparquet-pyramid-builder/</id>
        <link href="https://docs-staging.fused.io/pr/1353/blog/h3-geoparquet-pyramid-builder/"/>
        <updated>2026-09-23T12:08:00.000Z</updated>
        <summary type="html"><![CDATA[Guillaume Sueur proposes using H3 cells to build a pyramid of overviews for GeoParquet, so large vector datasets display quickly from remote storage.]]></summary>
        <content type="html"><![CDATA[<p><a href="https://geomermaids.com/" target="_blank" rel="noopener noreferrer" class="">Guillaume Sueur</a> is the founder of Geomermaids, a Boston-based consultancy that designs cloud-native geospatial systems, with 25 years in GIS. At the <a class="" href="https://docs-staging.fused.io/pr/1353/blog/h3-conference-2026/">H3 Conference 2026</a> in New York City, Guillaume showed how H3 can give GeoParquet something it lacks today: overviews, built as a self-discovering pyramid of files keyed by H3 cell.</p>
<!-- -->
<iframe style="width:100%;max-width:800px;aspect-ratio:16/9;height:auto;margin:0 auto 2rem auto;display:block" src="https://www.youtube.com/embed/t4MzvtzRZBI" title="H3 as a GeoParquet Pyramid Builder" frameborder="0" allow="accelerometer; autoplay; clipboard-write; encrypted-media; gyroscope; picture-in-picture; web-share" referrerpolicy="strict-origin-when-cross-origin" allowfullscreen=""></iframe>
<h3 class="anchor anchorTargetStickyNavbar_Vzrq" id="why-vector-data-is-hard-to-just-look-at">Why vector data is hard to just look at<a href="https://docs-staging.fused.io/pr/1353/blog/h3-geoparquet-pyramid-builder/#why-vector-data-is-hard-to-just-look-at" class="hash-link" aria-label="Direct link to Why vector data is hard to just look at" title="Direct link to Why vector data is hard to just look at" translate="no">​</a></h3>
<p>Guillaume gave two reasons geospatial data is special. First, we want to see the map. GIS users routinely draw every feature, even at scales where the detail can't be seen, something nobody does with a 3 million row spreadsheet.</p>
<p>Second, we don't know what's inside the box. A geometry column can hold a point, a four-vertex polygon, or a 300,000-vertex object weighing 5 MB, and there is no way to tell before opening it. The example was a single Corine Land Cover multipolygon near Paris with 138,352 vertices. There is no "small geometry" or "big geometry" type the way databases have small and big integers. Raster data avoids this: pixels are uniform, the resolution is in the metadata, and Cloud Optimized GeoTIFFs ship with overviews.</p>
<h3 class="anchor anchorTargetStickyNavbar_Vzrq" id="what-geoparquet-gives-you-and-what-it-doesnt">What GeoParquet gives you, and what it doesn't<a href="https://docs-staging.fused.io/pr/1353/blog/h3-geoparquet-pyramid-builder/#what-geoparquet-gives-you-and-what-it-doesnt" class="hash-link" aria-label="Direct link to What GeoParquet gives you, and what it doesn't" title="Direct link to What GeoParquet gives you, and what it doesn't" translate="no">​</a></h3>
<p>Parquet is columnar: it compresses well and keeps per-column min and max statistics so a query planner can skip data. GeoParquet adds a geometry column (usually well-known binary), a coordinate reference system and per-row-group bounding boxes, and it supports HTTP range requests, so readers fetch only the bytes they need from a remote file.</p>
<p>The caveats: there is no real spatial index beyond row groups, so readers can fetch far more features than needed, nothing stops a too-big-to-draw geometry from loading, and there are no overviews.</p>
<h3 class="anchor anchorTargetStickyNavbar_Vzrq" id="options-for-vector-overviews">Options for vector overviews<a href="https://docs-staging.fused.io/pr/1353/blog/h3-geoparquet-pyramid-builder/#options-for-vector-overviews" class="hash-link" aria-label="Direct link to Options for vector overviews" title="Direct link to Options for vector overviews" translate="no">​</a></h3>
<p>Guillaume walked through the alternatives first:</p>
<ul>
<li class=""><strong>A second geometry column:</strong> easy, but you may need three or four levels, and a generic reader won't know which column to use.</li>
<li class=""><strong>A sidecar file:</strong> two files to keep in sync, as with shapefiles.</li>
<li class=""><strong>Bounding boxes:</strong> Corine Land Cover's 2.5 million features display in a few seconds, but in-between zoom levels look strange.</li>
<li class=""><strong>Grouping by feature area:</strong> on Massachusetts parcels, big rural and parkland parcels show first while dense Boston and Cambridge lose detail.</li>
</ul>
<h3 class="anchor anchorTargetStickyNavbar_Vzrq" id="the-h3-pyramid">The H3 pyramid<a href="https://docs-staging.fused.io/pr/1353/blog/h3-geoparquet-pyramid-builder/#the-h3-pyramid" class="hash-link" aria-label="Direct link to The H3 pyramid" title="Direct link to The H3 pyramid" translate="no">​</a></h3>
<p>Guillaume picks a base H3 resolution where every feature is kept at full detail, then builds coarser levels above it. For about 2.5 million Massachusetts parcels at resolution 6, that means 697 files, one per H3 cell. At resolution 4, the whole state comes down to seven objects.</p>
<p>Each level up is built in one of three ways:</p>
<ul>
<li class=""><strong>Simplify:</strong> remove vertices, a good fit for roads. The parcel count stays at 2.5 million.</li>
<li class=""><strong>Prune:</strong> drop features by a rule, a good fit for points. In the example, pruning cut the level to 78 MB.</li>
<li class=""><strong>Dissolve:</strong> merge polygons, then optionally simplify. In the example, dissolving produced 123 rows and only 10 MB.</li>
</ul>
<p>A 10 MB first level on S3 displays almost immediately, instead of waiting for a 500 MB file to download before anything draws. Analytic columns can be summed or averaged during aggregation, so coarse levels still carry meaningful values.</p>
<p>H3 contributes three things. The cell ID becomes the file name. Each cell knows its parent, so a reader moves through the pyramid by changing which file it opens. And the cell ID is a ready-made group-by key for dissolving, with no spatial operations needed. The hexagons only organize the data; viewers never see them.</p>
<p>In Q&amp;A, Guillaume said the levels are baked into a GeoParquet dataset partitioned by resolution, then by cell. Ideally the pyramid would adapt like a quadtree, getting finer only where the data has more detail.</p>
<h3 class="anchor anchorTargetStickyNavbar_Vzrq" id="not-a-replacement-for-vector-tiles">Not a replacement for vector tiles<a href="https://docs-staging.fused.io/pr/1353/blog/h3-geoparquet-pyramid-builder/#not-a-replacement-for-vector-tiles" class="hash-link" aria-label="Direct link to Not a replacement for vector tiles" title="Direct link to Not a replacement for vector tiles" translate="no">​</a></h3>
<p>Vector tiles such as PMTiles remain more efficient for web mapping, Guillaume said, but tiles carry only the fields chosen for display, while the pyramid keeps the full dataset available for analytics. The approach is a convention, not a standard, with one reader so far: Guillaume's own. Open questions include whether overviews belong in the GeoParquet spec and whether grids such as A5 would work as well. Guillaume's open source <a href="https://geomermaids.com/geopq-workbench" target="_blank" rel="noopener noreferrer" class="">GeoPQ Workbench</a> app is on GitHub.</p>
<h3 class="anchor anchorTargetStickyNavbar_Vzrq" id="learn-more">Learn more<a href="https://docs-staging.fused.io/pr/1353/blog/h3-geoparquet-pyramid-builder/#learn-more" class="hash-link" aria-label="Direct link to Learn more" title="Direct link to Learn more" translate="no">​</a></h3>
<ul>
<li class=""><a href="https://www.youtube.com/watch?v=t4MzvtzRZBI" target="_blank" rel="noopener noreferrer" class="">Watch the talk on YouTube</a></li>
<li class=""><a class="" href="https://docs-staging.fused.io/pr/1353/guide/h3-analytics/h3-large-datasets/">Ingest, Index &amp; Query H3 Datasets</a></li>
<li class=""><a class="" href="https://docs-staging.fused.io/pr/1353/guide/h3-analytics/visualization/">Visualization</a></li>
</ul>]]></content>
        <author>
            <name>Guillaume Sueur</name>
            <uri>https://www.linkedin.com/in/gsueur/</uri>
        </author>
        <category label="h3" term="h3"/>
        <category label="h3 conference" term="h3 conference"/>
        <category label="geoparquet" term="geoparquet"/>
        <category label="cloud-native" term="cloud-native"/>
        <category label="visualization" term="visualization"/>
    </entry>
    <entry>
        <title type="html"><![CDATA[Lessons from Mapping Earth Observation Data with H3]]></title>
        <id>https://docs-staging.fused.io/pr/1353/blog/mapping-earth-observation-data-with-h3/</id>
        <link href="https://docs-staging.fused.io/pr/1353/blog/mapping-earth-observation-data-with-h3/"/>
        <updated>2026-09-23T12:07:00.000Z</updated>
        <summary type="html"><![CDATA[Marie Hoeger shares two case studies: a Brazil-scale reforestation suitability map built from many data layers on H3, and global methane plume detections aggregated to hexagons.]]></summary>
        <content type="html"><![CDATA[<p><a href="https://carbonmapper.org/" target="_blank" rel="noopener noreferrer" class="">Marie Hoeger</a> is a Staff Engineer at Carbon Mapper, where she works on the data systems behind a freely accessible catalog of global methane and CO2 emissions observations, and previously led a geospatial ML platform team at Pachama. At the <a class="" href="https://docs-staging.fused.io/pr/1353/blog/h3-conference-2026/">H3 Conference 2026</a> in New York City, she shared lessons from two projects: combining many data layers on H3 to score land for reforestation across Brazil, and mapping sparse global methane detections.</p>
<!-- -->
<iframe style="width:100%;max-width:800px;aspect-ratio:16/9;height:auto;margin:0 auto 2rem auto;display:block" src="https://www.youtube.com/embed/DOD_nGg9Omg" title="Lessons from Mapping Earth Observation Data with H3" frameborder="0" allow="accelerometer; autoplay; clipboard-write; encrypted-media; gyroscope; picture-in-picture; web-share" referrerpolicy="strict-origin-when-cross-origin" allowfullscreen=""></iframe>
<h3 class="anchor anchorTargetStickyNavbar_Vzrq" id="many-layers-behind-one-question">Many layers behind one question<a href="https://docs-staging.fused.io/pr/1353/blog/mapping-earth-observation-data-with-h3/#many-layers-behind-one-question" class="hash-link" aria-label="Direct link to Many layers behind one question" title="Direct link to Many layers behind one question" translate="no">​</a></h3>
<p>At Pachama, a carbon credit integrity startup, Marie's team looked for land promising for reforestation. That meant combining very different inputs:</p>
<ul>
<li class="">biophysical characteristics of the land from satellite imagery, including existing canopy height and recent growth</li>
<li class="">whether the area is a natural wetland that shouldn't be forested</li>
<li class="">biodiversity impact for mammals or birds</li>
<li class="">properties with disputed land claims</li>
<li class="">reforestation and land purchase costs</li>
<li class="">distance to roads, which helps reforestation but works against avoided deforestation</li>
</ul>
<p>Their earlier parcel-level approach, overlapping layers at native resolutions, didn't scale to whole landscapes or to customers uploading an area for answers on demand. Scientific suitability also isn't buyer suitability: one customer whose brand was all about blue wanted "blue carbon" near waterways.</p>
<h3 class="anchor anchorTargetStickyNavbar_Vzrq" id="the-brazil-eucalyptus-map">The Brazil eucalyptus map<a href="https://docs-staging.fused.io/pr/1353/blog/mapping-earth-observation-data-with-h3/#the-brazil-eucalyptus-map" class="hash-link" aria-label="Direct link to The Brazil eucalyptus map" title="Direct link to The Brazil eucalyptus map" translate="no">​</a></h3>
<p>A customer working on sustainable aviation fuels, who was funding a research group in Brazil, asked where eucalyptus planting would make sense across the country. The constraints were:</p>
<ul>
<li class="">data that works at country scale but still says something when you zoom in to a property</li>
<li class="">many datasets at different resolutions</li>
<li class="">algorithmic artifacts, such as swirly blobs from distance-to calculations and blocky lines from a convolution filter, that distracted viewers</li>
</ul>
<p>They landed on H3, DuckDB and Fused. All variables were normalized onto the same bad-to-good scale using easy-to-explain assumptions. Each layer was converted to Parquet at a consistent minimum H3 resolution (Marie recalled resolution 10). An H3 map tile server built with DuckDB and Fused then either served native-resolution hexes or aggregated to parent cells on the fly as users zoomed out.</p>
<p>Viewers liked the look of the hex grid, the artifacts stopped prompting questions, and iteration was fast. Because the score was computed on request, factors could be weighted per customer (biodiversity first, or land price first), a planned feature that worked at small scale.</p>
<h3 class="anchor anchorTargetStickyNavbar_Vzrq" id="what-was-hard">What was hard<a href="https://docs-staging.fused.io/pr/1353/blog/mapping-earth-observation-data-with-h3/#what-was-hard" class="hash-link" aria-label="Direct link to What was hard" title="Direct link to What was hard" translate="no">​</a></h3>
<p>The partner research team ran GeoServer with fewer resources, so they ultimately received TIFF summaries instead of an H3 tile server. Computing overviews on the fly also caused latency on the large dataset. Caching kept it usable, but Marie concluded that precomputed H3 overviews were needed at country scale. She noted this work predated Fused's <code>run_ingest_raster_to_h3</code> helper, which now handles that step.</p>
<p>In Q&amp;A she clarified that only each layer's overview levels need precomputing, not every combination of user inputs, so dynamic weighting stays quick at any zoom.</p>
<h3 class="anchor anchorTargetStickyNavbar_Vzrq" id="sparse-methane-detections-on-a-hex-grid">Sparse methane detections on a hex grid<a href="https://docs-staging.fused.io/pr/1353/blog/mapping-earth-observation-data-with-h3/#sparse-methane-detections-on-a-hex-grid" class="hash-link" aria-label="Direct link to Sparse methane detections on a hex grid" title="Direct link to Sparse methane detections on a hex grid" translate="no">​</a></h3>
<p>Carbon Mapper processes satellite data to detect methane leaks and publishes the results as an open dataset. Today its <a href="https://data.carbonmapper.org/" target="_blank" rel="noopener noreferrer" class="">data portal</a> marks each plume detection as a point. Marie has been showing internally an H3 version where detections are aggregated into hex bins. Empty hexes are informative too, and clusters in places like California and Turkmenistan stand out.</p>
<p>The hex view also exposes observation bias. Carbon Mapper looks at California most often because of a partnership with the state government, so California appears to be doing very badly, while overall emissions tell a different story. Hexes make it easier to toggle between the two.</p>
<p>The workflow was short: take the vector file of detected plume points, use DuckDB in Fused to aggregate them into hex bins, write a UDF to render the map, and share it.</p>
<h3 class="anchor anchorTargetStickyNavbar_Vzrq" id="takeaways">Takeaways<a href="https://docs-staging.fused.io/pr/1353/blog/mapping-earth-observation-data-with-h3/#takeaways" class="hash-link" aria-label="Direct link to Takeaways" title="Direct link to Takeaways" translate="no">​</a></h3>
<ul>
<li class="">H3 works well for combining multi-scale data, summarizing layers with distracting artifacts, and mapping sparse data.</li>
<li class="">Consider partner teams' legacy constraints early.</li>
<li class="">Mapping from user inputs is efficient on small datasets with H3, and on larger ones with precomputed overviews.</li>
<li class="">Iterating on visual outputs with real data makes collaboration faster.</li>
</ul>
<h3 class="anchor anchorTargetStickyNavbar_Vzrq" id="learn-more">Learn more<a href="https://docs-staging.fused.io/pr/1353/blog/mapping-earth-observation-data-with-h3/#learn-more" class="hash-link" aria-label="Direct link to Learn more" title="Direct link to Learn more" translate="no">​</a></h3>
<ul>
<li class=""><a href="https://www.youtube.com/watch?v=DOD_nGg9Omg" target="_blank" rel="noopener noreferrer" class="">Watch the talk on YouTube</a></li>
<li class=""><a class="" href="https://docs-staging.fused.io/pr/1353/guide/h3-analytics/raster-ingestion/">Raster Ingestion Pipeline</a></li>
<li class=""><a class="" href="https://docs-staging.fused.io/pr/1353/guide/h3-analytics/aggregations/">Aggregations</a></li>
</ul>]]></content>
        <author>
            <name>Marie Hoeger</name>
            <uri>https://www.linkedin.com/in/marie-hoeger-18484898/</uri>
        </author>
        <category label="h3" term="h3"/>
        <category label="h3 conference" term="h3 conference"/>
        <category label="earth observation" term="earth observation"/>
        <category label="methane" term="methane"/>
        <category label="reforestation" term="reforestation"/>
    </entry>
    <entry>
        <title type="html"><![CDATA[The Geography of Basketball]]></title>
        <id>https://docs-staging.fused.io/pr/1353/blog/geography-of-basketball/</id>
        <link href="https://docs-staging.fused.io/pr/1353/blog/geography-of-basketball/"/>
        <updated>2026-09-23T12:06:00.000Z</updated>
        <summary type="html"><![CDATA[Matt Forrest builds an H3 index of basketball across the US from outdoor courts, inferred indoor courts, team territories and player hometowns, then smooths it with neighbor rings to find the most basketball-heavy cell.]]></summary>
        <content type="html"><![CDATA[<p><a href="https://wherobots.com/" target="_blank" rel="noopener noreferrer" class="">Matt Forrest</a> of Wherobots is a geospatial data expert who helps GIS professionals adopt cloud-native geospatial infrastructure and hosts the Spatial Stack podcast. At the <a class="" href="https://docs-staging.fused.io/pr/1353/blog/h3-conference-2026/">H3 Conference 2026</a> in New York City, he showed how H3 turned the question "where is the geography of basketball?" into a single index that can be compared across the whole country.</p>
<!-- -->
<iframe style="width:100%;max-width:800px;aspect-ratio:16/9;height:auto;margin:0 auto 2rem auto;display:block" src="https://www.youtube.com/embed/Lf06iBnTmrI" title="The Geography of Basketball" frameborder="0" allow="accelerometer; autoplay; clipboard-write; encrypted-media; gyroscope; picture-in-picture; web-share" referrerpolicy="strict-origin-when-cross-origin" allowfullscreen=""></iframe>
<h3 class="anchor anchorTargetStickyNavbar_Vzrq" id="four-layers-of-basketball-data">Four layers of basketball data<a href="https://docs-staging.fused.io/pr/1353/blog/geography-of-basketball/#four-layers-of-basketball-data" class="hash-link" aria-label="Direct link to Four layers of basketball data" title="Direct link to Four layers of basketball data" translate="no">​</a></h3>
<p>Basketball is often called the sport of New York City, and Matt wanted to know whether anyone had actually put the geography of basketball on a map. OpenStreetMap and Overture had mapped the courts, so he started pulling the pieces together:</p>
<ul>
<li class=""><strong>Outdoor courts:</strong> about 91,000 courts in <a href="https://overturemaps.org/" target="_blank" rel="noopener noreferrer" class="">Overture Maps</a>, which pulls from OpenStreetMap and other sources.</li>
<li class=""><strong>Indoor courts:</strong> nobody maps a court inside a building, so Matt inferred them. He looked for buildings roughly three to four times the size of a basketball court, and for places likely to have one: schools, churches, gyms, and YMCAs and YWCAs. He gave YMCAs and YWCAs extra weight, since basketball was invented at a YMCA.</li>
<li class=""><strong>Teams:</strong> every NBA and WNBA team plus NCAA Division I men's and women's programs, each with a territory and an index of how successful it is.</li>
<li class=""><strong>Players:</strong> placed at their hometowns.</li>
</ul>
<p>Each layer had quirks. Overture's gym tags pulled in 24 Hour Fitness locations, which don't have basketball gyms. College teams created dense, overlapping clusters in the Northeast. And measuring an individual player's impact is hard, since a player's hometown, college and pro teams can all be in different places. Matt chose to use the hometown only.</p>
<h3 class="anchor anchorTargetStickyNavbar_Vzrq" id="joining-population-without-a-spatial-join">Joining population without a spatial join<a href="https://docs-staging.fused.io/pr/1353/blog/geography-of-basketball/#joining-population-without-a-spatial-join" class="hash-link" aria-label="Direct link to Joining population without a spatial join" title="Direct link to Joining population without a spatial join" translate="no">​</a></h3>
<p>H3 cells gave Matt a consistent way to study all of this across the entire country. For population, he used the Kontur population grid, which is already published on H3 at about 400 m cells. Because both datasets share the same index, he could join population on the cell ID directly.</p>
<p>That is one of the things Matt likes most about H3: when data lives in a unified system, you don't need a spatial join every time. You use the index itself.</p>
<h3 class="anchor anchorTargetStickyNavbar_Vzrq" id="spreading-influence-with-neighbor-rings">Spreading influence with neighbor rings<a href="https://docs-staging.fused.io/pr/1353/blog/geography-of-basketball/#spreading-influence-with-neighbor-rings" class="hash-link" aria-label="Direct link to Spreading influence with neighbor rings" title="Direct link to Spreading influence with neighbor rings" translate="no">​</a></h3>
<p>The hardest part was measuring the impact of things that aren't really spatial, like teams and players. Hometowns cluster unevenly. Chicago stands out because so many players come from one big city, while New York players list Brooklyn, Queens, Flushing, Staten Island or a town in New Jersey.</p>
<p>Before smoothing, Chicago's concentration of players put the top player cell in the middle of Lake Michigan. To fix this, Matt used H3 neighbors with weights that decrease as they move outward, a distance decay. Each player or team spreads its influence based on factors like how long they played and how many wins or championships they had. The smoothed index gives a much clearer picture than the raw version, which showed large circles where teams were drawn. A few cells crossing the antimeridian also produced odd results.</p>
<h3 class="anchor anchorTargetStickyNavbar_Vzrq" id="the-most-basketball-heavy-cell">The most basketball-heavy cell<a href="https://docs-staging.fused.io/pr/1353/blog/geography-of-basketball/#the-most-basketball-heavy-cell" class="hash-link" aria-label="Direct link to The most basketball-heavy cell" title="Direct link to The most basketball-heavy cell" translate="no">​</a></h3>
<p>With everything combined, the top cell is in Queens. Its center court is Grover Cleveland Playground. Matt was clear that the index is subjective and can be sliced in different ways:</p>
<ul>
<li class="">Weighting heavily by population moves the top cell to Santa Clara, partly because of how many courts have been mapped there.</li>
<li class="">Weighting by pure geography puts the center of basketball in Jacksonville, Illinois.</li>
</ul>
<h3 class="anchor anchorTargetStickyNavbar_Vzrq" id="learn-more">Learn more<a href="https://docs-staging.fused.io/pr/1353/blog/geography-of-basketball/#learn-more" class="hash-link" aria-label="Direct link to Learn more" title="Direct link to Learn more" translate="no">​</a></h3>
<ul>
<li class=""><a href="https://www.youtube.com/watch?v=Lf06iBnTmrI" target="_blank" rel="noopener noreferrer" class="">Watch the talk on YouTube</a></li>
<li class=""><a class="" href="https://docs-staging.fused.io/pr/1353/guide/h3-analytics/joining/">Joining H3 datasets</a></li>
<li class=""><a class="" href="https://docs-staging.fused.io/pr/1353/guide/h3-analytics/aggregations/">Aggregations</a></li>
</ul>]]></content>
        <author>
            <name>Matt Forrest</name>
            <uri>https://www.linkedin.com/in/mbforr/</uri>
        </author>
        <category label="h3" term="h3"/>
        <category label="h3 conference" term="h3 conference"/>
        <category label="sports" term="sports"/>
        <category label="overture" term="overture"/>
        <category label="population" term="population"/>
    </entry>
    <entry>
        <title type="html"><![CDATA[Is Your GeoAI Solving for Earth or for Flat Maps?]]></title>
        <id>https://docs-staging.fused.io/pr/1353/blog/geoai-for-earth-or-flat-maps/</id>
        <link href="https://docs-staging.fused.io/pr/1353/blog/geoai-for-earth-or-flat-maps/"/>
        <updated>2026-09-23T12:05:00.000Z</updated>
        <summary type="html"><![CDATA[Levente Juhász shows how pixel-based GeoAI models inherit projection distortion, even within a single UTM zone, and compares H3 with other discrete global grid systems on geometry and tooling, and shows cell-ID joins outpacing geometry joins.]]></summary>
        <content type="html"><![CDATA[<p><a href="https://www.ufl.edu/" target="_blank" rel="noopener noreferrer" class="">Levente Juhász</a> is an Assistant Professor of Geospatial Analytics at the University of Florida and director of the Geospatial Analytics, Technology and Open Research (GATOR) Lab. At the <a class="" href="https://docs-staging.fused.io/pr/1353/blog/h3-conference-2026/">H3 Conference 2026</a> in New York City, Levente argued that GeoAI models built on flat, pixel-based maps carry projection distortion into their answers, and that discrete global grid systems (DGGS) such as H3 are a better foundation, as long as you understand their trade-offs.</p>
<!-- -->
<iframe style="width:100%;max-width:800px;aspect-ratio:16/9;height:auto;margin:0 auto 2rem auto;display:block" src="https://www.youtube.com/embed/I6tIi5CJcrU" title="Is Your GeoAI Solving for Earth or for Flat Maps?" frameborder="0" allow="accelerometer; autoplay; clipboard-write; encrypted-media; gyroscope; picture-in-picture; web-share" referrerpolicy="strict-origin-when-cross-origin" allowfullscreen=""></iframe>
<h3 class="anchor anchorTargetStickyNavbar_Vzrq" id="flat-maps-distort-even-inside-one-utm-zone">Flat maps distort, even inside one UTM zone<a href="https://docs-staging.fused.io/pr/1353/blog/geoai-for-earth-or-flat-maps/#flat-maps-distort-even-inside-one-utm-zone" class="hash-link" aria-label="Direct link to Flat maps distort, even inside one UTM zone" title="Direct link to Flat maps distort, even inside one UTM zone" translate="no">​</a></h3>
<p>Levente is a geographer by training. Noticing that foundation models such as AlphaEarth still rely on flat, pixel-based maps, Levente measured the distortion of the UTM projection that AlphaEarth uses across Florida.</p>
<p>Even UTM, which is precise locally by design, shows it:</p>
<ul>
<li class="">A 10 m by 10 m pixel near St. Augustine, at the center of the zone, covers more than 100 square meters of the Earth's surface.</li>
<li class="">The same pixel near Tallahassee, close to the zone edge, covers less than 100 square meters.</li>
<li class="">The difference is a 0.23% area discrepancy. That sounds like nothing, but for 100 m by 100 m pixels it becomes 23 square meters per pixel, about the size of a large garden shed.</li>
</ul>
<p>No one, Levente said, has looked into whether this makes global analyses underestimate or overestimate things. Flat maps also break at their edges: places in Fiji that sit next to each other split apart when the map is treated as a continuous coordinate space. In Levente's words, we are forcing geo models to solve problems that don't exist natively on the sphere.</p>
<p>Flat maps made sense in the era of the Mercator projection, paper maps and early computers. Today, Levente argued, they are largely technical legacy, and we have the compute and the math to move to data structures that might give more accurate, less biased answers.</p>
<h3 class="anchor anchorTargetStickyNavbar_Vzrq" id="how-discrete-global-grids-are-built">How discrete global grids are built<a href="https://docs-staging.fused.io/pr/1353/blog/geoai-for-earth-or-flat-maps/#how-discrete-global-grids-are-built" class="hash-link" aria-label="Direct link to How discrete global grids are built" title="Direct link to How discrete global grids are built" translate="no">​</a></h3>
<p>A DGGS starts from a base solid, usually a platonic solid such as an icosahedron or a cube, projects it onto a sphere or ellipsoid, and reconstructs the cells. H3 uses hexagons, Google's S2 uses quadrilaterals, and pentagonal systems exist too. All of them offer topological consistency across the globe: no edges, cells that work at the poles, and spatially and temporally stable cell identifiers.</p>
<h3 class="anchor anchorTargetStickyNavbar_Vzrq" id="benchmarking-h3-against-other-grids">Benchmarking H3 against other grids<a href="https://docs-staging.fused.io/pr/1353/blog/geoai-for-earth-or-flat-maps/#benchmarking-h3-against-other-grids" class="hash-link" aria-label="Direct link to Benchmarking H3 against other grids" title="Direct link to Benchmarking H3 against other grids" translate="no">​</a></h3>
<p>Levente built a simple Python benchmarking utility that abstracts the leading DGGS implementations so experiments can be plugged in. The talk abstract lists S2, A5, ISEA and HEALPix variants among the grids compared with H3. Two of the experiments stood out:</p>
<ul>
<li class=""><strong>Area and angular distortion.</strong> H3 cells are not constant in area, so H3 alone does not solve the UTM problem above, while some other DGGS are fully equal area by design. Hexagonal grids like H3 are smooth on angular distortion because of the hexagon's regularity.</li>
<li class=""><strong>Spatial join speed.</strong> Joining on cell IDs, implemented properly, is far faster than the usual coordinate geometry approach with <code>ST_Intersects</code>. Levente advocates moving science from desktop GIS approaches to faster, cloud-native ones.</li>
</ul>
<p>H3 is the most widely adopted DGGS because of its tooling: it works out of the box in DuckDB through a community extension, has an optimized core, and is fast and easy to learn. The equal-area "scientific" grids lack that tooling, which holds back their adoption.</p>
<h3 class="anchor anchorTargetStickyNavbar_Vzrq" id="h3s-area-variation-matters-for-analysis">H3's area variation matters for analysis<a href="https://docs-staging.fused.io/pr/1353/blog/geoai-for-earth-or-flat-maps/#h3s-area-variation-matters-for-analysis" class="hash-link" aria-label="Direct link to H3's area variation matters for analysis" title="Direct link to H3's area variation matters for analysis" translate="no">​</a></h3>
<p>The caution for H3 users: it is not an equal-area grid, and cell sizes vary by more than 10% by design. That doesn't matter for visualization and many other uses, but it matters for analytical work.</p>
<p>To show the effect, Levente intersected Foursquare Open Source Places, more than 100 million POIs worldwide, with H3 cells, ranked the cells by POI count, then ranked them again taking each cell's area into account. More than 80% of the cells moved by over 1% in the ranking just because of the area mismatch.</p>
<p>The conclusion: H3 is currently the best-supported DGGS and works for a wide range of use cases, but academia should pay more attention to these grids, especially equal-area ones.</p>
<h3 class="anchor anchorTargetStickyNavbar_Vzrq" id="learn-more">Learn more<a href="https://docs-staging.fused.io/pr/1353/blog/geoai-for-earth-or-flat-maps/#learn-more" class="hash-link" aria-label="Direct link to Learn more" title="Direct link to Learn more" translate="no">​</a></h3>
<ul>
<li class=""><a href="https://www.youtube.com/watch?v=I6tIi5CJcrU" target="_blank" rel="noopener noreferrer" class="">Watch the talk on YouTube</a></li>
<li class=""><a class="" href="https://docs-staging.fused.io/pr/1353/guide/h3-analytics/resolution-guide/">H3 Resolution Guide</a></li>
<li class=""><a class="" href="https://docs-staging.fused.io/pr/1353/guide/h3-analytics/joining/">Joining H3 datasets</a></li>
</ul>]]></content>
        <author>
            <name>Levente Juhász</name>
            <uri>https://www.linkedin.com/in/juhaszlevente/</uri>
        </author>
        <category label="h3" term="h3"/>
        <category label="h3 conference" term="h3 conference"/>
        <category label="dggs" term="dggs"/>
        <category label="geoai" term="geoai"/>
        <category label="research" term="research"/>
    </entry>
    <entry>
        <title type="html"><![CDATA[H3 in the Field]]></title>
        <id>https://docs-staging.fused.io/pr/1353/blog/h3-in-the-field/</id>
        <link href="https://docs-staging.fused.io/pr/1353/blog/h3-in-the-field/"/>
        <updated>2026-09-23T12:04:00.000Z</updated>
        <summary type="html"><![CDATA[Mo Fotouhi of John Deere explains how H3 puts soil, weather, satellite and field boundary data on one integer index, and where field-level agriculture needs finer cells and time-aware analysis than H3 provides.]]></summary>
        <content type="html"><![CDATA[<p><a href="https://www.deere.com/" target="_blank" rel="noopener noreferrer" class="">Mo Fotouhi</a> is a Senior Manager of Data Science at John Deere, where he leads teams working on geospatial intelligence and AI for agriculture. At the <a class="" href="https://docs-staging.fused.io/pr/1353/blog/h3-conference-2026/">H3 Conference 2026</a> in New York City he gave a lightning talk he described as a love letter to H3 with footnotes: H3 makes agricultural data easy to combine, but field-level questions need finer detail and a sense of time that H3 does not provide on its own.</p>
<!-- -->
<iframe style="width:100%;max-width:800px;aspect-ratio:16/9;height:auto;margin:0 auto 2rem auto;display:block" src="https://www.youtube.com/embed/7MD6zMm8Lzs" title="H3 in the Field" frameborder="0" allow="accelerometer; autoplay; clipboard-write; encrypted-media; gyroscope; picture-in-picture; web-share" referrerpolicy="strict-origin-when-cross-origin" allowfullscreen=""></iframe>
<h3 class="anchor anchorTargetStickyNavbar_Vzrq" id="one-integer-for-every-layer">One integer for every layer<a href="https://docs-staging.fused.io/pr/1353/blog/h3-in-the-field/#one-integer-for-every-layer" class="hash-link" aria-label="Direct link to One integer for every layer" title="Direct link to One integer for every layer" translate="no">​</a></h3>
<p>Mo started with the kind of question a client asks: which parts of this region gained or lost productive ground over the last 10 years? Answering it takes far more than a single yield map. The team needs:</p>
<ul>
<li class="">soil properties for the region</li>
<li class="">weather conditions over the past 10 years</li>
<li class="">satellite data such as NDVI and crop growth stages</li>
<li class="">field roughness, elevation and terrain</li>
<li class="">the exact boundary of the area of interest</li>
</ul>
<p>Each arrives in a different shape: point data from weather stations, soil polygons of arbitrary sizes and shapes, satellite rasters with sometimes 12 or more bands, elevation rasters or contours, and boundary polygons supplied by the customer. Mo called fusing all of that before H3 "a mess".</p>
<p>With H3, every layer shares one base with a single integer as the index. The layers still mean different things, but they can be added together and correlated, and the analysis starts to look like a linear math problem.</p>
<h3 class="anchor anchorTargetStickyNavbar_Vzrq" id="rasters-become-tables">Rasters become tables<a href="https://docs-staging.fused.io/pr/1353/blog/h3-in-the-field/#rasters-become-tables" class="hash-link" aria-label="Direct link to Rasters become tables" title="Direct link to Rasters become tables" translate="no">​</a></h3>
<p>His team also uses H3 a lot to convert rasters into tables. Rasters, which include satellite data, are harder to work with: fewer people are used to them, they take more time, and there are fewer tools for them. Converted to H3 cells at a suitable resolution, a raster becomes a table that can be joined, partitioned and used to train models, which brings the work closer to a familiar engineering problem.</p>
<h3 class="anchor anchorTargetStickyNavbar_Vzrq" id="when-resolution-15-is-not-fine-enough">When resolution 15 is not fine enough<a href="https://docs-staging.fused.io/pr/1353/blog/h3-in-the-field/#when-resolution-15-is-not-fine-enough" class="hash-link" aria-label="Direct link to When resolution 15 is not fine enough" title="Direct link to When resolution 15 is not fine enough" translate="no">​</a></h3>
<p>The footnotes started with a harder question: which rows in this field are underperforming, and since when? Using a sample field (not customer or company data), Mo zoomed through the resolutions:</p>
<ul>
<li class="">At resolution 12, many crop rows fall inside one cell.</li>
<li class="">At resolution 13, four or five rows still fit in a cell.</li>
<li class="">At resolution 14, there are still three rows per cell.</li>
<li class="">At resolution 15, the finest the standard library offers because of its 64-bit index, a couple of rows still share a cell.</li>
</ul>
<p>Even at resolution 15 an analysis can miss the spacing between plants, a weed patch inside a cell, or the distance between rows. The options are to aggregate and accept the loss of accuracy, or to extend H3. Mo proposed defining local coordinates inside a cell for anything finer than resolution 15.</p>
<h3 class="anchor anchorTargetStickyNavbar_Vzrq" id="time-and-hierarchy">Time and hierarchy<a href="https://docs-staging.fused.io/pr/1353/blog/h3-in-the-field/#time-and-hierarchy" class="hash-link" aria-label="Direct link to Time and hierarchy" title="Direct link to Time and hierarchy" translate="no">​</a></h3>
<p>H3 standardizes space, but agriculture also needs a way to handle time. Mo showed the same field in April as bare soil after planting, in July under full canopy, and in October or November ready for harvest. A field in Brazil and one in Iowa get different amounts of sun and different growing degree days, so time is not linear for the crop and a plain time axis is not enough. Mo suggested bucketing time by growing degree days, so the time axis advances with the warmth that drives plant growth rather than with the calendar.</p>
<p>The last footnote was the hierarchy. H3 child cells do not roll up exactly to their parents, which matters for real legal boundaries: rolling a field's yield up from resolution 12 to resolution 8 can pull in part of a neighboring field's yield. Asked in the Q&amp;A how they handle it, Mo said finer resolutions raise compute cost and analysis time, and going back to polygons brings its own problems, so most of the time the team accepts a known error and records it.</p>
<h3 class="anchor anchorTargetStickyNavbar_Vzrq" id="learn-more">Learn more<a href="https://docs-staging.fused.io/pr/1353/blog/h3-in-the-field/#learn-more" class="hash-link" aria-label="Direct link to Learn more" title="Direct link to Learn more" translate="no">​</a></h3>
<ul>
<li class=""><a href="https://www.youtube.com/watch?v=7MD6zMm8Lzs" target="_blank" rel="noopener noreferrer" class="">Watch the talk on YouTube</a></li>
<li class=""><a class="" href="https://docs-staging.fused.io/pr/1353/guide/h3-analytics/raster-ingestion/">Raster Ingestion Pipeline</a>: turn rasters into H3 tables in Fused</li>
<li class=""><a class="" href="https://docs-staging.fused.io/pr/1353/guide/h3-analytics/resolution-guide/">Resolution Guide</a>: choose an H3 resolution for your question</li>
</ul>]]></content>
        <author>
            <name>Mo Fotouhi</name>
            <uri>https://www.linkedin.com/in/mkfotouhi/</uri>
        </author>
        <category label="h3" term="h3"/>
        <category label="h3 conference" term="h3 conference"/>
        <category label="agriculture" term="agriculture"/>
        <category label="remote sensing" term="remote sensing"/>
        <category label="raster" term="raster"/>
    </entry>
    <entry>
        <title type="html"><![CDATA[Indexing Energy-Intensive Infrastructure with H3]]></title>
        <id>https://docs-staging.fused.io/pr/1353/blog/indexing-energy-infrastructure-with-h3/</id>
        <link href="https://docs-staging.fused.io/pr/1353/blog/indexing-energy-infrastructure-with-h3/"/>
        <updated>2026-09-23T12:03:00.000Z</updated>
        <summary type="html"><![CDATA[Robert Murphy shows how Othersphere tiles infrastructure, market and environmental data onto H3 level 8 cells to search the world for sites for data centers and other energy-intensive assets.]]></summary>
        <content type="html"><![CDATA[<p><a href="https://othersphere.io/" target="_blank" rel="noopener noreferrer" class="">Robert Murphy</a> is CEO of Othersphere, a spatial economics platform spun out of Bill Gates' Breakthrough Energy that helps decide where energy-intensive infrastructure should be built. At the <a class="" href="https://docs-staging.fused.io/pr/1353/blog/h3-conference-2026/">H3 Conference 2026</a> in New York City he showed how Othersphere tiles the world with H3 so developers and financial firms can screen everywhere for good sites before digging into the details.</p>
<!-- -->
<iframe style="width:100%;max-width:800px;aspect-ratio:16/9;height:auto;margin:0 auto 2rem auto;display:block" src="https://www.youtube.com/embed/dZBAHlmXdWE" title="Indexing Energy-Intensive Infrastructure with H3" frameborder="0" allow="accelerometer; autoplay; clipboard-write; encrypted-media; gyroscope; picture-in-picture; web-share" referrerpolicy="strict-origin-when-cross-origin" allowfullscreen=""></iframe>
<h3 class="anchor anchorTargetStickyNavbar_Vzrq" id="tiling-the-world-at-level-8">Tiling the world at level 8<a href="https://docs-staging.fused.io/pr/1353/blog/indexing-energy-infrastructure-with-h3/#tiling-the-world-at-level-8" class="hash-link" aria-label="Direct link to Tiling the world at level 8" title="Direct link to Tiling the world at level 8" translate="no">​</a></h3>
<p>Years ago, while working in oil and gas at Chevron, Robert went to a talk on H3 tiles that he called part of the formative thinking behind Othersphere. The company focuses on siting the energy-intensive infrastructure the world needs, such as data centers, renewable plants and refineries, so it gets built as efficiently and sustainably as possible.</p>
<p>Othersphere assigns every kind of data relevant to infrastructure development to H3 tiles, primarily at level 8:</p>
<ul>
<li class=""><strong>Geospatial data</strong>: where pipelines and power lines are, population density</li>
<li class=""><strong>Time series data</strong>: grid carbon intensity, power prices</li>
<li class=""><strong>Derived data</strong>: average power price, range of temperatures for the tile</li>
</ul>
<p>The aim is a holistic view of a good project: infrastructure and market fundamentals, but also human and environmental variables. Robert described it as pixelating the world to optimize where infrastructure gets deployed.</p>
<h3 class="anchor anchorTargetStickyNavbar_Vzrq" id="searching-the-world-with-explorer">Searching the world with Explorer<a href="https://docs-staging.fused.io/pr/1353/blog/indexing-energy-infrastructure-with-h3/#searching-the-world-with-explorer" class="hash-link" aria-label="Direct link to Searching the world with Explorer" title="Direct link to Searching the world with Explorer" translate="no">​</a></h3>
<p>Robert splits the work into two layers, global search and location diligence, and H3 does most of its work in the first. Working at level 8 gives up some spatial detail, which is brought back once the search narrows to a specific location.</p>
<p>In a live demo of Explorer, Othersphere's paid tool, he searched for data center sites: tiles with a high enough data center score that are also within a kilometer of a natural gas transmission pipeline. The matches first appear as level 4 tiles, which open up into the individual tiles that meet both criteria. Stacking filters like this across many variables narrows the whole world down to candidate sites, and dropping into any location shows the underlying data live. Robert put this at roughly the 5,000-foot view.</p>
<h3 class="anchor anchorTargetStickyNavbar_Vzrq" id="from-tile-to-site-with-generative-ai">From tile to site with generative AI<a href="https://docs-staging.fused.io/pr/1353/blog/indexing-energy-infrastructure-with-h3/#from-tile-to-site-with-generative-ai" class="hash-link" aria-label="Direct link to From tile to site with generative AI" title="Direct link to From tile to site with generative AI" translate="no">​</a></h3>
<p>Below that, the work has to move from tiles to the polygon level. Once a level 8 tile looks promising, for example close to power lines with relatively low grid carbon intensity, Othersphere combines the H3 data, the original source data and generative AI into in-depth diligence reports. The H3 data acts as guardrails while the AI digs into community sentiment, local permitting realities and other less quantitative factors that decide whether a project can be built there.</p>
<h3 class="anchor anchorTargetStickyNavbar_Vzrq" id="scout-a-public-view-of-the-tiles">Scout, a public view of the tiles<a href="https://docs-staging.fused.io/pr/1353/blog/indexing-energy-infrastructure-with-h3/#scout-a-public-view-of-the-tiles" class="hash-link" aria-label="Direct link to Scout, a public view of the tiles" title="Direct link to Scout, a public view of the tiles" translate="no">​</a></h3>
<p>Othersphere recently released <a href="https://scout.othersphere.io/" target="_blank" rel="noopener noreferrer" class="">Scout</a>, a free public tool that runs on H3 under the hood. Robert searched for the address of a site in Texas that he identified as one of OpenAI's Stargate data center facilities. Scout showed the level 8 tile there, a short LLM-generated summary, and the variables behind the data center score, including:</p>
<ul>
<li class="">grid power prices and natural gas power prices</li>
<li class="">grid carbon intensity</li>
<li class="">IEA data on country-level methane emissions intensity from natural gas infrastructure</li>
<li class="">local buildability, such as whether people live nearby and whether the area is water stressed</li>
</ul>
<p>The trade-off of tile-level search is precision. Distance from power lines, for example, is measured from the tile centroid, so it can be off by a couple of hundred meters, and a bankable assessment still needs the detailed work. But for someone combing the world for where to build, or checking a site that a solar or data center developer has approached them about, the H3 search saves months of work up front.</p>
<h3 class="anchor anchorTargetStickyNavbar_Vzrq" id="learn-more">Learn more<a href="https://docs-staging.fused.io/pr/1353/blog/indexing-energy-infrastructure-with-h3/#learn-more" class="hash-link" aria-label="Direct link to Learn more" title="Direct link to Learn more" translate="no">​</a></h3>
<ul>
<li class=""><a href="https://www.youtube.com/watch?v=dZBAHlmXdWE" target="_blank" rel="noopener noreferrer" class="">Watch the talk on YouTube</a></li>
<li class=""><a class="" href="https://docs-staging.fused.io/pr/1353/guide/h3-analytics/h3-large-datasets/">Ingest, Index &amp; Query H3 Datasets</a>: build your own H3-indexed datasets in Fused</li>
<li class=""><a class="" href="https://docs-staging.fused.io/pr/1353/guide/h3-analytics/joining/">Joining</a>: combine many layers on shared H3 cells</li>
</ul>]]></content>
        <author>
            <name>Robert Murphy</name>
            <uri>https://www.linkedin.com/in/rjmurphy/</uri>
        </author>
        <category label="h3" term="h3"/>
        <category label="h3 conference" term="h3 conference"/>
        <category label="energy" term="energy"/>
        <category label="infrastructure" term="infrastructure"/>
        <category label="site selection" term="site selection"/>
    </entry>
    <entry>
        <title type="html"><![CDATA[One Grid for Outdoors and Indoors]]></title>
        <id>https://docs-staging.fused.io/pr/1353/blog/one-grid-for-outdoors-and-indoors/</id>
        <link href="https://docs-staging.fused.io/pr/1353/blog/one-grid-for-outdoors-and-indoors/"/>
        <updated>2026-09-23T12:02:00.000Z</updated>
        <summary type="html"><![CDATA[Sean Gorman of Zephr shows how one H3 index, at resolution 5 for GNSS corrections and resolution 13 for visual map tiles, lets a single on-device solver track a phone from outdoors to indoors and back.]]></summary>
        <content type="html"><![CDATA[<p><a href="https://zephr.xyz/" target="_blank" rel="noopener noreferrer" class="">Sean Gorman</a> is a co-founder of Zephr, a positioning and navigation AI company. In a talk pre-recorded and played at the <a class="" href="https://docs-staging.fused.io/pr/1353/blog/h3-conference-2026/">H3 Conference 2026</a> in New York City, he showed how Zephr uses one H3 index, at two resolutions, to organize both GNSS corrections and indoor visual map tiles for a single positioning engine.</p>
<!-- -->
<iframe style="width:100%;max-width:800px;aspect-ratio:16/9;height:auto;margin:0 auto 2rem auto;display:block" src="https://www.youtube.com/embed/7yKyeZv3tvs" title="One Grid for Outdoors and Indoors" frameborder="0" allow="accelerometer; autoplay; clipboard-write; encrypted-media; gyroscope; picture-in-picture; web-share" referrerpolicy="strict-origin-when-cross-origin" allowfullscreen=""></iframe>
<h3 class="anchor anchorTargetStickyNavbar_Vzrq" id="one-solver-instead-of-a-handoff">One solver instead of a handoff<a href="https://docs-staging.fused.io/pr/1353/blog/one-grid-for-outdoors-and-indoors/#one-solver-instead-of-a-handoff" class="hash-link" aria-label="Direct link to One solver instead of a handoff" title="Direct link to One solver instead of a handoff" translate="no">​</a></h3>
<p>Satellite positioning stops at the door. Indoors, GNSS signals are blocked or bounced, so the blue dot drifts, jumps or freezes. The usual fix is a separate indoor positioning system with a handoff at the entrance, which is often where the position jumps.</p>
<p>A phone's positioning solver normally sits in the chip's firmware as a black box. Zephr's engine, Zephyrus, takes the raw measurements off the chip and solves for position in C++ on the device. That makes room for survey-grade corrections and better ionospheric, clock and ephemeris models, and it lets other sensors feed the same PVT filter: camera motion from visual inertial odometry and visual fixes from a visual positioning system. As GNSS starts to fail, the solver leans on the other signals without switching systems.</p>
<p>Two services feed it. Zellige builds indoor map tiles (visual positioning feature databases) from photogrammetry, lidar and other surveys. Zap is the positioning server that pushes GNSS corrections and visual fixes to the phone.</p>
<h3 class="anchor anchorTargetStickyNavbar_Vzrq" id="two-resolutions-of-the-same-index">Two resolutions of the same index<a href="https://docs-staging.fused.io/pr/1353/blog/one-grid-for-outdoors-and-indoors/#two-resolutions-of-the-same-index" class="hash-link" aria-label="Direct link to Two resolutions of the same index" title="Direct link to Two resolutions of the same index" translate="no">​</a></h3>
<p>H3 serves both halves of the system:</p>
<ul>
<li class=""><strong>Resolution 5 (about 10 km edge) for GNSS corrections.</strong> A correction is good for about 10 km before its accuracy starts to degrade.</li>
<li class=""><strong>Resolution 13 (about 4 m edge) for visual map tiles.</strong> Feature databases need to sit close to the camera.</li>
</ul>
<p>Because both come from one index, 5,764,801 resolution 13 cells nest under each resolution 5 cell.</p>
<h3 class="anchor anchorTargetStickyNavbar_Vzrq" id="four-patterns-from-one-grid">Four patterns from one grid<a href="https://docs-staging.fused.io/pr/1353/blog/one-grid-for-outdoors-and-indoors/#four-patterns-from-one-grid" class="hash-link" aria-label="Direct link to Four patterns from one grid" title="Direct link to Four patterns from one grid" translate="no">​</a></h3>
<p><strong>The cell as channel.</strong> Outdoors, the phone's position maps to a resolution 5 cell, correction streams are keyed by cell, and corrections are built only for cells in use. Sean showed a real SSR correction for Denver with its cell ID.</p>
<p><strong>The cell as file.</strong> Indoors, a building survey is cut into map tiles, one per H3 cell, and the cell ID is the file name. Zap turns a phone's rough location into a cell ID, opens that file and matches the camera's features against it. There is no spatial database, only a file system.</p>
<p><strong>The cell as frame.</strong> Each tile stores its 3D points in meters East, North and Up from the cell center, as 32-bit floats. At Earth-centered scale a 32-bit float can only move in steps of about half a meter, while inside a cell it resolves hundredths of a millimeter. Zap solves in the local frame and replies in Earth-centered coordinates.</p>
<p><strong>Boundaries solved at build time.</strong> Zellige builds the tile for each survey image in its home cell, then uses <code>gridDisk</code> to check the neighbors one ring at a time. If the camera was within the overlap distance of a neighbor's boundary, the image is written into that tile too. Some data is stored twice, so Zap reads exactly one tile per request and never stitches tiles.</p>
<h3 class="anchor anchorTargetStickyNavbar_Vzrq" id="from-the-mall-to-the-curb">From the mall to the curb<a href="https://docs-staging.fused.io/pr/1353/blog/one-grid-for-outdoors-and-indoors/#from-the-mall-to-the-curb" class="hash-link" aria-label="Direct link to From the mall to the curb" title="Direct link to From the mall to the curb" translate="no">​</a></h3>
<p>In the first demo, a phone moves cell to cell through a mall, changes levels on an escalator and heads out the door, where the solver rolls over to GNSS as the camera runs out of key descriptors to match.</p>
<p>The second was Denver International Airport, where getting off the train usually means no GNSS at all, so the track starts in visual positioning. It guides the user past the baggage carousels using landmarks such as baggage carousel 16 and the large luggage racks, out under a large concrete deck that wrecks GPS signal, and across a crosswalk to the Uber pickup point, map matching to a predetermined path along the way. Plain GPS on the same walk caught a little signal in the atrium, died under the second floor, and came back at the very end, wrong at first and then too late.</p>
<h3 class="anchor anchorTargetStickyNavbar_Vzrq" id="learn-more">Learn more<a href="https://docs-staging.fused.io/pr/1353/blog/one-grid-for-outdoors-and-indoors/#learn-more" class="hash-link" aria-label="Direct link to Learn more" title="Direct link to Learn more" translate="no">​</a></h3>
<ul>
<li class=""><a href="https://www.youtube.com/watch?v=7yKyeZv3tvs" target="_blank" rel="noopener noreferrer" class="">Watch the talk on YouTube</a></li>
<li class=""><a class="" href="https://docs-staging.fused.io/pr/1353/guide/h3-analytics/resolution-guide/">Resolution Guide</a>: how H3 resolutions nest and how to pick one</li>
</ul>]]></content>
        <author>
            <name>Sean Gorman</name>
            <uri>https://www.linkedin.com/in/sean-gorman-93a79/</uri>
        </author>
        <category label="h3" term="h3"/>
        <category label="h3 conference" term="h3 conference"/>
        <category label="positioning" term="positioning"/>
        <category label="navigation" term="navigation"/>
        <category label="indoor mapping" term="indoor mapping"/>
    </entry>
    <entry>
        <title type="html"><![CDATA[The Foursquare H3 Hub]]></title>
        <id>https://docs-staging.fused.io/pr/1353/blog/foursquare-h3-hub/</id>
        <link href="https://docs-staging.fused.io/pr/1353/blog/foursquare-h3-hub/"/>
        <updated>2026-09-23T12:01:00.000Z</updated>
        <summary type="html"><![CDATA[Xun Li presents three free Foursquare tools built on H3: the H3 Hub catalog of 103 H3-indexed datasets, Foursquare Spatial Desktop, and the Foursquare Spatial Agent that turns a plain-language question into an analysis.]]></summary>
        <content type="html"><![CDATA[<p><a href="https://foursquare.com/" target="_blank" rel="noopener noreferrer" class="">Xun Li</a>, a Software Engineer at Foursquare who works on the Foursquare Spatial Agent and the Foursquare H3 Hub, presented three free tools Foursquare has built on H3. The key point: when every dataset already shares the same H3 cells, an AI agent can answer a spatial question from a single sentence, because it only has to choose and weight layers rather than solve geometry. The talk was pre-recorded and played at the <a class="" href="https://docs-staging.fused.io/pr/1353/blog/h3-conference-2026/">H3 Conference 2026</a> in New York City.</p>
<!-- -->
<iframe style="width:100%;max-width:800px;aspect-ratio:16/9;height:auto;margin:0 auto 2rem auto;display:block" src="https://www.youtube.com/embed/lbjugNWV0M0" title="The Foursquare H3 Hub" frameborder="0" allow="accelerometer; autoplay; clipboard-write; encrypted-media; gyroscope; picture-in-picture; web-share" referrerpolicy="strict-origin-when-cross-origin" allowfullscreen=""></iframe>
<h3 class="anchor anchorTargetStickyNavbar_Vzrq" id="the-h3-hub-103-datasets-you-query-in-place">The H3 Hub: 103 datasets you query in place<a href="https://docs-staging.fused.io/pr/1353/blog/foursquare-h3-hub/#the-h3-hub-103-datasets-you-query-in-place" class="hash-link" aria-label="Direct link to The H3 Hub: 103 datasets you query in place" title="Direct link to The H3 Hub: 103 datasets you query in place" translate="no">​</a></h3>
<p>The <a href="https://foursquare.com/products/h3hub/" target="_blank" rel="noopener noreferrer" class="">Foursquare H3 Hub</a> hosts 103 open datasets, all H3-indexed. Most are at resolution 8, and some are published natively at resolution 7. They span eight categories, from boundaries and demographics to environment and reachability, and all of them are free.</p>
<p>The Hub is an Apache Iceberg catalog, so you point DuckDB, Spark or PyIceberg at it and query the tables directly. As Xun put it: no downloads, no copies. The catalog is not only static snapshots. It also includes time series published annually, monthly and even weekly.</p>
<h3 class="anchor anchorTargetStickyNavbar_Vzrq" id="spatial-desktop-a-map-with-a-sql-engine-behind-it">Spatial Desktop: a map with a SQL engine behind it<a href="https://docs-staging.fused.io/pr/1353/blog/foursquare-h3-hub/#spatial-desktop-a-map-with-a-sql-engine-behind-it" class="hash-link" aria-label="Direct link to Spatial Desktop: a map with a SQL engine behind it" title="Direct link to Spatial Desktop: a map with a SQL engine behind it" translate="no">​</a></h3>
<p>Foursquare Spatial Desktop is a free, cross-platform app. It uses kepler.gl to render the map and DuckDB for compute on large datasets, so, as Xun noted, it is not just a viewer. You can run SQL against H3 Hub datasets or against your own data, and the app is optimized around the Hub's datasets.</p>
<h3 class="anchor anchorTargetStickyNavbar_Vzrq" id="an-agent-that-only-has-to-pick-layers">An agent that only has to pick layers<a href="https://docs-staging.fused.io/pr/1353/blog/foursquare-h3-hub/#an-agent-that-only-has-to-pick-layers" class="hash-link" aria-label="Direct link to An agent that only has to pick layers" title="Direct link to An agent that only has to pick layers" translate="no">​</a></h3>
<p>The Foursquare Spatial Agent is the piece Xun said the team is most excited about. You ask a question in plain text, and the agent:</p>
<ul>
<li class="">searches the H3 Hub for datasets that could answer it</li>
<li class="">tells you which ones it would pick and asks you to confirm</li>
<li class="">queries the data where it lives</li>
<li class="">filters to the boundary you mean</li>
<li class="">composes the layers into an answer</li>
</ul>
<p>Xun's explanation for why this works so well on H3 is that the geometry problem is already solved. Every layer is keyed on the same cells, so the agent only has to reason about which layers to use, which variables to pick and how to weight them. That, Xun said, is a much smaller problem. Foursquare is also bringing the same agent into the H3 Hub website, which was in staging at the time of the recording.</p>
<h3 class="anchor anchorTargetStickyNavbar_Vzrq" id="three-demos-from-a-single-sentence">Three demos from a single sentence<a href="https://docs-staging.fused.io/pr/1353/blog/foursquare-h3-hub/#three-demos-from-a-single-sentence" class="hash-link" aria-label="Direct link to Three demos from a single sentence" title="Direct link to Three demos from a single sentence" translate="no">​</a></h3>
<p><strong>Vineyard suitability in Italy.</strong> Xun asked the agent which areas of Italy have the best soil, climate and terrain for wineries. It proposed soil properties, climate normals, elevation and land cover. After Xun confirmed, it combined nine variables into a single suitability score, filtered the result to Italy's boundary and rolled it up, producing a map you can keep exploring. From there you can change the weights, drop land cover or add a dataset and rerun it in seconds.</p>
<p><strong>Nighttime lights in Ukraine, 2016 to 2024.</strong> Nine years of annual nighttime lights tell the story through the shape of the curve: it climbs through 2021, then drops by about 65% in 2022. Xun noted that this came from one query against one open dataset, a result Xun said could otherwise take months to assemble.</p>
<p><strong>Summer heat in Europe.</strong> The most topical demo took this summer's maximum temperature, joined it to population and counted how many people lived under those temperatures across 10 European countries. That analysis joins a weekly climate grid, a demographic grid and a boundary table, three tables all keyed on the same H3 cell.</p>
<h3 class="anchor anchorTargetStickyNavbar_Vzrq" id="learn-more">Learn more<a href="https://docs-staging.fused.io/pr/1353/blog/foursquare-h3-hub/#learn-more" class="hash-link" aria-label="Direct link to Learn more" title="Direct link to Learn more" translate="no">​</a></h3>
<ul>
<li class=""><a href="https://www.youtube.com/watch?v=lbjugNWV0M0" target="_blank" rel="noopener noreferrer" class="">Watch the talk on YouTube</a></li>
<li class=""><a class="" href="https://docs-staging.fused.io/pr/1353/guide/h3-analytics/h3-overview/">H3 Analytics Overview</a></li>
<li class=""><a class="" href="https://docs-staging.fused.io/pr/1353/guide/h3-analytics/joining/">Joining</a></li>
</ul>]]></content>
        <author>
            <name>Xun Li</name>
            <uri>https://www.linkedin.com/in/xun-li-794a5b18/</uri>
        </author>
        <category label="h3" term="h3"/>
        <category label="h3 conference" term="h3 conference"/>
        <category label="foursquare" term="foursquare"/>
        <category label="iceberg" term="iceberg"/>
        <category label="duckdb" term="duckdb"/>
        <category label="ai agents" term="ai agents"/>
    </entry>
    <entry>
        <title type="html"><![CDATA[Maps from the Newsroom to the Pen Plotter]]></title>
        <id>https://docs-staging.fused.io/pr/1353/blog/maps-from-newsroom-to-pen-plotter/</id>
        <link href="https://docs-staging.fused.io/pr/1353/blog/maps-from-newsroom-to-pen-plotter/"/>
        <updated>2026-09-23T12:00:00.000Z</updated>
        <summary type="html"><![CDATA[Tim Wallace of The New York Times tours maps made for the news and for fun, from building footprints and satellite imagery to grid-based pen plotter art.]]></summary>
        <content type="html"><![CDATA[<p>Tim Wallace, Senior Editor for Geography at The New York Times, toured maps made for the news and for fun, from newsroom projects built on building footprints and satellite imagery to grid-based art drawn by a pen plotter. In the Q&amp;A, Tim made the case that everything about a map, from its shape and tone to what gets labeled, shapes the reader's experience. The talk was presented at the <a class="" href="https://docs-staging.fused.io/pr/1353/blog/h3-conference-2026/">H3 Conference 2026</a> in New York City.</p>
<!-- -->
<iframe style="width:100%;max-width:800px;aspect-ratio:16/9;height:auto;margin:0 auto 2rem auto;display:block" src="https://www.youtube.com/embed/Z9sT5WRrJVk" title="Maps from the Newsroom to the Pen Plotter" frameborder="0" allow="accelerometer; autoplay; clipboard-write; encrypted-media; gyroscope; picture-in-picture; web-share" referrerpolicy="strict-origin-when-cross-origin" allowfullscreen=""></iframe>
<h3 class="anchor anchorTargetStickyNavbar_Vzrq" id="geography-across-the-newsroom">Geography across the newsroom<a href="https://docs-staging.fused.io/pr/1353/blog/maps-from-newsroom-to-pen-plotter/#geography-across-the-newsroom" class="hash-link" aria-label="Direct link to Geography across the newsroom" title="Direct link to Geography across the newsroom" translate="no">​</a></h3>
<p>Tim has been at the Times for most of the last 15 years, working mainly with the graphics desk but also with climate, visual investigations, investigations and business: essentially anyone in the newsroom who needs geography, GIS or cartography.</p>
<p>The talk opened with an older project that mapped the Microsoft building footprints, one of the first large buildings datasets. Mapping only that one part of the built environment revealed patterns visible from afar, like the long lots in Louisiana and different kinds of developments in Arizona. The result reads more or less like a population density map that also shows the built environment.</p>
<p>For a piece showing how cold and frozen much of the US was at the end of last winter, Tim used Fused to pan-sharpen satellite imagery, which, as far as Tim knows, is not terribly easy to do in Google Earth Engine.</p>
<p>Grids show up often in Tim's work, but H3 has not yet. One project Tim pointed to as a possible fit: years of work with colleague Marco Hernandez mapping the extent of damage in Ukraine with extruded grids, built on a dataset Tim described as the gold standard for conflict data derived from SAR.</p>
<h3 class="anchor anchorTargetStickyNavbar_Vzrq" id="maps-for-fun-swims-and-pen-plotters">Maps for fun: swims and pen plotters<a href="https://docs-staging.fused.io/pr/1353/blog/maps-from-newsroom-to-pen-plotter/#maps-for-fun-swims-and-pen-plotters" class="hash-link" aria-label="Direct link to Maps for fun: swims and pen plotters" title="Direct link to Maps for fun: swims and pen plotters" translate="no">​</a></h3>
<p>Tim is an open water swimmer and showed an experimental map of an event swum this summer, simulating the swarm of swimmers alongside the tides and currents.</p>
<p>A couple of years ago, Tim bought a pen plotter and caught the bug. Line work plots well, and so do grids:</p>
<ul>
<li class="">An extruded grid of the US with the Mississippi River system on top</li>
<li class="">The New York City Subway in an oblique view with exaggerated topography</li>
<li class="">What Tim calls the "Q*bert grid": nested rhombuses with different aggregations of population density, in pen on paper</li>
<li class="">Mount Desert Island in Maine as a single square grid</li>
<li class="">California generalized in four different ways</li>
<li class="">New Mexico as a nested grid, a plot that initially took 8 hours</li>
<li class="">US streets treated like string, and mountain peaks generalized into shapes Tim compared to upside-down Bugles snacks</li>
</ul>
<h3 class="anchor anchorTargetStickyNavbar_Vzrq" id="from-the-qa">From the Q&amp;A<a href="https://docs-staging.fused.io/pr/1353/blog/maps-from-newsroom-to-pen-plotter/#from-the-qa" class="hash-link" aria-label="Direct link to From the Q&amp;A" title="Direct link to From the Q&amp;A" translate="no">​</a></h3>
<ul>
<li class=""><strong>Maps shape perception.</strong> Everything about a map (its shape, look, tone and labels) shapes your experience. Tim argued that Google changed everyone's mental map starting around 2007 or 2008, and that news maps aim to read quickly on the one thing a story is about.</li>
<li class=""><strong>AI.</strong> The biggest change so far is internal tooling that produces maps faster and better than before. The cartography itself has not changed much yet, though Tim expects it will.</li>
</ul>
<h3 class="anchor anchorTargetStickyNavbar_Vzrq" id="learn-more">Learn more<a href="https://docs-staging.fused.io/pr/1353/blog/maps-from-newsroom-to-pen-plotter/#learn-more" class="hash-link" aria-label="Direct link to Learn more" title="Direct link to Learn more" translate="no">​</a></h3>
<ul>
<li class=""><a href="https://www.youtube.com/watch?v=Z9sT5WRrJVk" target="_blank" rel="noopener noreferrer" class="">Watch the talk on YouTube</a></li>
<li class=""><a class="" href="https://docs-staging.fused.io/pr/1353/guide/h3-analytics/visualization/">Visualization</a></li>
<li class=""><a class="" href="https://docs-staging.fused.io/pr/1353/guide/h3-analytics/aggregations/">Aggregations</a></li>
</ul>]]></content>
        <author>
            <name>Tim Wallace</name>
            <uri>https://www.linkedin.com/in/wallace-tim/</uri>
        </author>
        <category label="h3" term="h3"/>
        <category label="h3 conference" term="h3 conference"/>
        <category label="cartography" term="cartography"/>
        <category label="journalism" term="journalism"/>
        <category label="pen plotter" term="pen plotter"/>
    </entry>
    <entry>
        <title type="html"><![CDATA[The Modern Data Stack Is Dead. Who Killed It?]]></title>
        <id>https://docs-staging.fused.io/pr/1353/blog/modern-data-stack-is-dead/</id>
        <link href="https://docs-staging.fused.io/pr/1353/blog/modern-data-stack-is-dead/"/>
        <updated>2026-04-30T00:00:00.000Z</updated>
        <summary type="html"><![CDATA[TL;DR]]></summary>
        <content type="html"><![CDATA[<p><strong>TL;DR</strong>
The modern data stack (ETL + warehouses + orchestration tools) is breaking down.
AI can now write transformations and queries.
The new bottleneck is running that code safely, at scale.
Fused is a serverless execution layer for data and AI workflows.</p>
<div class="theme-admonition theme-admonition-tip admonition_xJq3 alert alert--success"><div class="admonitionHeading_Gvgb"><span class="admonitionIcon_Rf37"><svg viewBox="0 0 12 16"><path fill-rule="evenodd" d="M6.5 0C3.48 0 1 2.19 1 5c0 .92.55 2.25 1 3 1.34 2.25 1.78 2.78 2 4v1h5v-1c.22-1.22.66-1.75 2-4 .45-.75 1-2.08 1-3 0-2.81-2.48-5-5.5-5zm3.64 7.48c-.25.44-.47.8-.67 1.11-.86 1.41-1.25 2.06-1.45 3.23-.02.05-.02.11-.02.17H5c0-.06 0-.13-.02-.17-.2-1.17-.59-1.83-1.45-3.23-.2-.31-.42-.67-.67-1.11C2.44 6.78 2 5.65 2 5c0-2.2 2.02-4 4.5-4 1.22 0 2.36.42 3.22 1.19C10.55 2.94 11 3.94 11 5c0 .66-.44 1.78-.86 2.48zM4 14h5c-.23 1.14-1.3 2-2.5 2s-2.27-.86-2.5-2z"></path></svg></span>What is Fused?</div><div class="admonitionContent_BuS1"><p>Fused is a serverless execution layer for data and AI workflows. With Fused, teams can write simple Python functions and run them at scale—directly on their data—without having to manage any infrastructure.</p></div></div>
<p><em>We have a murder on our hands.</em></p>
<p><em>The victim? The modern data stack.
For years, data teams have relied on a patchwork of tools: ETL pipelines, warehouses, orchestration layers, and dashboards. Getting anything done often meant stitching together 5-6 different systems just to move and transform data.
Something changed.
The modern data stack wasn’t killed by one company or project. It was replaced by a shift across the entire ecosystem.
We've rounded up the suspects as to who may have been at the scene of the crime, and we're going to round them up one after the other.</em></p>
<!-- -->
<img src="https://docs-staging.fused.io/pr/1353/assets/images/header-afbbbd5cc851b0bd07020c56b074f8f3.jpg" alt="The modern data stack murder scene" style="width:75%;display:block;margin:0 auto">
<hr>
<h2 class="anchor anchorTargetStickyNavbar_Vzrq" id="suspect-a-ai-code-editors">Suspect A: AI Code Editors<a href="https://docs-staging.fused.io/pr/1353/blog/modern-data-stack-is-dead/#suspect-a-ai-code-editors" class="hash-link" aria-label="Direct link to Suspect A: AI Code Editors" title="Direct link to Suspect A: AI Code Editors" translate="no">​</a></h2>
<p>The most obvious suspect at this crime scene is AI.</p>
<img src="https://docs-staging.fused.io/pr/1353/assets/images/suspect-a-ai-b9ed6e4478d64cdbd8a705e567353867.jpg" alt="Suspect A: AI code editors" style="width:75%;display:block;margin:0 auto">
<p>Claude Code, OpenAI Codex, and Cursor are everywhere now and have radically transformed how data teams write and ship code. While AI hasn't fully replaced software engineers (yet), it has changed how we write code.</p>
<p>As an example, our Developer Advocate, Max, never took the time to learn SQL but has <a href="https://youtu.be/aL6EFbrYezk?si=78bUKG-tchDe0CSD" target="_blank" rel="noopener noreferrer" class="">seen a huge unlock in using AI models</a> to write more and more complex queries — without needing to memorize every piece of SQL syntax.</p>
<p>Our own Fused docs have shifted from being written purely for human developers to being written for human <em>and</em> AI developers, with things like simple <a href="https://docs.fused.io/llms.txt" target="_blank" rel="noopener noreferrer" class=""><code>llms.txt</code> files</a> that let AI models easily parse documentation and make sense of it.</p>
<p>It would however be all too simple to pin this crime on the AI scapegoat. The inspection is probably worth continuing a little further.</p>
<hr>
<h2 class="anchor anchorTargetStickyNavbar_Vzrq" id="suspect-b-s3--parquet">Suspect B: S3 + Parquet<a href="https://docs-staging.fused.io/pr/1353/blog/modern-data-stack-is-dead/#suspect-b-s3--parquet" class="hash-link" aria-label="Direct link to Suspect B: S3 + Parquet" title="Direct link to Suspect B: S3 + Parquet" translate="no">​</a></h2>
<p>Our next suspect is actually two working in tandem.</p>
<img src="https://docs-staging.fused.io/pr/1353/assets/images/suspect-b-s3-parquet-142c61b73b9131f4ca48dc5fa8bdb66c.jpg" alt="Suspect B: S3 + Parquet" style="width:75%;display:block;margin:0 auto">
<p>File formats like Parquet allow large, partitioned files that store massive amounts of data directly on cloud storage — no complex database systems required. Parquet files are fast to read and write, and they're portable: openable anywhere, downloadable to disk, and compatible with everything from <code>pandas</code> in Python to DuckDB natively. They really shine when paired with cloud storage, since most modern libraries can read and write to the cloud directly:</p>
<div class="language-python codeBlockContainer_Ckt0 theme-code-block" style="--prism-background-color:hsl(220, 13%, 18%);--prism-color:hsl(220, 14%, 71%)"><div class="codeBlockContent_QJqH"><pre tabindex="0" class="prism-code language-python codeBlock_bY9V thin-scrollbar" style="background-color:hsl(220, 13%, 18%);color:hsl(220, 14%, 71%);text-shadow:0 1px rgba(0, 0, 0, 0.3)"><code class="codeBlockLines_e6Vv"><span class="token-line" style="color:hsl(220, 14%, 71%);text-shadow:0 1px rgba(0, 0, 0, 0.3)"><span class="token keyword" style="color:hsl(286, 60%, 67%)">import</span><span class="token plain"> pandas </span><span class="token keyword" style="color:hsl(286, 60%, 67%)">as</span><span class="token plain"> pd</span><br></span><span class="token-line" style="color:hsl(220, 14%, 71%);text-shadow:0 1px rgba(0, 0, 0, 0.3)"><span class="token plain" style="display:inline-block"></span><br></span><span class="token-line" style="color:hsl(220, 14%, 71%);text-shadow:0 1px rgba(0, 0, 0, 0.3)"><span class="token plain"></span><span class="token comment" style="color:hsl(220, 10%, 40%)"># Read from cloud</span><span class="token plain"></span><br></span><span class="token-line" style="color:hsl(220, 14%, 71%);text-shadow:0 1px rgba(0, 0, 0, 0.3)"><span class="token plain">df </span><span class="token operator" style="color:hsl(207, 82%, 66%)">=</span><span class="token plain"> pd</span><span class="token punctuation" style="color:hsl(220, 14%, 71%)">.</span><span class="token plain">read_parquet</span><span class="token punctuation" style="color:hsl(220, 14%, 71%)">(</span><span class="token string" style="color:hsl(95, 38%, 62%)">"s3://bucket/file.parquet"</span><span class="token punctuation" style="color:hsl(220, 14%, 71%)">)</span><span class="token plain"></span><br></span><span class="token-line" style="color:hsl(220, 14%, 71%);text-shadow:0 1px rgba(0, 0, 0, 0.3)"><span class="token plain" style="display:inline-block"></span><br></span><span class="token-line" style="color:hsl(220, 14%, 71%);text-shadow:0 1px rgba(0, 0, 0, 0.3)"><span class="token plain"></span><span class="token comment" style="color:hsl(220, 10%, 40%)"># Transform</span><span class="token plain"></span><br></span><span class="token-line" style="color:hsl(220, 14%, 71%);text-shadow:0 1px rgba(0, 0, 0, 0.3)"><span class="token plain">df </span><span class="token operator" style="color:hsl(207, 82%, 66%)">=</span><span class="token plain"> </span><span class="token punctuation" style="color:hsl(220, 14%, 71%)">.</span><span class="token punctuation" style="color:hsl(220, 14%, 71%)">.</span><span class="token punctuation" style="color:hsl(220, 14%, 71%)">.</span><span class="token plain"></span><br></span><span class="token-line" style="color:hsl(220, 14%, 71%);text-shadow:0 1px rgba(0, 0, 0, 0.3)"><span class="token plain" style="display:inline-block"></span><br></span><span class="token-line" style="color:hsl(220, 14%, 71%);text-shadow:0 1px rgba(0, 0, 0, 0.3)"><span class="token plain"></span><span class="token comment" style="color:hsl(220, 10%, 40%)"># Save</span><span class="token plain"></span><br></span><span class="token-line" style="color:hsl(220, 14%, 71%);text-shadow:0 1px rgba(0, 0, 0, 0.3)"><span class="token plain">df</span><span class="token punctuation" style="color:hsl(220, 14%, 71%)">.</span><span class="token plain">to_parquet</span><span class="token punctuation" style="color:hsl(220, 14%, 71%)">(</span><span class="token string" style="color:hsl(95, 38%, 62%)">"s3://bucket/processed_file.parquet"</span><span class="token punctuation" style="color:hsl(220, 14%, 71%)">)</span><br></span></code></pre></div></div>
<p>Data management doesn't simply go away — it still requires clever sorting and partitioning so files are efficient to find and read. But all of that is now possible directly in Parquet files stored on a cloud bucket.</p>
<img src="https://docs-staging.fused.io/pr/1353/assets/images/suspect-b-crop-layer-e9be953e0f32e25208e0e842a062d055.jpg" alt="USDA Crop Data Layer in H3 hexagons on S3" style="width:75%;display:block;margin:0 auto">
<p><em>Example of the USDA's Crop Data Layer dataset converted to H3 hexagons for partitioning, stored in Parquet files directly on S3. Each file covers a specific area of interest and each Parquet file is partitioned to access only a specific row group of data.</em></p>
<p>This leads us naturally to the next suspect: query engines that make it trivially easy to read from a whole directory of Parquet files.</p>
<hr>
<h2 class="anchor anchorTargetStickyNavbar_Vzrq" id="suspect-c-duckdb">Suspect C: DuckDB<a href="https://docs-staging.fused.io/pr/1353/blog/modern-data-stack-is-dead/#suspect-c-duckdb" class="hash-link" aria-label="Direct link to Suspect C: DuckDB" title="Direct link to Suspect C: DuckDB" translate="no">​</a></h2>
<p>DuckDB is a top-tier suspect — close to the victim, practically family. A relative of the modern data stack that may have committed the crime on its own kin.</p>
<img src="https://docs-staging.fused.io/pr/1353/assets/images/suspect-c-duckdb-334fa29ec6a708c3e14bfd6a157e8549.jpg" alt="Suspect C: DuckDB" style="width:75%;display:block;margin:0 auto">
<p>DuckDB is an open-source, in-process analytical database management system. Beyond the technical jargon: it lets you write SQL without needing a dedicated server to manage, and it runs incredibly fast on columnar data. It also queries a directory of Parquet files hosted on an S3 bucket directly, treating them like a database.</p>
<div class="language-sql codeBlockContainer_Ckt0 theme-code-block" style="--prism-background-color:hsl(220, 13%, 18%);--prism-color:hsl(220, 14%, 71%)"><div class="codeBlockContent_QJqH"><pre tabindex="0" class="prism-code language-sql codeBlock_bY9V thin-scrollbar" style="background-color:hsl(220, 13%, 18%);color:hsl(220, 14%, 71%);text-shadow:0 1px rgba(0, 0, 0, 0.3)"><code class="codeBlockLines_e6Vv"><span class="token-line" style="color:hsl(220, 14%, 71%);text-shadow:0 1px rgba(0, 0, 0, 0.3)"><span class="token comment" style="color:hsl(220, 10%, 40%)">-- Searching for a specific ID across 50GB of parquet files on S3 is a single query now</span><span class="token plain"></span><br></span><span class="token-line" style="color:hsl(220, 14%, 71%);text-shadow:0 1px rgba(0, 0, 0, 0.3)"><span class="token plain"></span><span class="token keyword" style="color:hsl(286, 60%, 67%)">SELECT</span><span class="token plain"> </span><span class="token operator" style="color:hsl(207, 82%, 66%)">*</span><span class="token plain"></span><br></span><span class="token-line" style="color:hsl(220, 14%, 71%);text-shadow:0 1px rgba(0, 0, 0, 0.3)"><span class="token plain"></span><span class="token keyword" style="color:hsl(286, 60%, 67%)">FROM</span><span class="token plain"> read_parquet</span><span class="token punctuation" style="color:hsl(220, 14%, 71%)">(</span><span class="token string" style="color:hsl(95, 38%, 62%)">'s3://overturemaps-us-west-2/registry/*.parquet'</span><span class="token punctuation" style="color:hsl(220, 14%, 71%)">)</span><span class="token plain"></span><br></span><span class="token-line" style="color:hsl(220, 14%, 71%);text-shadow:0 1px rgba(0, 0, 0, 0.3)"><span class="token plain"></span><span class="token keyword" style="color:hsl(286, 60%, 67%)">WHERE</span><span class="token plain"> id </span><span class="token operator" style="color:hsl(207, 82%, 66%)">=</span><span class="token plain"> </span><span class="token string" style="color:hsl(95, 38%, 62%)">'fea28f69-7afa-460c-b270-61ef74cd340c'</span><span class="token punctuation" style="color:hsl(220, 14%, 71%)">;</span><br></span></code></pre></div></div>
<p>This lets you take a simple query, run it from a laptop, and scale it to huge amounts of data on S3. Engines like DuckDB are optimized for analytics and benefit from Parquet's partitioning, which can skip entire files and row groups.</p>
<p>Large queries that would blow up in a regular <code>pandas</code> run are now possible in-memory with minimal setup:</p>
<div class="language-sql codeBlockContainer_Ckt0 theme-code-block" style="--prism-background-color:hsl(220, 13%, 18%);--prism-color:hsl(220, 14%, 71%)"><div class="codeBlockContent_QJqH"><pre tabindex="0" class="prism-code language-sql codeBlock_bY9V thin-scrollbar" style="background-color:hsl(220, 13%, 18%);color:hsl(220, 14%, 71%);text-shadow:0 1px rgba(0, 0, 0, 0.3)"><code class="codeBlockLines_e6Vv"><span class="token-line" style="color:hsl(220, 14%, 71%);text-shadow:0 1px rgba(0, 0, 0, 0.3)"><span class="token keyword" style="color:hsl(286, 60%, 67%)">SELECT</span><span class="token plain"></span><br></span><span class="token-line" style="color:hsl(220, 14%, 71%);text-shadow:0 1px rgba(0, 0, 0, 0.3)"><span class="token plain">  user_id</span><span class="token punctuation" style="color:hsl(220, 14%, 71%)">,</span><span class="token plain"></span><br></span><span class="token-line" style="color:hsl(220, 14%, 71%);text-shadow:0 1px rgba(0, 0, 0, 0.3)"><span class="token plain">  </span><span class="token function" style="color:hsl(207, 82%, 66%)">count</span><span class="token punctuation" style="color:hsl(220, 14%, 71%)">(</span><span class="token operator" style="color:hsl(207, 82%, 66%)">*</span><span class="token punctuation" style="color:hsl(220, 14%, 71%)">)</span><span class="token plain"> </span><span class="token keyword" style="color:hsl(286, 60%, 67%)">AS</span><span class="token plain"> event_count</span><span class="token punctuation" style="color:hsl(220, 14%, 71%)">,</span><span class="token plain"></span><br></span><span class="token-line" style="color:hsl(220, 14%, 71%);text-shadow:0 1px rgba(0, 0, 0, 0.3)"><span class="token plain">  approx_quantile</span><span class="token punctuation" style="color:hsl(220, 14%, 71%)">(</span><span class="token plain">duration_ms</span><span class="token punctuation" style="color:hsl(220, 14%, 71%)">,</span><span class="token plain"> </span><span class="token number" style="color:hsl(29, 54%, 61%)">0.95</span><span class="token punctuation" style="color:hsl(220, 14%, 71%)">)</span><span class="token plain"> </span><span class="token keyword" style="color:hsl(286, 60%, 67%)">AS</span><span class="token plain"> p95</span><br></span><span class="token-line" style="color:hsl(220, 14%, 71%);text-shadow:0 1px rgba(0, 0, 0, 0.3)"><span class="token plain"></span><span class="token keyword" style="color:hsl(286, 60%, 67%)">FROM</span><span class="token plain"> read_parquet</span><span class="token punctuation" style="color:hsl(220, 14%, 71%)">(</span><span class="token string" style="color:hsl(95, 38%, 62%)">'s3://bucket/events/*.parquet'</span><span class="token punctuation" style="color:hsl(220, 14%, 71%)">)</span><span class="token plain"></span><br></span><span class="token-line" style="color:hsl(220, 14%, 71%);text-shadow:0 1px rgba(0, 0, 0, 0.3)"><span class="token plain"></span><span class="token keyword" style="color:hsl(286, 60%, 67%)">GROUP</span><span class="token plain"> </span><span class="token keyword" style="color:hsl(286, 60%, 67%)">BY</span><span class="token plain"> user_id</span><span class="token punctuation" style="color:hsl(220, 14%, 71%)">;</span><br></span></code></pre></div></div>
<p>DuckDB is our main example here, but the pattern is bigger. Other engines like Polars reflect the same shift: open formats on object storage plus a query runtime that can move to the data. At the time of writing, the two libraries are neck and neck and DuckDB is gaining steam over Polars.</p>
<img src="https://docs-staging.fused.io/pr/1353/assets/images/suspect-c-duckdb-polars-27964dee161eac7f3e1970e7ec44cab7.jpg" alt="DuckDB vs Polars momentum" style="width:75%;display:block;margin:0 auto">
<p>DuckDB makes even more sense in a world where LLMs have gotten incredible at writing even complex SQL queries, lowering the bar to entry dramatically. That makes DuckDB a prime suspect in our case.</p>
<hr>
<h2 class="anchor anchorTargetStickyNavbar_Vzrq" id="suspect-d-serverless">Suspect D: Serverless<a href="https://docs-staging.fused.io/pr/1353/blog/modern-data-stack-is-dead/#suspect-d-serverless" class="hash-link" aria-label="Direct link to Suspect D: Serverless" title="Direct link to Suspect D: Serverless" translate="no">​</a></h2>
<img src="https://docs-staging.fused.io/pr/1353/assets/images/suspect-d-serverless-676f7ba126c2416888a8a65350f628a3.jpg" alt="Suspect D: Serverless compute" style="width:75%;display:block;margin:0 auto">
<p>Doing anything with data used to require a fleet of big servers. Code couldn't run without access to data, and that access lived on the servers. The servers had to be big because Spark jobs run out of memory and crash. Anyone who's tried to debug a crashing data processing job knows the feeling of hunting through logs looking for suspects and clues.</p>
<p>That brings us to our fourth suspect: serverless, elastic compute. Serverless removes layers of orchestration from the user's way, making it easier to scale processing on demand, simplifying and speeding up iteration cycles.</p>
<p>Serverless also plays well with all the other suspects: access to cloud storage is native and natural; DuckDB starts quickly, avoiding the cold-start tradeoff.</p>
<hr>
<h2 class="anchor anchorTargetStickyNavbar_Vzrq" id="the-verdict">The Verdict<a href="https://docs-staging.fused.io/pr/1353/blog/modern-data-stack-is-dead/#the-verdict" class="hash-link" aria-label="Direct link to The Verdict" title="Direct link to The Verdict" translate="no">​</a></h2>
<p>The modern data stack wasn't killed by one thing. <strong>It was killed by a shift across the whole stack:</strong></p>
<ul>
<li class="">Large datasets can now be managed directly in the cloud, no additional management systems required.</li>
<li class="">Analytical engines like DuckDB can query all of this data directly.</li>
<li class="">AI makes it cheap to write the glue code.</li>
</ul>
<p>The bottleneck moved from <em>"writing transformations"</em> to <em>"running code safely, at scale, with credentials, reproducibility, and a stable interface."</em></p>
<hr>
<h2 class="anchor anchorTargetStickyNavbar_Vzrq" id="so-what-should-it-look-like-instead">So What Should It Look Like Instead?<a href="https://docs-staging.fused.io/pr/1353/blog/modern-data-stack-is-dead/#so-what-should-it-look-like-instead" class="hash-link" aria-label="Direct link to So What Should It Look Like Instead?" title="Direct link to So What Should It Look Like Instead?" translate="no">​</a></h2>
<p>Claude Code lets you build at the speed of your ideas. Teams can ship faster (we're seeing this at Fused), people who didn't have time to code anymore can now code again, and project backlogs are being filled.</p>
<p><strong>But Claude can't directly ship.</strong> It can help you write the code, but that's not enough. We see two paths forward:</p>
<h3 class="anchor anchorTargetStickyNavbar_Vzrq" id="approach-1-give-claude-code-more-and-more-access">Approach 1: Give Claude Code More and More Access<a href="https://docs-staging.fused.io/pr/1353/blog/modern-data-stack-is-dead/#approach-1-give-claude-code-more-and-more-access" class="hash-link" aria-label="Direct link to Approach 1: Give Claude Code More and More Access" title="Direct link to Approach 1: Give Claude Code More and More Access" translate="no">​</a></h3>
<p>Give it a credit card, a dedicated EC2, your database credentials. This is what we're seeing with fully autonomous AI models.</p>
<p>While this works nicely for a local solo project, it doesn't scale to enterprise customers that need tight security and proper scope. You can't manage access across a whole team with proper permissions this way.</p>
<h3 class="anchor anchorTargetStickyNavbar_Vzrq" id="approach-2-give-claude-code-easy-access-to-scoped-processing">Approach 2: Give Claude Code Easy Access to Scoped Processing<a href="https://docs-staging.fused.io/pr/1353/blog/modern-data-stack-is-dead/#approach-2-give-claude-code-easy-access-to-scoped-processing" class="hash-link" aria-label="Direct link to Approach 2: Give Claude Code Easy Access to Scoped Processing" title="Direct link to Approach 2: Give Claude Code Easy Access to Scoped Processing" translate="no">​</a></h3>
<p>Ideally this means giving your AI agent:</p>
<ul>
<li class=""><strong>Serverless compute</strong>: Spin up a node when you need it, scale on demand. The simpler to call, the better Claude can use it.</li>
<li class=""><strong>Sandboxed, secure access</strong>: Claude shouldn't be able to wreak havoc in your codebase or data. Projects should have clear permissions, and data access should be controlled (don't let data from customer A be exposed to customer B).</li>
</ul>
<p>The catch: now you need to manage an infra layer that scales up and down, handles auth, and manages permissions across teams. These are all things you want your AI agents to have access to — but probably not something you want to maintain yourself.</p>
<hr>
<h2 class="anchor anchorTargetStickyNavbar_Vzrq" id="our-answer-why-were-building-fused">Our Answer: Why We're Building Fused<a href="https://docs-staging.fused.io/pr/1353/blog/modern-data-stack-is-dead/#our-answer-why-were-building-fused" class="hash-link" aria-label="Direct link to Our Answer: Why We're Building Fused" title="Direct link to Our Answer: Why We're Building Fused" translate="no">​</a></h2>
<p>We've been building Fused for data teams that need to get work done and have customers who need answers no matter where their data comes from.</p>
<h3 class="anchor anchorTargetStickyNavbar_Vzrq" id="built-on-python">Built on Python<a href="https://docs-staging.fused.io/pr/1353/blog/modern-data-stack-is-dead/#built-on-python" class="hash-link" aria-label="Direct link to Built on Python" title="Direct link to Built on Python" translate="no">​</a></h3>
<p>Python is the language of data. Whether you're loading from S3, Snowflake, or Google Drive — or extracting from a PDF, scraping a website, or processing a one-time download — there's a way to do it in Python. It's the most versatile tool for working with any data, regardless of type, origin, or size.</p>
<p>We ship an opinionated and tested set of dependencies that covers most modern data use cases, so data scientists and engineers can start building in seconds, not hours.</p>
<h3 class="anchor anchorTargetStickyNavbar_Vzrq" id="scalable-serverless-engine">Scalable Serverless Engine<a href="https://docs-staging.fused.io/pr/1353/blog/modern-data-stack-is-dead/#scalable-serverless-engine" class="hash-link" aria-label="Direct link to Scalable Serverless Engine" title="Direct link to Scalable Serverless Engine" translate="no">​</a></h3>
<p>Python alone isn't enough. Scaling up compute on demand normally means building and deploying Docker containers. Fused lets you create User Defined Functions — simple, self-contained Python functions that run on our serverless compute infrastructure. All you need is a <code>@fused.udf</code> decorator:</p>
<div class="language-python codeBlockContainer_Ckt0 theme-code-block" style="--prism-background-color:hsl(220, 13%, 18%);--prism-color:hsl(220, 14%, 71%)"><div class="codeBlockContent_QJqH"><pre tabindex="0" class="prism-code language-python codeBlock_bY9V thin-scrollbar" style="background-color:hsl(220, 13%, 18%);color:hsl(220, 14%, 71%);text-shadow:0 1px rgba(0, 0, 0, 0.3)"><code class="codeBlockLines_e6Vv"><span class="token-line" style="color:hsl(220, 14%, 71%);text-shadow:0 1px rgba(0, 0, 0, 0.3)"><span class="token decorator annotation punctuation" style="color:hsl(220, 14%, 71%)">@fused</span><span class="token decorator annotation punctuation" style="color:hsl(220, 14%, 71%)">.</span><span class="token decorator annotation punctuation" style="color:hsl(220, 14%, 71%)">udf</span><span class="token plain"></span><br></span><span class="token-line" style="color:hsl(220, 14%, 71%);text-shadow:0 1px rgba(0, 0, 0, 0.3)"><span class="token plain"></span><span class="token keyword" style="color:hsl(286, 60%, 67%)">def</span><span class="token plain"> </span><span class="token function" style="color:hsl(207, 82%, 66%)">udf</span><span class="token punctuation" style="color:hsl(220, 14%, 71%)">(</span><span class="token punctuation" style="color:hsl(220, 14%, 71%)">)</span><span class="token punctuation" style="color:hsl(220, 14%, 71%)">:</span><span class="token plain"></span><br></span><span class="token-line" style="color:hsl(220, 14%, 71%);text-shadow:0 1px rgba(0, 0, 0, 0.3)"><span class="token plain">    </span><span class="token keyword" style="color:hsl(286, 60%, 67%)">import</span><span class="token plain"> pandas </span><span class="token keyword" style="color:hsl(286, 60%, 67%)">as</span><span class="token plain"> pd</span><br></span><span class="token-line" style="color:hsl(220, 14%, 71%);text-shadow:0 1px rgba(0, 0, 0, 0.3)"><span class="token plain">    </span><span class="token keyword" style="color:hsl(286, 60%, 67%)">return</span><span class="token plain"> pd</span><span class="token punctuation" style="color:hsl(220, 14%, 71%)">.</span><span class="token plain">read_parquet</span><span class="token punctuation" style="color:hsl(220, 14%, 71%)">(</span><span class="token string" style="color:hsl(95, 38%, 62%)">"s3://fused-sample/demo_data/airbnb_listings_sf.parquet"</span><span class="token punctuation" style="color:hsl(220, 14%, 71%)">)</span><br></span></code></pre></div></div>
<p>You can call thousands of jobs at the same time:</p>
<div class="language-python codeBlockContainer_Ckt0 theme-code-block" style="--prism-background-color:hsl(220, 13%, 18%);--prism-color:hsl(220, 14%, 71%)"><div class="codeBlockContent_QJqH"><pre tabindex="0" class="prism-code language-python codeBlock_bY9V thin-scrollbar" style="background-color:hsl(220, 13%, 18%);color:hsl(220, 14%, 71%);text-shadow:0 1px rgba(0, 0, 0, 0.3)"><code class="codeBlockLines_e6Vv"><span class="token-line" style="color:hsl(220, 14%, 71%);text-shadow:0 1px rgba(0, 0, 0, 0.3)"><span class="token decorator annotation punctuation" style="color:hsl(220, 14%, 71%)">@fused</span><span class="token decorator annotation punctuation" style="color:hsl(220, 14%, 71%)">.</span><span class="token decorator annotation punctuation" style="color:hsl(220, 14%, 71%)">udf</span><span class="token plain"></span><br></span><span class="token-line" style="color:hsl(220, 14%, 71%);text-shadow:0 1px rgba(0, 0, 0, 0.3)"><span class="token plain"></span><span class="token keyword" style="color:hsl(286, 60%, 67%)">def</span><span class="token plain"> </span><span class="token function" style="color:hsl(207, 82%, 66%)">udf</span><span class="token punctuation" style="color:hsl(220, 14%, 71%)">(</span><span class="token punctuation" style="color:hsl(220, 14%, 71%)">)</span><span class="token punctuation" style="color:hsl(220, 14%, 71%)">:</span><span class="token plain"></span><br></span><span class="token-line" style="color:hsl(220, 14%, 71%);text-shadow:0 1px rgba(0, 0, 0, 0.3)"><span class="token plain">    basic_example </span><span class="token operator" style="color:hsl(207, 82%, 66%)">=</span><span class="token plain"> fused</span><span class="token punctuation" style="color:hsl(220, 14%, 71%)">.</span><span class="token plain">load</span><span class="token punctuation" style="color:hsl(220, 14%, 71%)">(</span><span class="token string" style="color:hsl(95, 38%, 62%)">'process_data'</span><span class="token punctuation" style="color:hsl(220, 14%, 71%)">)</span><span class="token plain">  </span><span class="token comment" style="color:hsl(220, 10%, 40%)"># Load existing UDF</span><span class="token plain"></span><br></span><span class="token-line" style="color:hsl(220, 14%, 71%);text-shadow:0 1px rgba(0, 0, 0, 0.3)"><span class="token plain">    results </span><span class="token operator" style="color:hsl(207, 82%, 66%)">=</span><span class="token plain"> basic_example</span><span class="token punctuation" style="color:hsl(220, 14%, 71%)">.</span><span class="token builtin" style="color:hsl(95, 38%, 62%)">map</span><span class="token punctuation" style="color:hsl(220, 14%, 71%)">(</span><span class="token builtin" style="color:hsl(95, 38%, 62%)">range</span><span class="token punctuation" style="color:hsl(220, 14%, 71%)">(</span><span class="token number" style="color:hsl(29, 54%, 61%)">100_000</span><span class="token punctuation" style="color:hsl(220, 14%, 71%)">)</span><span class="token punctuation" style="color:hsl(220, 14%, 71%)">,</span><span class="token plain"> max_workers</span><span class="token operator" style="color:hsl(207, 82%, 66%)">=</span><span class="token number" style="color:hsl(29, 54%, 61%)">500</span><span class="token punctuation" style="color:hsl(220, 14%, 71%)">)</span><span class="token plain">  </span><span class="token comment" style="color:hsl(220, 10%, 40%)"># Run in parallel</span><span class="token plain"></span><br></span><span class="token-line" style="color:hsl(220, 14%, 71%);text-shadow:0 1px rgba(0, 0, 0, 0.3)"><span class="token plain">    </span><span class="token keyword" style="color:hsl(286, 60%, 67%)">return</span><span class="token plain"> results</span><span class="token punctuation" style="color:hsl(220, 14%, 71%)">.</span><span class="token plain">df</span><span class="token punctuation" style="color:hsl(220, 14%, 71%)">(</span><span class="token punctuation" style="color:hsl(220, 14%, 71%)">)</span><br></span></code></pre></div></div>
<p>This spins up as many nodes as needed under the hood.</p>
<img src="https://docs-staging.fused.io/pr/1353/assets/images/fused-parallel-73b5d5645060adac352b3b57fbdd595c.jpg" alt="Fused parallel job execution" style="width:75%;display:block;margin:0 auto">
<p>To put the performance in perspective: two thousand 90-second jobs can be done in 120 wall-clock seconds with Fused. That's only 30 seconds of total orchestration overhead across 2,000 concurrent, completely independent jobs — each on a dedicated 4-core machine with 10 GB of RAM. That's <strong>0.015 seconds of overhead per job.</strong></p>
<p>For context: a regular EC2 instance of 128 cores takes ~2 minutes just to turn on.</p>
<p>Fused turns on the machine, installs dependencies, authenticates credentials, and completes a 90-second job in the same time it takes that EC2 instance to boot.</p>
<h3 class="anchor anchorTargetStickyNavbar_Vzrq" id="the-takeaway">The takeaway<a href="https://docs-staging.fused.io/pr/1353/blog/modern-data-stack-is-dead/#the-takeaway" class="hash-link" aria-label="Direct link to The takeaway" title="Direct link to The takeaway" translate="no">​</a></h3>
<p>AI is writing the code. Open formats are simplifying data. Serverless is removing infrastructure. What’s missing is a way to run all of this reliably.</p>
<p>That’s what we’re building with Fused.</p>
<h3 class="anchor anchorTargetStickyNavbar_Vzrq" id="try-fused">Try Fused<a href="https://docs-staging.fused.io/pr/1353/blog/modern-data-stack-is-dead/#try-fused" class="hash-link" aria-label="Direct link to Try Fused" title="Direct link to Try Fused" translate="no">​</a></h3>
<p>You can try it out yourself at <a href="https://www.fused.io/workbench" target="_blank" rel="noopener noreferrer" class="">fused.io/workbench</a> or <a href="https://docs.fused.io/" target="_blank" rel="noopener noreferrer" class="">read the docs</a> to learn more.</p>]]></content>
        <author>
            <name>Max Lenormand</name>
            <uri>https://www.linkedin.com/in/max-lenormand-b94640107/</uri>
        </author>
        <author>
            <name>Isaac Brodsky</name>
            <uri>https://www.linkedin.com/in/isaacbrodsky/</uri>
        </author>
        <author>
            <name>Sina Kashuk</name>
            <uri>https://www.linkedin.com/in/skashuk/</uri>
        </author>
        <category label="data" term="data"/>
        <category label="duckdb" term="duckdb"/>
        <category label="serverless" term="serverless"/>
        <category label="ai" term="ai"/>
    </entry>
    <entry>
        <title type="html"><![CDATA[Introducing Fused AI Canvas]]></title>
        <id>https://docs-staging.fused.io/pr/1353/blog/intro-fused-canvas/</id>
        <link href="https://docs-staging.fused.io/pr/1353/blog/intro-fused-canvas/"/>
        <updated>2025-10-30T00:00:00.000Z</updated>
        <summary type="html"><![CDATA[Today we're introducing Fused AI Canvas, a new way to organize your UDFs on a free form canvas]]></summary>
        <content type="html"><![CDATA[<p>Today we're introducing Fused AI Canvas, a new way to organize your <a class="" href="https://docs-staging.fused.io/pr/1353/guide/working-with-udfs/writing-udfs/">UDFs</a> on a free form canvas</p>
<!-- -->
<iframe style="width:100%;max-width:800px;aspect-ratio:16/9;height:auto;margin:0 auto 2rem auto;display:block" src="https://www.youtube.com/embed/_WBYBMIraIE" title="YouTube video player" frameborder="0" allow="accelerometer; autoplay; clipboard-write; encrypted-media; gyroscope; picture-in-picture; web-share" referrerpolicy="strict-origin-when-cross-origin" allowfullscreen=""></iframe>
<h2 class="anchor anchorTargetStickyNavbar_Vzrq" id="a-free-form-canvas">A Free Form Canvas<a href="https://docs-staging.fused.io/pr/1353/blog/intro-fused-canvas/#a-free-form-canvas" class="hash-link" aria-label="Direct link to A Free Form Canvas" title="Direct link to A Free Form Canvas" translate="no">​</a></h2>
<p>Organize &amp; move your <a class="" href="https://docs-staging.fused.io/pr/1353/guide/working-with-udfs/writing-udfs/">UDFs</a> as you build your workflow on a free form canvas, allowing you to build analysis &amp; workflows without being limited to a linear flow!</p>
<img style="width:100%;max-width:800px;height:auto;margin:0 auto 2rem auto;display:block" src="https://fused-magic.s3.us-west-2.amazonaws.com/workbench-walkthrough-videos/blogs/2025-10-30-intro-canvas/moving_elements_on_canvas.gif" alt="Moving elements on canvas">
<h2 class="anchor anchorTargetStickyNavbar_Vzrq" id="create-workflows">Create workflows<a href="https://docs-staging.fused.io/pr/1353/blog/intro-fused-canvas/#create-workflows" class="hash-link" aria-label="Direct link to Create workflows" title="Direct link to Create workflows" translate="no">​</a></h2>
<p>Fused Canvas still runs individual serverless UDFs but you can now more easily connect them together</p>
<img style="width:100%;max-width:800px;height:auto;margin:0 auto 2rem auto;display:block" src="https://fused-magic.s3.us-west-2.amazonaws.com/workbench-walkthrough-videos/blogs/2025-10-30-intro-canvas/connecting_udfs.gif" alt="Connecting UDFs">
<h2 class="anchor anchorTargetStickyNavbar_Vzrq" id="share-in-1-click">Share in 1 click<a href="https://docs-staging.fused.io/pr/1353/blog/intro-fused-canvas/#share-in-1-click" class="hash-link" aria-label="Direct link to Share in 1 click" title="Direct link to Share in 1 click" translate="no">​</a></h2>
<p>Share your work to anyone with a single click</p>
<img style="width:100%;max-width:800px;height:auto;margin:0 auto 2rem auto;display:block" src="https://fused-magic.s3.us-west-2.amazonaws.com/workbench-walkthrough-videos/blogs/2025-10-30-intro-canvas/share_in_one_link.gif" alt="Share canvas">
<h2 class="anchor anchorTargetStickyNavbar_Vzrq" id="try-it-out">Try it out<a href="https://docs-staging.fused.io/pr/1353/blog/intro-fused-canvas/#try-it-out" class="hash-link" aria-label="Direct link to Try it out" title="Direct link to Try it out" translate="no">​</a></h2>
<p>Try out <a href="https://www.fused.io/workbench" target="_blank" rel="noopener noreferrer" class="">Fused Canvas</a> right away for free</p>]]></content>
        <author>
            <name>Sina Kashuk</name>
            <uri>https://www.linkedin.com/in/skashuk/</uri>
        </author>
        <author>
            <name>Isaac Brodsky</name>
            <uri>https://www.linkedin.com/in/isaacbrodsky/</uri>
        </author>
        <category label="fused" term="fused"/>
        <category label="workbench" term="workbench"/>
        <category label="announcement" term="announcement"/>
        <category label="canvas" term="canvas"/>
        <category label="browser" term="browser"/>
    </entry>
    <entry>
        <title type="html"><![CDATA[Building Geospatial Real-Time Analysis in Fused]]></title>
        <id>https://docs-staging.fused.io/pr/1353/blog/building-geospatial-real-time-analysis-in-fused/</id>
        <link href="https://docs-staging.fused.io/pr/1353/blog/building-geospatial-real-time-analysis-in-fused/"/>
        <updated>2025-10-24T00:00:00.000Z</updated>
        <summary type="html"><![CDATA[Chris Kyed, Data Scientist at Pacific Spatial Solutions, showcases 3 real time geospatial analysis uses cases for Fused.]]></summary>
        <content type="html"><![CDATA[<p><a href="https://www.linkedin.com/in/christopher-kyed-1388aa156/" target="_blank" rel="noopener noreferrer" class="">Chris Kyed</a>, Data Scientist at <a href="https://www.pacificspatial.com/" target="_blank" rel="noopener noreferrer" class="">Pacific Spatial Solutions</a>, showcases 3 real time geospatial analysis uses cases for Fused.</p>
<!-- -->
<iframe style="width:100%;max-width:800px;aspect-ratio:16/9;height:auto;margin:0 auto 2rem auto;display:block" src="https://www.youtube.com/embed/0iYtFRSR9PE" title="YouTube video player" frameborder="0" allow="accelerometer; autoplay; clipboard-write; encrypted-media; gyroscope; picture-in-picture; web-share" referrerpolicy="strict-origin-when-cross-origin" allowfullscreen=""></iframe>
<p>Last year Chris showcased how <a class="" href="https://docs-staging.fused.io/pr/1353/blog/analyzing-traffic-speeds/">Pacific Spatial uses Fused to analyze 100 Billion drive records</a>. Pacific Spatial Solutions is a company that provides geospatial analysis &amp; data science services for various industries in Japan.</p>
<h3 class="anchor anchorTargetStickyNavbar_Vzrq" id="ocean-health-mapping">Ocean Health Mapping<a href="https://docs-staging.fused.io/pr/1353/blog/building-geospatial-real-time-analysis-in-fused/#ocean-health-mapping" class="hash-link" aria-label="Direct link to Ocean Health Mapping" title="Direct link to Ocean Health Mapping" translate="no">​</a></h3>
<p>River plumes carry nutrients/sediment to the ocean and are split in 2 broad categories:</p>
<ul>
<li class="">Good plume: natural sediment/nutrient redistribute &amp; add biodiversity</li>
<li class="">Bad plume: excessive sediment/waste water and toxins/agricultural fertilizer with negative biodiversity impacts</li>
</ul>
<p>Mapping them can be helpful for understanding the health and human activities impact on the ocean.</p>
<p><img decoding="async" loading="lazy" alt="Ocean health mapping" src="https://docs-staging.fused.io/pr/1353/assets/images/chris_webinar_ocean_health-965c5f542106dc4312a8cc57b71281c8.png" width="1024" height="834" class="img_ev3q"></p>
<p>These datasets are open and available through the <a href="https://data.earth.jaxa.jp/en/" target="_blank" rel="noopener noreferrer" class="">Jaxa Earth API</a> :</p>
<ul>
<li class=""><a href="https://data.earth.jaxa.jp/en/datasets/#/id/JAXA.G-Portal_GCOM-C.SGLI_standard.L3-CHLA.daytime.v3_global_half-monthly" target="_blank" rel="noopener noreferrer" class="">Chlorophyll-a concentration (Daytime/Half-monthly)</a></li>
<li class=""><a href="https://data.earth.jaxa.jp/en/datasets/#/id/JAXA.G-Portal_GCOM-C.SGLI_standard.L3-SST.daytime.v3_global_half-monthly" target="_blank" rel="noopener noreferrer" class="">Sea surface temperature (Daytime/Half-monthly)</a></li>
<li class=""><a href="https://data.earth.jaxa.jp/en/datasets/#/id/JAXA.EORC_GSMaP_standard.Gauge.00Z-23Z.v6_half-monthly" target="_blank" rel="noopener noreferrer" class="">Precipitation Rate (Half-monthly)</a></li>
</ul>
<h3 class="anchor anchorTargetStickyNavbar_Vzrq" id="rainfall--incidence-data">Rainfall &amp; Incidence Data<a href="https://docs-staging.fused.io/pr/1353/blog/building-geospatial-real-time-analysis-in-fused/#rainfall--incidence-data" class="hash-link" aria-label="Direct link to Rainfall &amp; Incidence Data" title="Direct link to Rainfall &amp; Incidence Data" translate="no">​</a></h3>
<p>Traffic accidents and traffic safety has been one of the most important problems for the last many decades. Now that we have publicly accessible data regarding the accidents, we need to find ways to access and analyze it.</p>
<p>The Japanese National Police Agency published yearly traffic incidence data all around the country.</p>
<ul>
<li class=""><a href="https://www.npa.go.jp/publications/statistics/koutsuu/opendata/index_opendata.html" target="_blank" rel="noopener noreferrer" class="">Index of Open data on traffic accident statistics</a></li>
</ul>
<p><img decoding="async" loading="lazy" alt="Japan incidence data" src="https://docs-staging.fused.io/pr/1353/assets/images/japan_incidence_data-6ac3b5f305c90bc98b2b274cd0a80637.png" width="1508" height="928" class="img_ev3q"></p>
<p>Explore the code directly in Fused:</p>
<ul>
<li class=""><a href="https://www.fused.io/workbench/udf/catalog/community_max_html_accident_h3_tile-565a9469-8557-4415-a964-9b5da4cb49f5" target="_blank" rel="noopener noreferrer" class="">Incidence Data as tiled H3</a></li>
<li class=""><a href="https://www.fused.io/workbench/udf/catalog/community_max_JP_intersection_accidents-c96ff8c6-9fae-4532-9f49-7c0be0134beb" target="_blank" rel="noopener noreferrer" class="">Japanese Police Intersection Accidents</a></li>
</ul>
<h3 class="anchor anchorTargetStickyNavbar_Vzrq" id="tokyo-shadow-map">Tokyo Shadow Map<a href="https://docs-staging.fused.io/pr/1353/blog/building-geospatial-real-time-analysis-in-fused/#tokyo-shadow-map" class="hash-link" aria-label="Direct link to Tokyo Shadow Map" title="Direct link to Tokyo Shadow Map" translate="no">​</a></h3>
<p>Japanese summers can get very hot, which is amplified in large urban areas creating urban heat islands.</p>
<p>Prolonged exposure to the sun can cause dehydration and sunstroke, so we want to give Tokyo residents and tourists an app that can help them navigate the city in a more comfortable way.</p>
<p>Pacific Spatial Solutions is creating shadow maps for the city of Tokyo by combining 121 point clouds in batch and transforming them into 0.5m resolution DSM data and dynamically rendering them in Fused:</p>
<p><img decoding="async" loading="lazy" alt="Tokyo shadow maps" src="https://docs-staging.fused.io/pr/1353/assets/images/tokyo_shadow_maps-1f6b3f5e8cca3ac06ae2ec44b5ccd432.png" width="1024" height="774" class="img_ev3q"></p>
<ul>
<li class=""><a href="https://tokyooasis.com/search.html?category=idea" target="_blank" rel="noopener noreferrer" class="">Online Japan Shadow Map</a></li>
<li class=""><a href="https://3dview.tokyo-digitaltwin.metro.tokyo.lg.jp/" target="_blank" rel="noopener noreferrer" class="">3D point cloud data</a></li>
</ul>
<h3 class="anchor anchorTargetStickyNavbar_Vzrq" id="learn-more-about-fused">Learn more about Fused<a href="https://docs-staging.fused.io/pr/1353/blog/building-geospatial-real-time-analysis-in-fused/#learn-more-about-fused" class="hash-link" aria-label="Direct link to Learn more about Fused" title="Direct link to Learn more about Fused" translate="no">​</a></h3>
<ul>
<li class="">Try out <a href="https://www.fused.io/workbench" target="_blank" rel="noopener noreferrer" class="">Fused for yourself</a> for free!</li>
<li class="">Dive deeper in the <a class="" href="https://docs-staging.fused.io/pr/1353/guide/working-with-udfs/udf-best-practices/geospatial-single-vs-tile/">Geospatial with Fused</a> tutorials</li>
<li class="">Learn more about working with <a class="" href="https://docs-staging.fused.io/pr/1353/guide/h3-analytics/h3-overview/">H3 Tiles</a></li>
</ul>]]></content>
        <author>
            <name>Christopher Kyed</name>
            <uri>https://www.linkedin.com/in/christopher-kyed-1388aa156/</uri>
        </author>
        <category label="weather" term="weather"/>
        <category label="rainfall" term="rainfall"/>
        <category label="global" term="global"/>
        <category label="ocean" term="ocean"/>
        <category label="hex" term="hex"/>
        <category label="geospatial" term="geospatial"/>
    </entry>
    <entry>
        <title type="html"><![CDATA[Analytics is Changing (Again)]]></title>
        <id>https://docs-staging.fused.io/pr/1353/blog/analytics-is-changing/</id>
        <link href="https://docs-staging.fused.io/pr/1353/blog/analytics-is-changing/"/>
        <updated>2025-08-01T00:00:00.000Z</updated>
        <summary type="html"><![CDATA[AI has revolutionized how we write code; now it's reshaping how data teams can work.]]></summary>
        <content type="html"><![CDATA[<p>AI has revolutionized how we write code; now it's reshaping how data teams can work.</p>
<!-- -->
<!-- -->
<!-- -->
<h3 class="anchor anchorTargetStickyNavbar_Vzrq" id="data--compute--llms--analytics-at-the-speed-of-thought">Data + Compute + LLMs = Analytics at the Speed of Thought<a href="https://docs-staging.fused.io/pr/1353/blog/analytics-is-changing/#data--compute--llms--analytics-at-the-speed-of-thought" class="hash-link" aria-label="Direct link to Data + Compute + LLMs = Analytics at the Speed of Thought" title="Direct link to Data + Compute + LLMs = Analytics at the Speed of Thought" translate="no">​</a></h3>
<p>The way we <strong>interact with data changes constantly</strong>; we only need to look at the last few years to see that we are seeing a shift as part of the <a href="https://wesmckinney.com/blog/looking-back-15-years/" target="_blank" rel="noopener noreferrer" class="">"Great Decoupling”</a> – a broader movement toward zero-infrastructure.</p>
<p>By adding Serverless Compute – via <strong>cloud functions</strong> or the <strong>browser</strong> – to formats like Apache Parquet and engines such as DuckDB, we unlock blazing fast analytics without clusters or VMs. Now AI is entering the mix, and we think this is the perfect timing to put all the pieces together.</p>
<p>We don’t think analysts, data engineers &amp; scientists are going anywhere. We believe that <a href="https://www.forbes.com/sites/reeceakhtar/2025/03/27/ai-wont-replace-you-a-human-using-ai-will/" target="_blank" rel="noopener noreferrer" class="">“AI won’t replace you, a human using AI will”</a>. AI amplifies the creativity and speed of the people already doing the work.</p>
<p>Here’s how we think the future of analytics looks like:</p>
<ul>
<li class=""><strong>Data context limits hallucination</strong>: Having LLMs know exactly about the structure and content of your data means AI is much less likely to hallucinate.</li>
<li class=""><strong>Code execution as validation</strong>: AI code editors help write code, but can’t actually run it. At Fused we’re building on top of our <a class="" href="https://docs-staging.fused.io/pr/1353/quickstart/data-science/">real time execution engine</a>, so errors in code are spotted and fixed much faster, all in the same workflow.</li>
<li class=""><strong>Human analysts to guide the work</strong>: LLMs can write every possible query imaginable to parse a dataset, or make whichever chart you want. Answering the questions becomes easier, so asking the right questions becomes more valuable.</li>
</ul>
<p><img decoding="async" loading="lazy" alt="Three ways working with AI is changing analytics" src="https://docs-staging.fused.io/pr/1353/assets/images/3_points_fused_overview-5a8a791b571e97ce94f9dbec05ae877d.png" width="2092" height="1036" class="img_ev3q"></p>
<h3 class="anchor anchorTargetStickyNavbar_Vzrq" id="so-what-is-vibe-analytics">So... What is Vibe Analytics?<a href="https://docs-staging.fused.io/pr/1353/blog/analytics-is-changing/#so-what-is-vibe-analytics" class="hash-link" aria-label="Direct link to So... What is Vibe Analytics?" title="Direct link to So... What is Vibe Analytics?" translate="no">​</a></h3>
<p>A few months ago Andrej Karpathy coined the term <a href="https://x.com/karpathy/status/1886192184808149383" target="_blank" rel="noopener noreferrer" class="">Vibe Coding</a>: letting LLMs loose and just give in to whatever code suggestion comes around, to quickly get a prototype of a new project, specifically for web development.</p>
<p>We’ve since seen the term <a href="https://sloanreview.mit.edu/article/vibe-analytics-vibe-codings-new-cousin-unlocks-insights/" target="_blank" rel="noopener noreferrer" class="">Vibe Analytics</a> starting to pop up around, applying a similar approach but to analytics: leveraging LLMs to make it easier and faster to create analysis, make dashboards and share them to the rest of the team.</p>
<div class="video__wrapper"><video src="https://youtu.be/h27JcnQp250" preload="metadata" controls="" muted="" playsinline="" style="width:100%;height:100%;display:block"></video></div>
<p>There are a few core differences though:</p>
<ul>
<li class=""><strong>Analytics have to be based on real data</strong>: This is where having data-aware LLMs becomes so much more important.</li>
<li class=""><strong>Integrated with your tools</strong>: Unlike building web apps, analytics workflows require access to data and compute. Files need to be read &amp; analysed by AI directly. Doing this properly isn’t only about making an AI Code Editor and pushing the code up once it’s written.</li>
<li class=""><strong>Human guidance throughout</strong>: LLMs are incredibly knowledgeable but have no self awareness of what they actually are doing. It’s still important to have proper analysts &amp; engineers to guide the work.</li>
</ul>
<div style="display:flex;justify-content:center"><table><thead><tr><th></th><th><strong>Vibe Coding</strong></th><th><strong>Vibe Analytics</strong></th></tr></thead><tbody><tr><td><strong>Context</strong></td><td>None, starting from scratch</td><td>Rooted in existing data</td></tr><tr><td><strong>Output</strong></td><td>Code, experiments</td><td>Live insights, dashboards, APIs based on real datasets</td></tr><tr><td><strong>Guidance</strong></td><td>Fast loops via UI</td><td>Human-in-the-loop workflows</td></tr><tr><td><strong>Purpose</strong></td><td>Rapidly creating app prototypes</td><td>Quickly answering complex data questions</td></tr></tbody></table></div>
<h3 class="anchor anchorTargetStickyNavbar_Vzrq" id="come-build-with-us">Come Build With Us!<a href="https://docs-staging.fused.io/pr/1353/blog/analytics-is-changing/#come-build-with-us" class="hash-link" aria-label="Direct link to Come Build With Us!" title="Direct link to Come Build With Us!" translate="no">​</a></h3>
<p>Help us build the <a href="https://fused.io/" target="_blank" rel="noopener noreferrer" class="">future of data analytics</a>. Reach out to us directly (<a href="mailto:info@fused.io" target="_blank" rel="noopener noreferrer" class="">info@fused.io</a>) or see our <a href="https://www.fused.io/careers" target="_blank" rel="noopener noreferrer" class="">open positions</a>.</p>
<hr>
<p>We did take inspiration from Andrej Karpathy's recent <a href="https://youtu.be/LCEmiRjPEtQ?si=TbwyWDJvJbgZNPKX" target="_blank" rel="noopener noreferrer" class="">Software is Changing (Again)</a> talk at AI Startup School, as you may have noticed from the title.</p>]]></content>
        <author>
            <name>Sina Kashuk</name>
            <uri>https://www.linkedin.com/in/skashuk/</uri>
        </author>
        <author>
            <name>Isaac Brodsky</name>
            <uri>https://www.linkedin.com/in/isaacbrodsky/</uri>
        </author>
        <author>
            <name>Max Lenormand</name>
            <uri>https://www.linkedin.com/in/max-lenormand-b94640107/</uri>
        </author>
        <category label="announcements" term="announcements"/>
        <category label="ai chat" term="ai chat"/>
    </entry>
    <entry>
        <title type="html"><![CDATA[Fused is SOC2 Type 1 Compliant!]]></title>
        <id>https://docs-staging.fused.io/pr/1353/blog/fused-is-soc2-type1-compliance/</id>
        <link href="https://docs-staging.fused.io/pr/1353/blog/fused-is-soc2-type1-compliance/"/>
        <updated>2025-07-08T00:00:00.000Z</updated>
        <summary type="html"><![CDATA[We're excited to announce that Fused has achieved SOC 2 Type 1 compliance. This is a significant milestone for us, as it demonstrates our commitment to security and transparency.]]></summary>
        <content type="html"><![CDATA[<p>We're excited to announce that Fused has achieved SOC 2 Type 1 compliance. This is a significant milestone for us, as it demonstrates our commitment to security and transparency.</p>
<!-- -->
<p>At Fused, we want to allow all data teams to get work done quickly. We want to make sure to do this on top of a secure and compliant platform.</p>
<p>Through the comprehensive auditing process overseen by <a href="https://insightassurance.com/" target="_blank" rel="noopener noreferrer" class="">Insight Assurance</a>, we've demonstrated our adherence
to the stringent requirements outlined by the SOC 2 Type 1 standard, reinforcing our dedication to safeguarding
sensitive data and maintaining operational resilience.</p>
<p>Request the full report by email: <code>info@fused.io</code>.</p>
<p>We're actively pursuing SOC 2 Type 2 certification, building on our existing Type 1 compliance.</p>]]></content>
        <author>
            <name>Isaac Brodsky</name>
            <uri>https://www.linkedin.com/in/isaacbrodsky/</uri>
        </author>
        <author>
            <name>Max Lenormand</name>
            <uri>https://www.linkedin.com/in/max-lenormand-b94640107/</uri>
        </author>
        <category label="announcements" term="announcements"/>
        <category label="security" term="security"/>
        <category label="enterprise" term="enterprise"/>
    </entry>
    <entry>
        <title type="html"><![CDATA[Notes from EO Summit 2025]]></title>
        <id>https://docs-staging.fused.io/pr/1353/blog/notes-from-eo-summit/</id>
        <link href="https://docs-staging.fused.io/pr/1353/blog/notes-from-eo-summit/"/>
        <updated>2025-06-19T00:00:00.000Z</updated>
        <summary type="html"><![CDATA[Last week, we were at EO Summit, Fused came out of beta, we officially launched our new site and are open for business!]]></summary>
        <content type="html"><![CDATA[<p>Last week, we were at EO Summit, <a href="https://www.fused.io/" target="_blank" rel="noopener noreferrer" class="">Fused</a> came out of beta, we officially launched our new site and are open for business!</p>
<p>Our mission is to <a href="https://youtu.be/btIhyq2KbN0?si=xAScmWKokKsmRSI8" target="_blank" rel="noopener noreferrer" class="">help data teams get stuff done quickly</a>, which is relevant for the people we talked to at EO Summit.</p>
<!-- -->
<!-- -->
<p><img decoding="async" loading="lazy" alt="Fused at EO Summit" src="https://docs-staging.fused.io/pr/1353/assets/images/fused_at_EO_summit_higher_res-8452cb00fa3a7e1fe8191bd4d88588ce.jpeg" width="1024" height="768" class="img_ev3q"></p>
<p>Here are some of our takeaways:</p>
<h3 class="anchor anchorTargetStickyNavbar_Vzrq" id="1-ai-makes-writing-code-simpler-but-executing-it-at-scale-is-still-hard">1. AI makes writing code simpler, but executing it at scale is still hard<a href="https://docs-staging.fused.io/pr/1353/blog/notes-from-eo-summit/#1-ai-makes-writing-code-simpler-but-executing-it-at-scale-is-still-hard" class="hash-link" aria-label="Direct link to 1. AI makes writing code simpler, but executing it at scale is still hard" title="Direct link to 1. AI makes writing code simpler, but executing it at scale is still hard" translate="no">​</a></h3>
<p>A lot of us are going through a bit of an existential crisis, while realising that damn, yep, AI can help us write code to glue datasets together quickly. Knowing the intricacies of a Python library isn’t a competitive advantage for individuals and companies to build the best analytics anymore.</p>
<p>That’s all well and good when working on a small, one-off project. But conferences like EO Summit keep showing that there’s more data than ever before. Archives of imagery, 3D point clouds and any dataset keeps growing in scale, resolution &amp; time backlog. Problems aren’t always local, nor limited to a small time &amp; place.</p>
<p>AI is changing what it means to build software &amp; products, there’s not doubt about that. But executing it at scale is still a dark art.</p>
<h3 class="anchor anchorTargetStickyNavbar_Vzrq" id="2-so-much-data-yet-we-still-struggle-to-get-things-done-in-a-timely-manner">2. So much data, yet we still struggle to get things done in a timely manner<a href="https://docs-staging.fused.io/pr/1353/blog/notes-from-eo-summit/#2-so-much-data-yet-we-still-struggle-to-get-things-done-in-a-timely-manner" class="hash-link" aria-label="Direct link to 2. So much data, yet we still struggle to get things done in a timely manner" title="Direct link to 2. So much data, yet we still struggle to get things done in a timely manner" translate="no">​</a></h3>
<p>At another conference, the <a href="https://conference.cloudnativegeo.org/CNGConference2025" target="_blank" rel="noopener noreferrer" class="">Cloud Native Geopaptial</a> last month <a href="https://www.linkedin.com/pulse/when-our-community-burned-where-satellite-information-pag%C3%A1n-phd-8rxwf/?trackingId=PGMihonBbG7ShNl4LvW20g%3D%3D" target="_blank" rel="noopener noreferrer" class="">Brianna Pagán shared her story of the Los Angeles fires taking down her home</a>, and while having so much data available, so little was actually accessible in a helpful manner quickly. This topic came again at this conference, wildfires being the prime example of the complexity of making timely and updated use of data in times of need despite having so much.</p>
<p>A few months ago, our own Milind Soni <a href="https://www.linkedin.com/posts/milind-soni-314075175_emergencyresponse-datascience-opendata-activity-7285803354876735489-lqJe?utm_source=share&amp;utm_medium=member_desktop&amp;rcm=ACoAABr4AqABaP1Bbk9D9gnGvRmXSaYnn0II3fg" target="_blank" rel="noopener noreferrer" class="">made a quick interactive dashboard</a> in a few hours as a proof of concept of what rapid tools could look like for wildfire updates using Fused.</p>
<p>These conversations are directly going into our internal product development discussion; as we write this, we're developing tools to build these dashboard for rapid iteration. Stay tuned for more on that soon!</p>
<h3 class="anchor anchorTargetStickyNavbar_Vzrq" id="3-the-gap-between-data--applications">3. The gap between data &amp; applications<a href="https://docs-staging.fused.io/pr/1353/blog/notes-from-eo-summit/#3-the-gap-between-data--applications" class="hash-link" aria-label="Direct link to 3. The gap between data &amp; applications" title="Direct link to 3. The gap between data &amp; applications" translate="no">​</a></h3>
<p><a href="https://www.linkedin.com/in/nadinealameh/" target="_blank" rel="noopener noreferrer" class="">Nadine Alameh</a>, at the head of the Taylor Geospatial Institute &amp; former CEO of the OGC, the consortium in charge of standards for all things geospatial, mentioned the lack of companies in the middle solving problems between data providers and companies building analytics products. This is something Aravind, head of Terrawatch -who organised this conference- <a href="https://newsletter.terrawatchspace.com/the-state-of-earth-observation-platforms/" target="_blank" rel="noopener noreferrer" class="">has been saying for a while</a>.</p>
<p>That’s why we were excited about being at EO Summit, we think we can make a difference tackling these problems!</p>
<p><img decoding="async" loading="lazy" alt="Talking to attendees" src="https://docs-staging.fused.io/pr/1353/assets/images/Talking_to_attendees-25fbdb4309251ee7325c0dd0037d05d1.jpeg" width="600" height="800" class="img_ev3q"></p>
<p>We’re building tools that make getting data from all types of places &amp; formats together, execute code (however it was written) at any scale with a few lines of code and sharing it all to whomever needs it, be it interactive dashboard, CSVs or tile servers.</p>
<p>If you’d like to learn more about Fused, <a href="https://calendly.com/max-fused/30min" target="_blank" rel="noopener noreferrer" class="">book some time with Max</a>, our Developer Advocate right here to get a demo!</p>]]></content>
        <author>
            <name>Max Lenormand</name>
            <uri>https://www.linkedin.com/in/max-lenormand-b94640107/</uri>
        </author>
        <category label="announcements" term="announcements"/>
        <category label="conferences" term="conferences"/>
    </entry>
    <entry>
        <title type="html"><![CDATA[Scaling Environmental Insights with Fused and H3]]></title>
        <id>https://docs-staging.fused.io/pr/1353/blog/environmental-insights/</id>
        <link href="https://docs-staging.fused.io/pr/1353/blog/environmental-insights/"/>
        <updated>2025-05-27T00:00:00.000Z</updated>
        <summary type="html"><![CDATA[Farmers and analysts face a familiar challenge: weather and crop data is fragmented, slow to process, and hard to act on.]]></summary>
        <content type="html"><![CDATA[<p>Farmers and analysts face a familiar challenge: weather and crop data is fragmented, slow to process, and hard to act on.</p>
<p>We worked with <a href="https://www.linkedin.com/in/emma-quirk-b90a51132/" target="_blank" rel="noopener noreferrer" class="">Emma Quirk</a> (Senior Data Analyst) and <a href="https://www.linkedin.com/in/majid-alivand-phd-27a4364b/" target="_blank" rel="noopener noreferrer" class="">Majid Alivand</a> (Senior Data &amp; Analytics Manager) to showcase how Fused can help bring all these datasets together. In this webinar they give an overview of the industry challenges interfacing backend data analytics with frontend data consumption. Emma walks through the notebook she used to model climate and irrigation patterns for vineyards.</p>
<iframe style="width:100%;max-width:800px;aspect-ratio:16/9;height:auto;margin:0 auto 2rem auto;display:block" src="https://www.youtube.com/embed/ESokph_0660" title="YouTube video player" frameborder="0" allow="accelerometer; autoplay; clipboard-write; encrypted-media; gyroscope; picture-in-picture; web-share" referrerpolicy="strict-origin-when-cross-origin" allowfullscreen=""></iframe>
<!-- -->
<h2 class="anchor anchorTargetStickyNavbar_Vzrq" id="addressing-the-challenge">Addressing the Challenge<a href="https://docs-staging.fused.io/pr/1353/blog/environmental-insights/#addressing-the-challenge" class="hash-link" aria-label="Direct link to Addressing the Challenge" title="Direct link to Addressing the Challenge" translate="no">​</a></h2>
<p>Building useful &amp; actionable weather models for environmental insights requires bringing datasets from:</p>
<ul>
<li class="">Different sources</li>
<li class="">Different resolutions</li>
<li class="">Different formats</li>
</ul>
<p>To address these challenges, Emma &amp; Majid used Fused + H3 to bring together datasets like GridMET climate, CDL crops, LANID irrigation, and gSSURGO soils by converting them from raster to H3 to build unified parquet files.</p>
<p>By <a class="" href="https://docs-staging.fused.io/pr/1353/guide/working-with-udfs/writing-udfs/">building UDFs</a> to manipulate each dataset, the team can iterate on their analysis in seconds while H3 allows them to more easily combine all the datasets together.</p>
<h2 class="anchor anchorTargetStickyNavbar_Vzrq" id="why-h3">Why H3?<a href="https://docs-staging.fused.io/pr/1353/blog/environmental-insights/#why-h3" class="hash-link" aria-label="Direct link to Why H3?" title="Direct link to Why H3?" translate="no">​</a></h2>
<!-- -->
<ul>
<li class="">Harmonized format across datasets and regions</li>
<li class="">Scalable queries at multiple resolutions</li>
<li class="">Compact storage parquets with improved spatial performance</li>
<li class="">No reprojection needed for global analyses</li>
<li class="">Equal neighbors for clean spatial logic</li>
</ul>
<h2 class="anchor anchorTargetStickyNavbar_Vzrq" id="try-it-out-for-yourself">Try it out for yourself<a href="https://docs-staging.fused.io/pr/1353/blog/environmental-insights/#try-it-out-for-yourself" class="hash-link" aria-label="Direct link to Try it out for yourself" title="Direct link to Try it out for yourself" translate="no">​</a></h2>
<p>Try out the notebook from the presentation for yourself:</p>
<ul>
<li class=""><a href="https://colab.research.google.com/drive/1F9SUD8aoYm2Ym6BArQ2bMISEx5xqKDHE?usp=sharing" target="_blank" rel="noopener noreferrer" class="">Colab Notebook</a></li>
</ul>
<p>Sign up for a <a href="https://www.fused.io/workbench" target="_blank" rel="noopener noreferrer" class="">free Fused account</a> and try it out for yourself!</p>]]></content>
        <author>
            <name>Emma Quirk</name>
            <uri>https://www.linkedin.com/in/emma-quirk-b90a51132/</uri>
        </author>
        <author>
            <name>Majid Alivand</name>
            <uri>https://www.linkedin.com/in/majid-alivand-phd-27a4364b/</uri>
        </author>
        <category label="environmental" term="environmental"/>
        <category label="notebook" term="notebook"/>
        <category label="h3" term="h3"/>
    </entry>
</feed>