Discovering NYC Chronotypes with Fused
Neighborhoods within a city have consistent characteristics but often have ill-defined boundaries. Some neighborhoods are more similar than others even though they’re not nearby. Understanding these local boundaries and the demographics, dynamics and behaviors of different areas affects a wide range of business applications, including advertising, site selection, business analytics, and many more.
As a data scientist at Precisely PlaceIQ, I get to spend much of my time using our vast portfolio of location data to develop these kinds of insights. Here, as a proxy for consumer activity, I used publicly available NYC Taxi pickup data to explore the similarity between different areas of New York City. I then used those similarity metrics to clarify the boundaries between different neighborhoods.
The analysis highlighted similarities between relatively distant areas within the city based on the dynamics of Taxi pickup volume they experience at different points of the day. This project uses Taxi pickups as an example to showcase a methodology that could be expanded to larger regions with even richer population dynamics datasets.
Analysis Workflow
Using the Fused UDF Builder, I created a UDF to load the Taxi dataset and bin it both spatially (by H3 hex) and temporally (by hour). This creates a map of discrete geographic units, each one with a vector of 24 values representing the number of taxi pickups occurring in that place at that hour of day. This enabled me to select any point in the city as a reference point, and compared it with all other hexagons using cosine-similarity and Jensen-Shannon distance techniques. As I iterated on my workflow, I visualized the values on the map in real time.
I evaluated two variants of the UDF:
- First, I binned the hourly counts into 4 day-parts, rather than 24 distinct hours, to reduce the number of dimensions.
- Second, instead of cosine similarity, I calculated the Jensen-Shannon distance of each vector with respect to the reference. This alternative measure treats the vectors as probability distributions rather than as a set of orthogonal dimensions, which makes more sense given that they represent times of day.
Inspecting different reference points highlights relatively distinct neighborhoods. For example, we compare New York City Hall, a municipal building, with a bustling nightlife hub in the Lower East Side of NYC. Although these two points are not the most disparate possible locations by distance, their activity patterns, represented by the taxi data, are almost opposite. Applying some smoothing and setting a threshold on the similarity values visually highlights specific boundaries around each neighborhood.
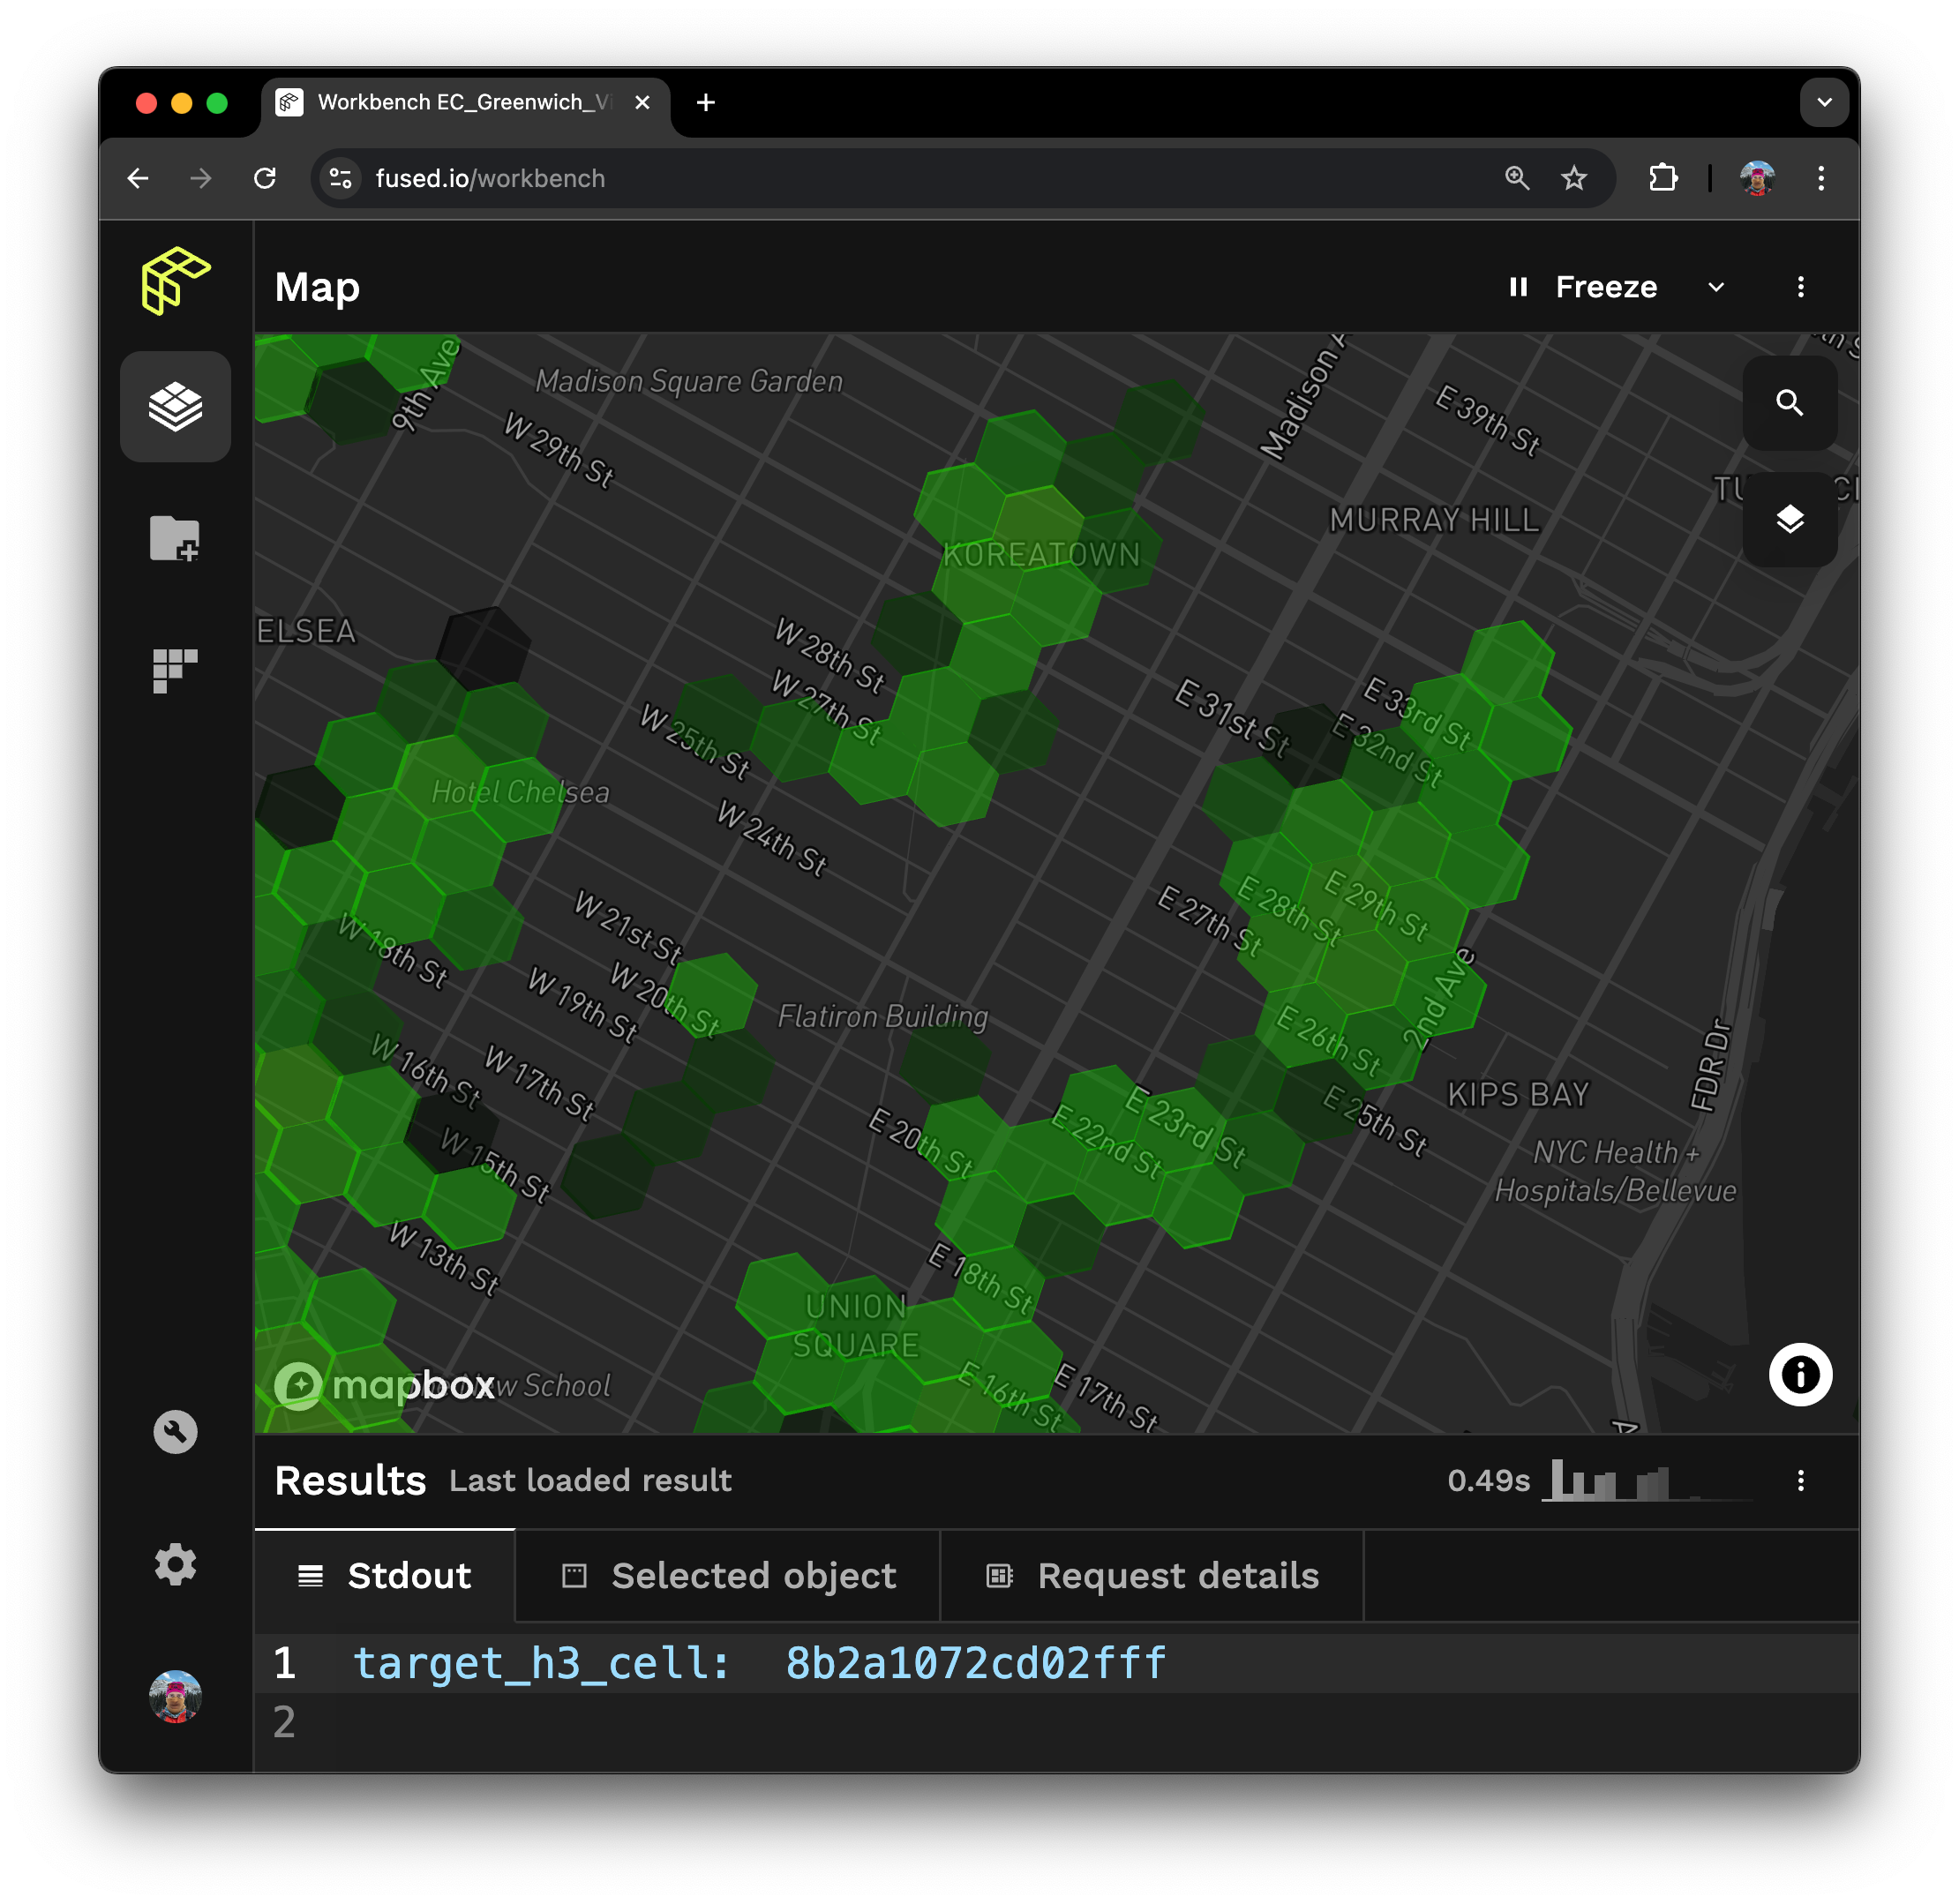
This also illuminates distant neighborhoods that are more similar to each reference point. In this example, the Greenwich village area, unsurprisingly, resembles the Lower East Side in its pickup times, as does West Harlem, as we can see in the map, even though it is several miles away on the other side of the city. We can also distinguish distinct differences between small areas, for example, the hyper-local Koreatown neighborhood, which spans just one block of 32nd street, stands out as especially nocturnal within the rest of the surrounding mid-town area.

Highlighting natural catchment area boundaries around Koreatown.
Statistical Analysis
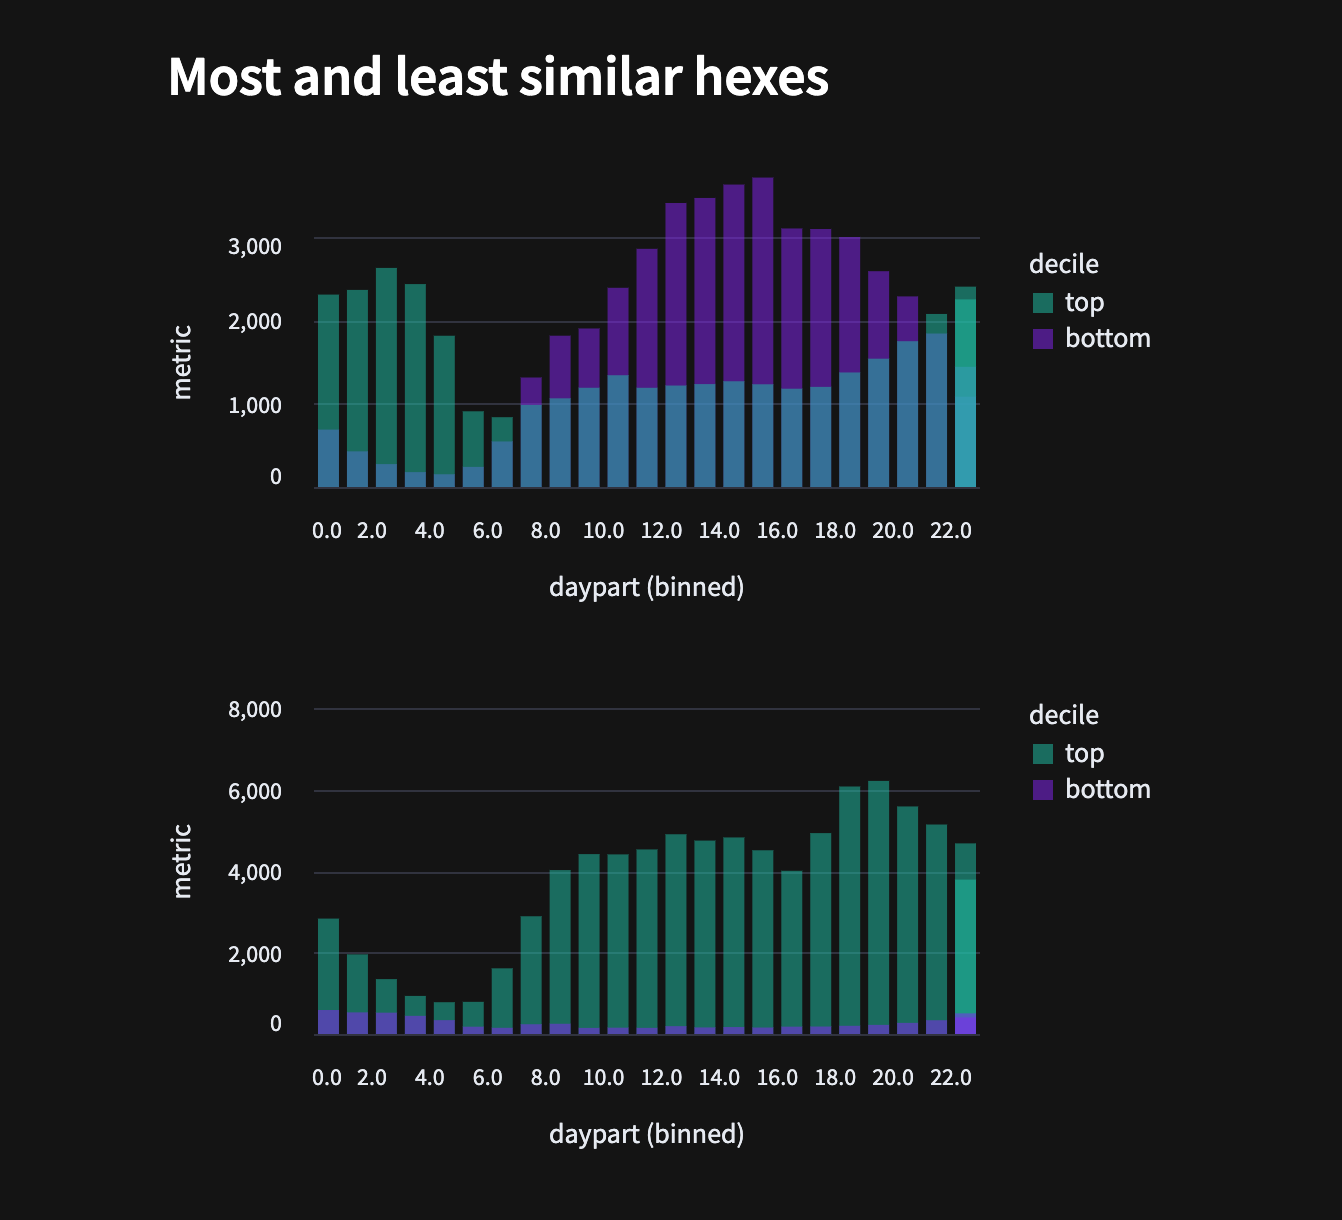
In the App Builder, we created graphs to summarize the similarity values shown in the map. Histograms of the pickups across the most and least similar hexes to each location confirm that the distributions are different for each. We can also explore the cumulative count of hexes to help determine an optimal threshold for similarity values, depending on the application.

Comparison between most and least similar hexes of two AOIs.
Conclusion
The Fused UDF Builder makes developing and iterating on these analyses swift and convenient, with no need to jump between different environments for developing vs viewing the results. And although the taxi dataset is small, the Fused Tiling functionality offer the possibility of developing similar analyses with larger datasets. With more data and richer features this proof-of-concept could be expanded to discover more robust, fully-defined neighborhoods, allowing us to develop data-driven approaches to local geography.
