How I Got Started Making Maps with Python and SQL
I am a self taught developer and data enthusiast. I first came across the spatial data community when I saw a Matt Forrest video on LinkedIn where he demonstrated how to visualize buildings from the Vida Combined Building Footprints dataset with DuckDB. Immediately I thought, what if you could see all the buildings in a country, say, Egypt? I set out to do just that and made this map with DuckDB and Datashader.
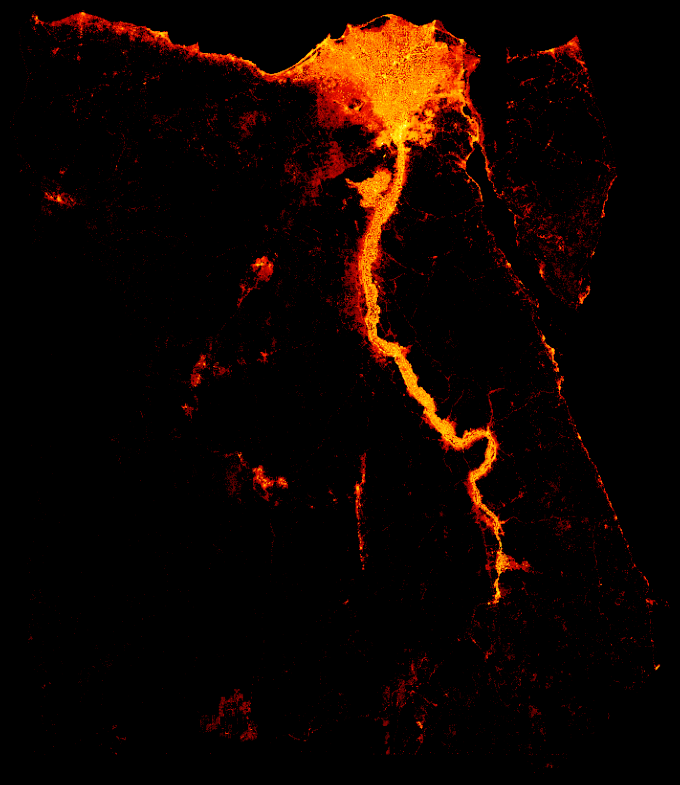
Buildings in Egypt.
Find Stephen's UDF code here:
Starting with Fused
The day after I posted that image on LinkedIn, in April, 2024, I had a call with Plinio Guzman of Fused. I told him what I had been up to, and he was enthusiastic and confident that Fused would fit my needs. One key feature he mentioned was the live development. While I was developing that Egypt map, I had to start the ETL to the final product over and over until I got it looking the way I wanted.
So I got started right away. I found Fused User Defined Functions (UDFs) like Overture Maps and the S2 Explorer and traveled all over the world looking for stunning images. It was thrilling to fly from New York to Tokyo and see the results render instantly.
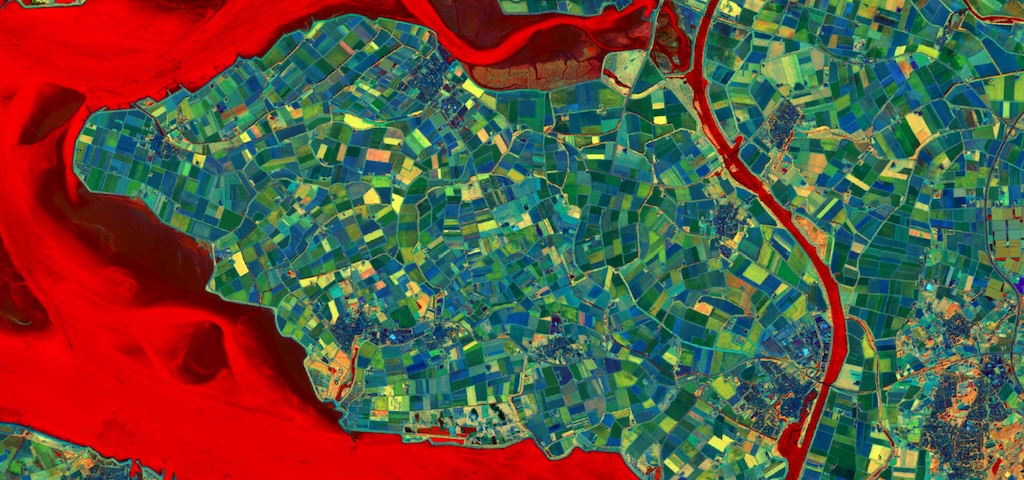
Exploring the world with Sentinel 2.
I then began to change the components of these UDFs to see different Overture types, but at this point I was hesitant to build my own UDF from scratch.
Instant UDFs
That was until Fused launched its File Explorer. With one click, it was now possible for me to create a UDF from providers like Source Cooperative and visualize with numerous presets like DuckDB or GeoPandas. With this new feature, I recreated my Egypt map with the same Vida dataset, this time using DuckDB with the H3 extension. It was liberating, I came to realize the components were simpler than I thought.
Local Tests
I used DuckDB with the H3 extension without Fused to query Overture Maps for countries and continents all locally in a Jupyter notebook. The benefit with the H3 extension is that if you set up the query right you can aggregate larger than in memory datasets at ease from your notebook.
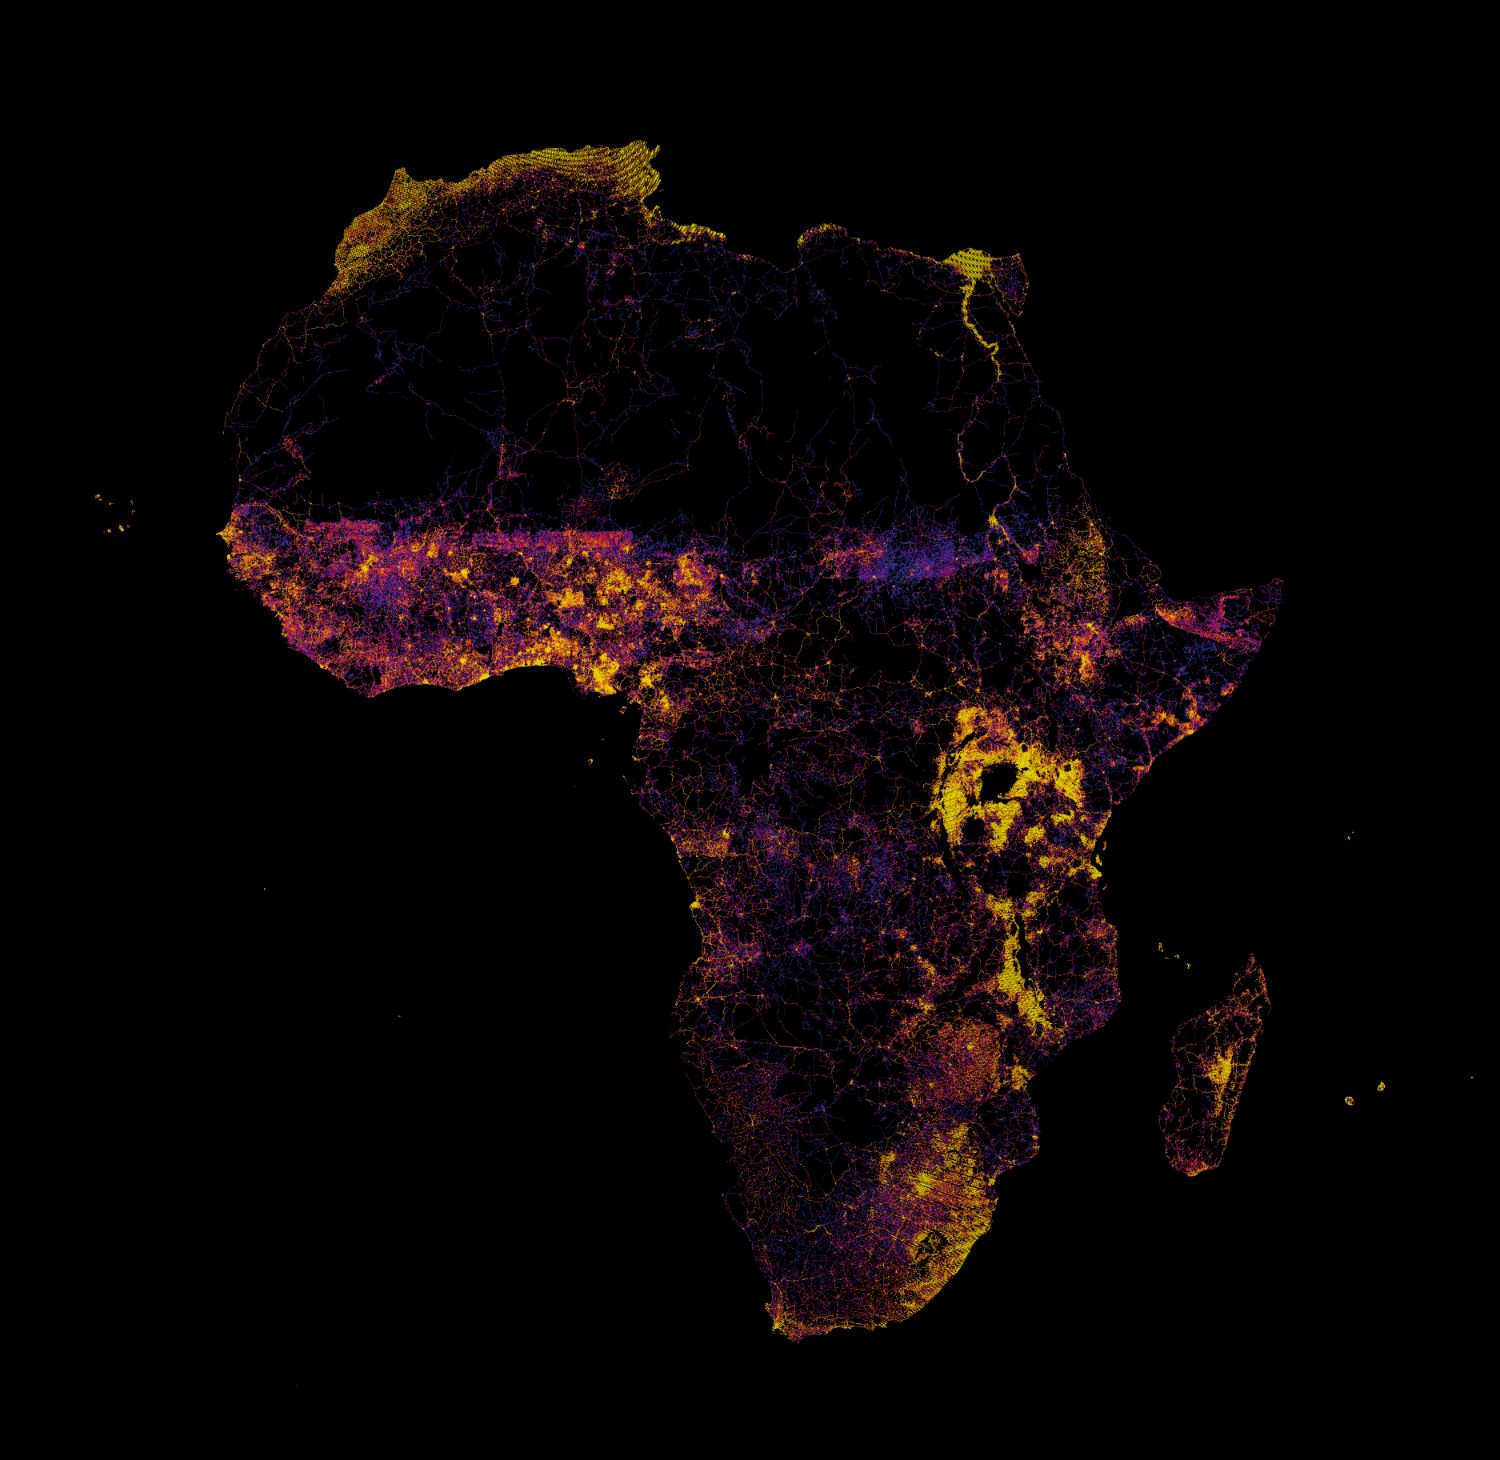
Road Density in Africa.
And made this Egypt building map with H3, how does it compare with the Datashader version up top?
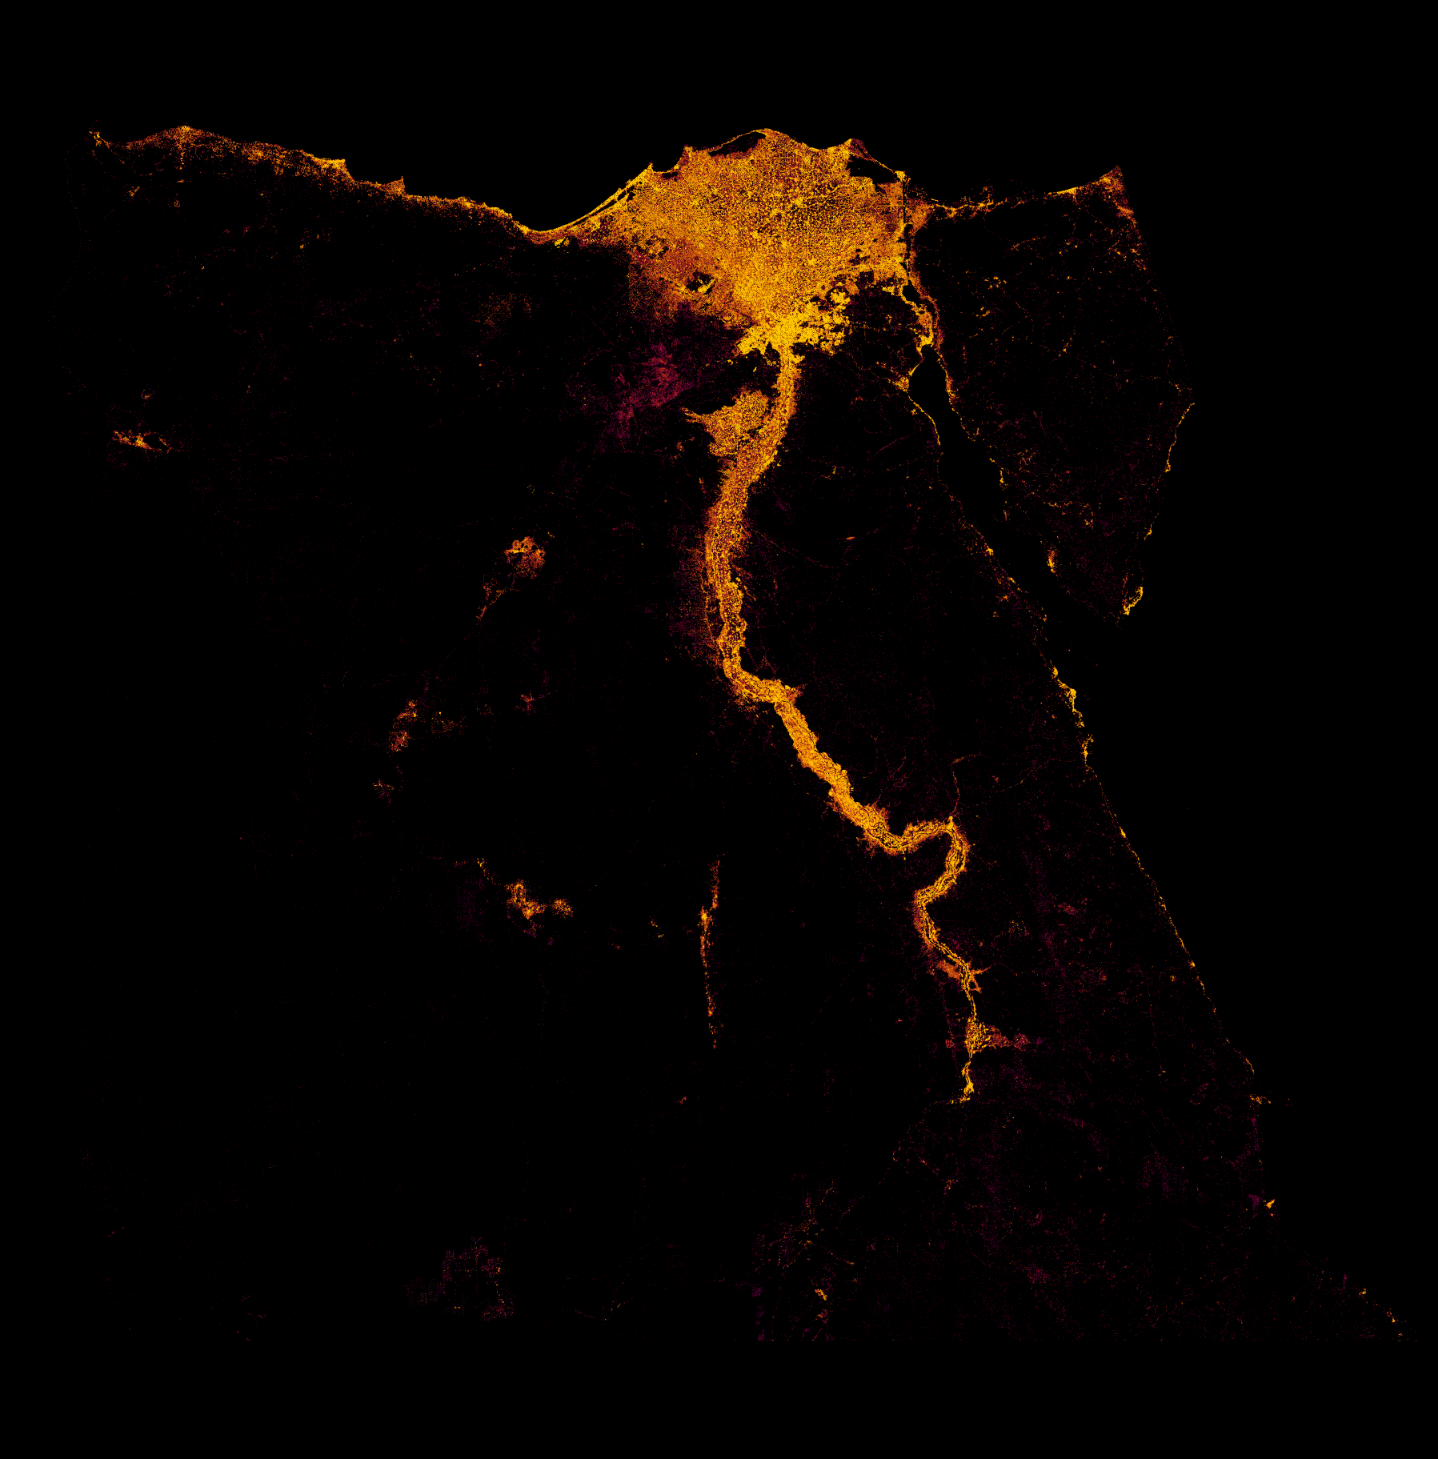
Egypt Building Density with H3.
Fused and Overture Maps
In August, Fused announced a tighter partnership with Overture Maps Foundation and that came with even more Overture features. Like with Source Cooperative I could now instantly generate UDF of buildings, places, land use, or roads, etc by joining parquet files (and more). I proceeded to use the framework of that UDF to join all kinds of data.
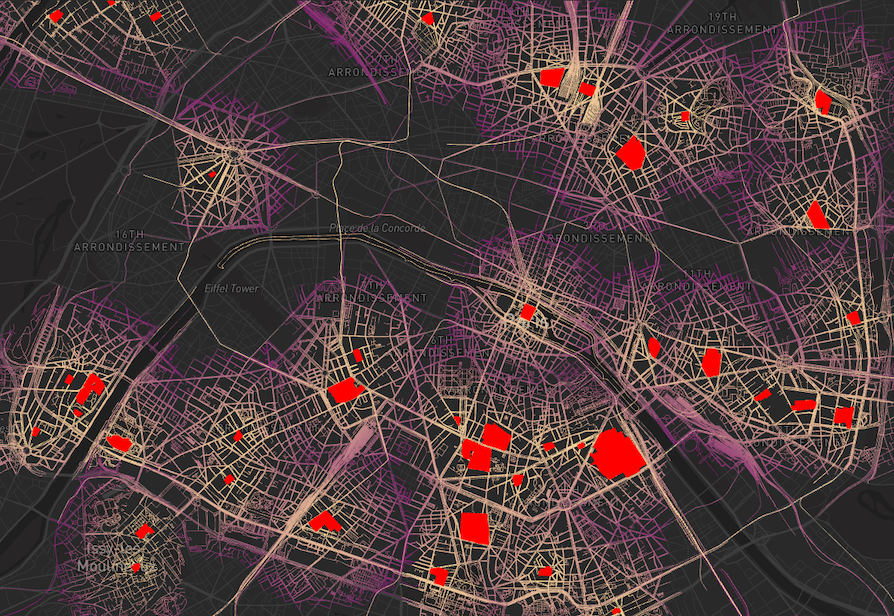
Proximity analysis between Road Networks and Hospitals in Paris.
Joining H3 with GeoJSON
One day I was looking at the DuckDB_H3_Example, and I was struck — what if I joined those cells with Overture Buildings? I learned how to use the DuckDB H3 extension from all of the example UDFs on Fused. So I called that UDF in an Overture UDF and used GeoPandas to join the two. The result is the map below. The color of the buildings comes from the count of corresponding Yellow Cab pickups. There are millions of points in this TLC parquet file, and H3 helped me to aggregate to thousands for an easier spatial join.
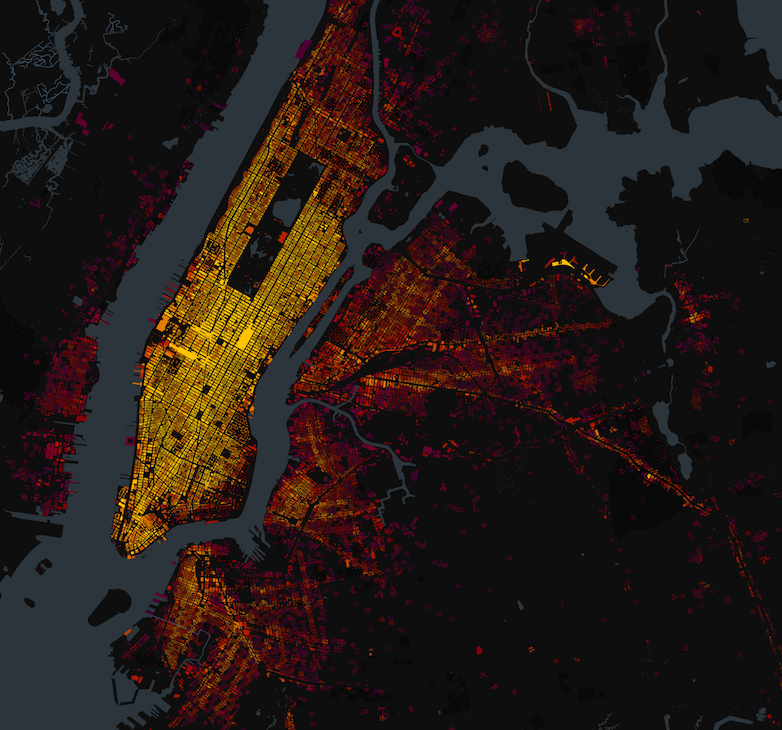
Overture Buildings joined with H3 Yellow Cab pickups in New York City.
I made this particular map with Kepler.gl, with two clicks from the Workbench. I could have also exported the data to tools like Felt and Mapbox. You can find the code I used to recreate this map here.
App Builder
I just started working on the Fused App Builder, and made a dashboard to view and interact with NYC’s 311 call data as a 3D H3 heatmap. Anyone using it can set the date range and resolution to change the display. Very fast and easy to use.
Community
There's so much exciting data science happening on Fused. Check out Kevin Lacaille's post on ML-less global vegetation segmentation at scale. And Christopher Kyed's Analyzing traffic speeds from 100 billion drive records, that is the kind of project I would love to work on.
I continuously find inspiration as I browse community UDFs. Here's a join of H3 heatmaps with Overture types. This is a heatmap of connectors (intersections) joined with segments (roads) in London. The darker colors have more intersections. I am looking to incorporate traffic counts.
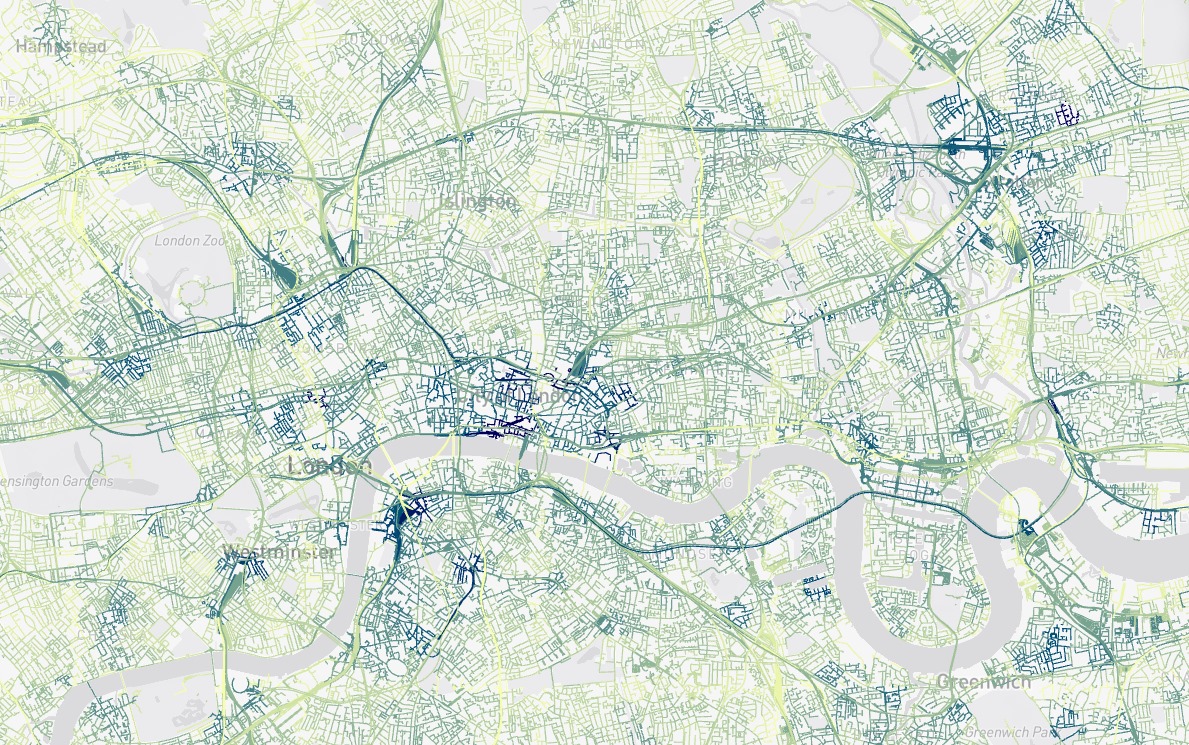
Road density in London.
Conclusion
I have been using Fused for several months but it feels like I am just getting started. It seems like the only real limit here is what I can dream up.
This is a cross-post of Stephen Kent's Medium Article published October 14, 2024.
