How DigitalTwinSim Models Wireless Networks with DuckDB, IBIS, and Fused
Sameer, co-founder of DigitalTwinSim, leads the development of advanced geospatial analysis tools to support the telecom industry in strategic network planning. DigitalTwinSim specializes in using high-resolution data to optimize the placement of network towers ensuring reliable, high-speed connectivity.
In this blog post, Sameer shares how he leverages Ibis with a DuckDB backend, and Fused to model wireless networks at high resolution. This approach enables him to quickly generate network coverage models for his clients. He explains and shares a Fused UDF that processes data in an H3 grid to evaluate optimal locations for network towers.
Check out Sameer's UDF on Workbench here::
Introduction
Broadband Equity Access and Deployment Program provides funding to expand high-speed internet access by funding planning, infrastructure deployment and adoption programs across US. BEAD prioritizes unserved and underserved locations, with a mandate to guarantee 100/20 Mbps service.
Terrestrial fixed wireless technology, utilizing a hybrid of licensed and unlicensed spectrum, is one of the approved technologies for regions where fiber deployment is cost-prohibitive. The Tarana Wireless G1 Platform exemplifies an FWA technology that meets program requirements at a significantly lower cost than fiber.
Since BEAD requires 100/20Mbps service with coverage guarantees, it is critical to model networks accurately to ensure compliance with program standards. We use 7.5 cm resolution data from the Vexcel Data Program to model networks and help our clients meet these requirements.
Modeling networks across large, sparsely populated geographies targeting every building generates massive datasets. Traditional tools like QGIS struggled with interactive filtering of such large datasets. In contrast, Fused allows us to filter, visualize, and share data interactively with clients.
Modeling Methodology
We model wireless networks using an H3 grid at resolution 15, which translates to approximately 0.895m² per cell. This results in about 111 Million H3 cells per 10 km² city area.
Identifying the optimal serving site for each H3 index requires processing 11 million groups, each containing 5-10 rows. Previously, this was done with Pandas and Dask, facing limitations in CPU and memory capacity.
Integrating DuckDB into our workflow has significantly eased these constraints, enabling complex group_by operations on large datasets effortlessly. For example, the following command operates on a parquet folder with hundreds of files representing candidate site locations, helping us identify the best serving site for each H3 cell.
ibis.read_parquet('parquet_folder').agg(by=['h15'], Rx_dBm=_.Rx.dBm.max())
This efficiency is maintained regardless of dataset size or available memory.
Laurens Kuiper's blog post "No Memory? No Problem. External Aggregation in DuckDB", explains DuckDB's approach to scaling up grouped aggregations—an approach that directly supports our work in high-resolution wireless network modeling. By utilizing Fused with DuckDB, we at DigitalTwinSim have harnessed its capabilities to efficiently manage extensive data aggregations, enabling us to scale up projects in both resolution and candidate site counts.
Easy Integrations
Traditionally, we've used QGIS with GeoParquet as our file storage for visualizations. However, the sheer amount of data generated from each site at H3 resolution 15 has made it difficult to filter outputs interactively in QGIS. Fortunately, Fused HTTP endpoints make it easy to dynamically integrate UDFs with QGIS.
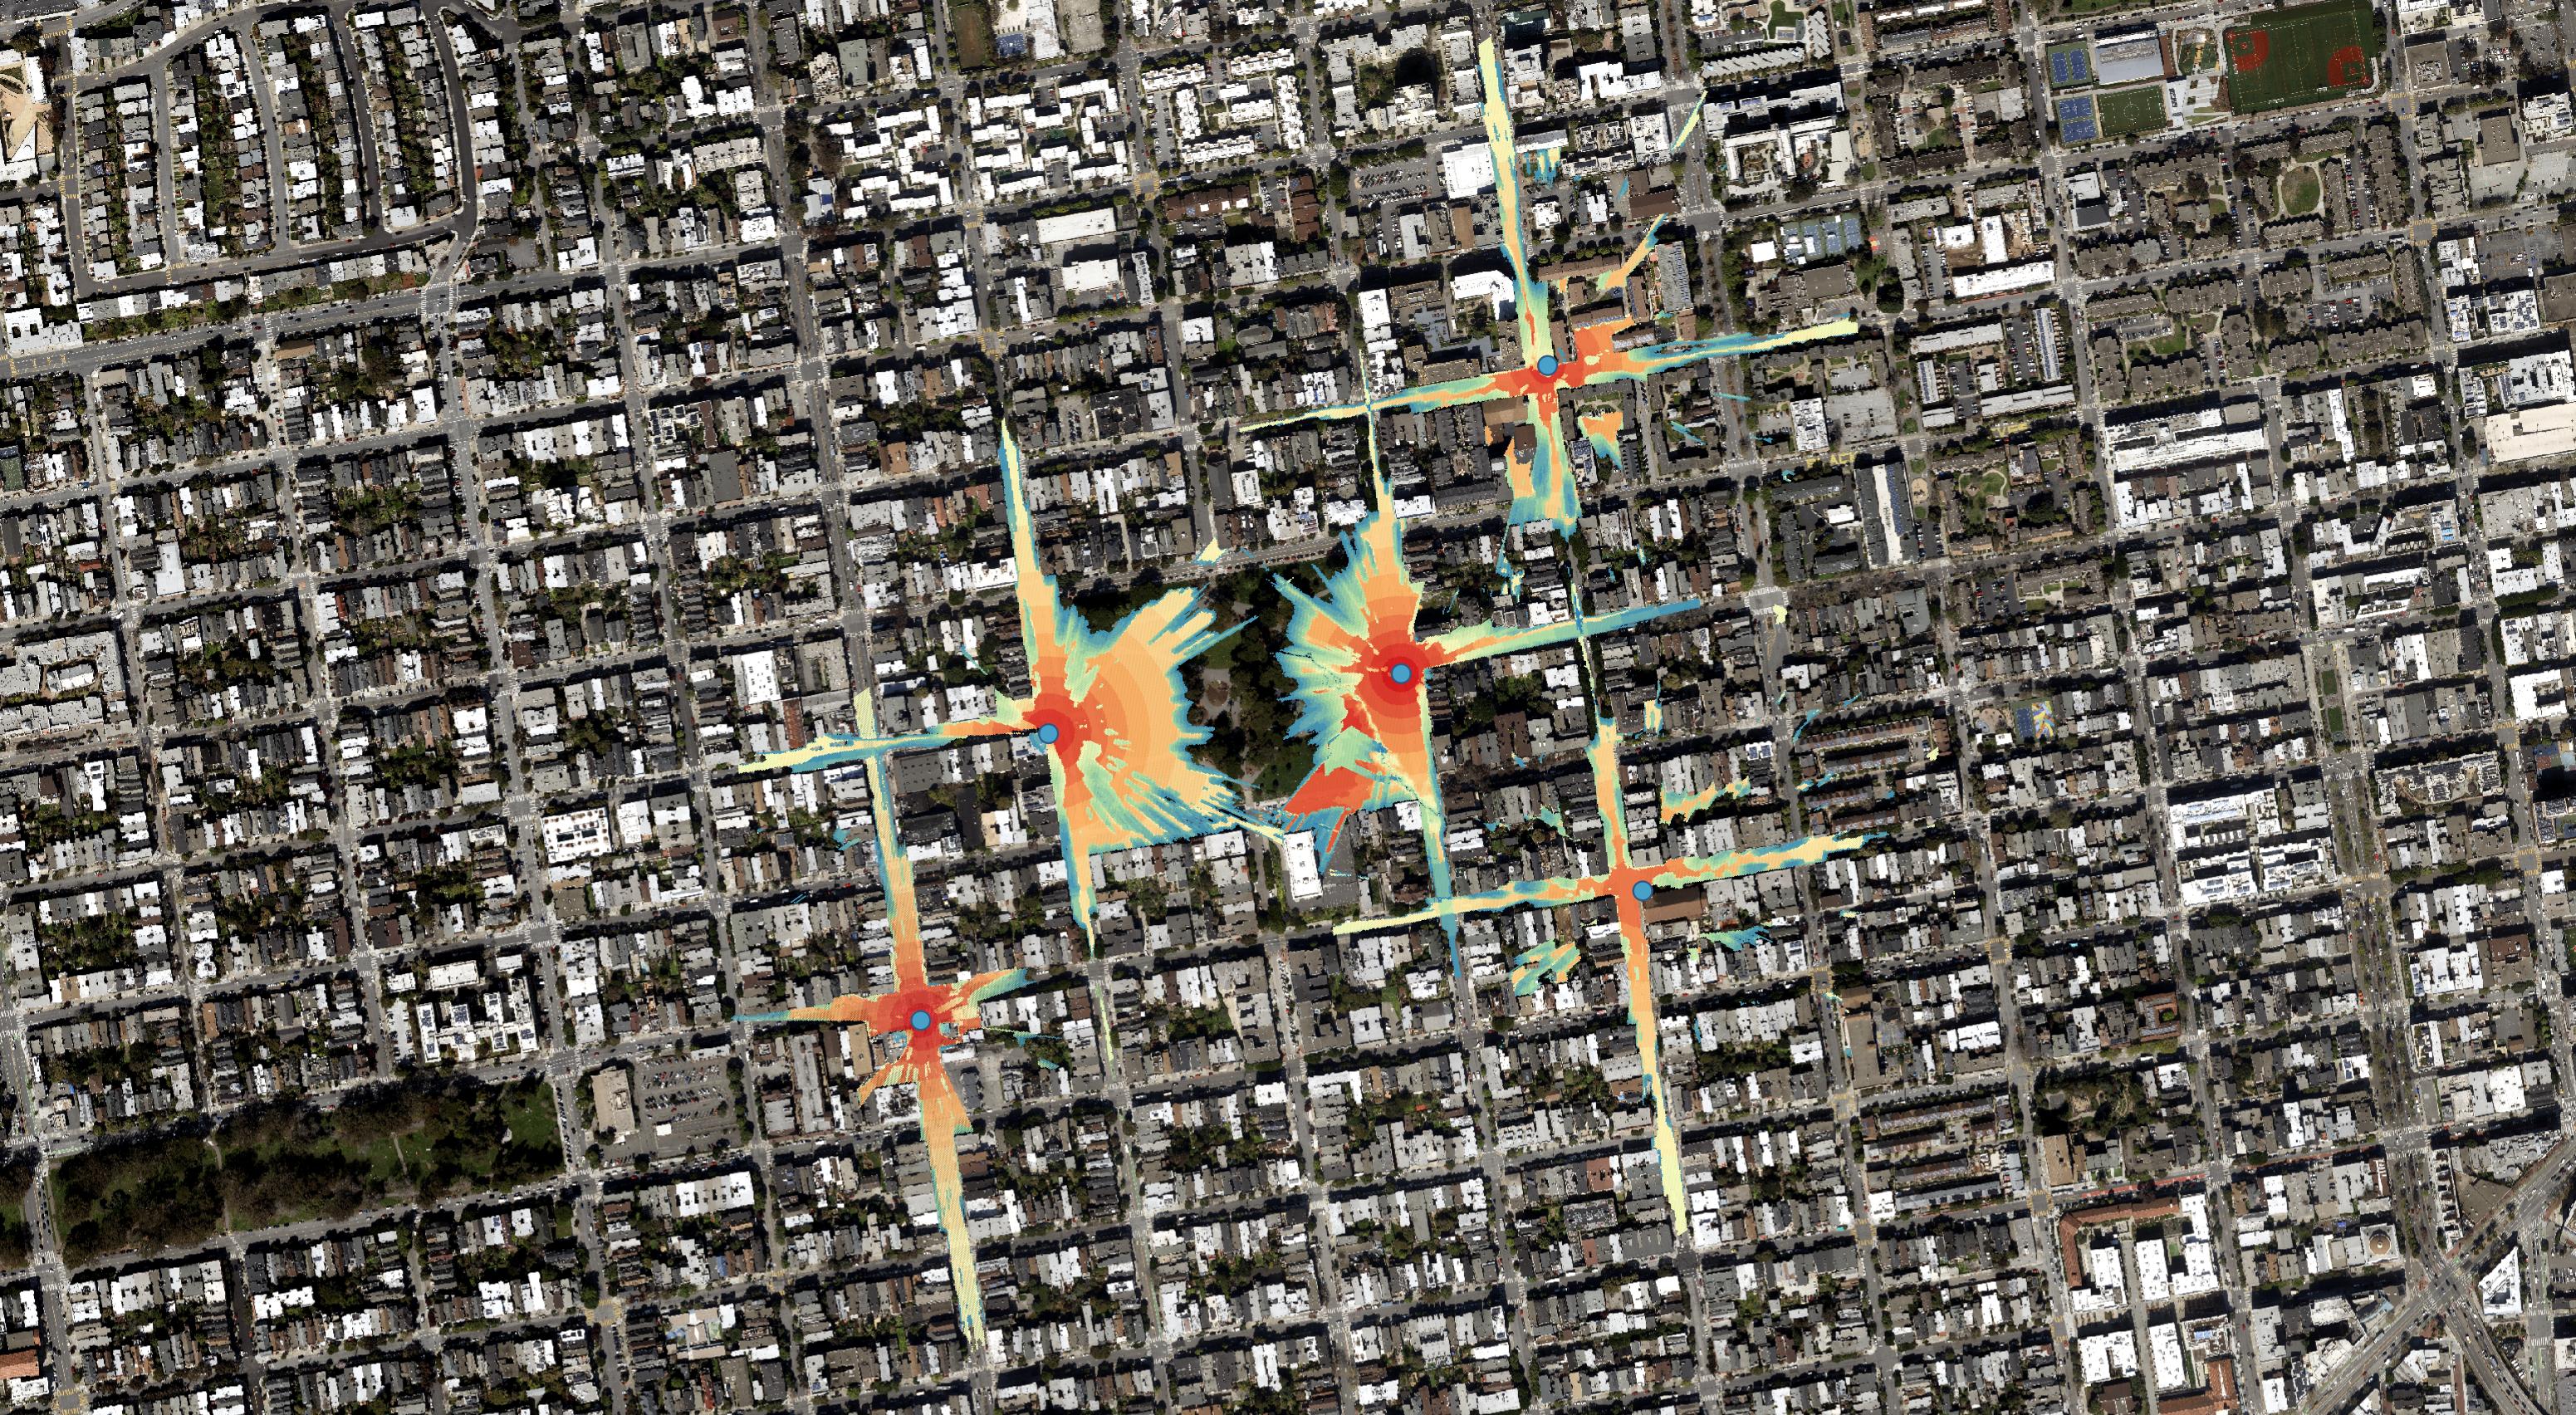
This image shows the output of the UDF for five network nodes rendered in QGIS.

Fused for Interactive Processing With Instant Visualization
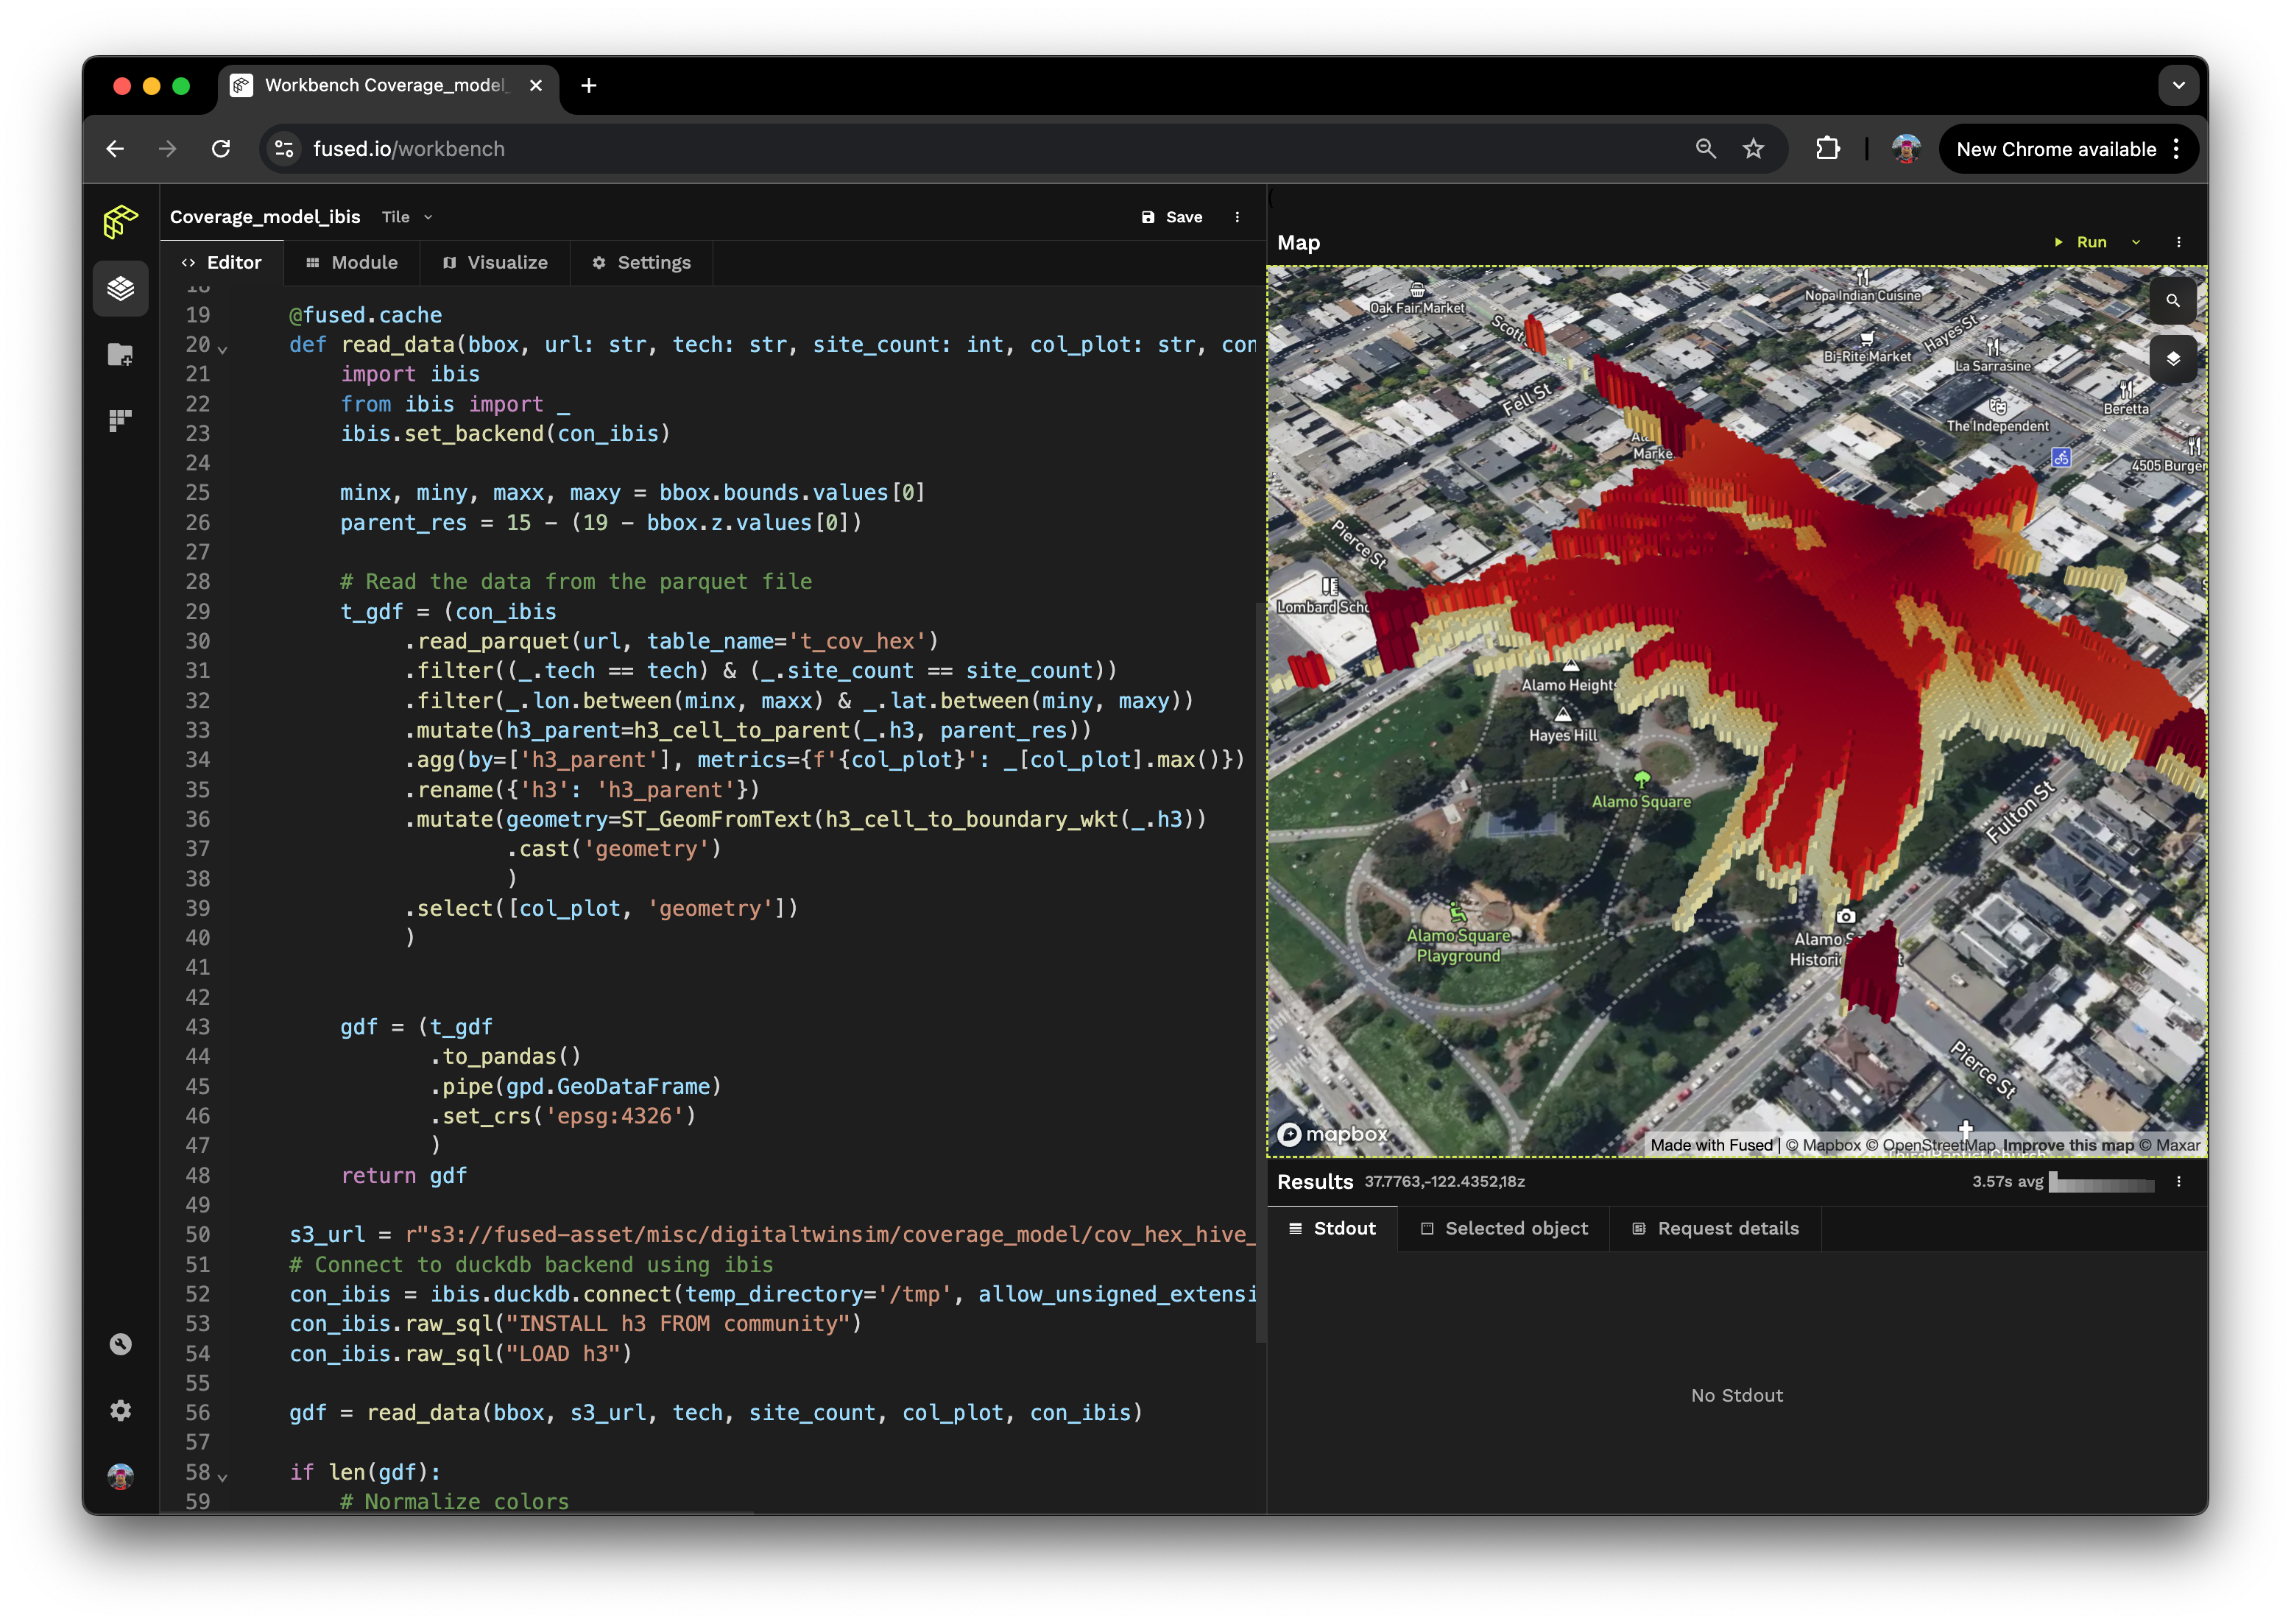
Here, tools like Fused have become essential. Fused allows us to filter and visualize raw output data in a more interactive way, which we can also share with clients to illustrate network design and coverage areas.
To set up the UDF in Fused, we uploaded our data as a Hive-partitioned Parquet folder and created a UDF in Ibis to generate visualizations on demand based on zoom level and area of interest. At higher zoom levels, we compute the parent H3 index and aggregate data to show broader coverage areas; at lower zoom levels, we display individual H3 indices. The H3 polygons are generated and colored dynamically based on the data in the Parquet folder, allowing us to interactively filter data and share visualizations with clients.
Click here to launch the UDF in Fused Workbench.

Conclusion
As network demands grow and requirements for high-speed internet access become more stringent, accurate, high-resolution modeling is essential for effective planning and deployment.
DigitalTwinSim's integration of tools like DuckDB and Fused, alongside Ibis and H3 grids, enables us to tackle the challenges of processing, analyzing, and visualizing massive datasets. By leveraging DuckDB's powerful data aggregation capabilities, we can manage and analyze high-resolution data efficiently, irrespective of memory constraints. Meanwhile, Fused empowers us to deliver interactive, client-ready visualizations, allowing stakeholders to better understand network coverage and performance.
