<?xml version="1.0" encoding="utf-8"?>
<feed xmlns="http://www.w3.org/2005/Atom">
    <id>https://docs-staging.fused.io/pr/532/blog/</id>
    <title>Fused Blog</title>
    <updated>2025-04-08T00:00:00.000Z</updated>
    <generator>https://github.com/jpmonette/feed</generator>
    <link rel="alternate" href="https://docs-staging.fused.io/pr/532/blog/"/>
    <subtitle>Fused Blog</subtitle>
    <icon>https://docs-staging.fused.io/pr/532/img/favicon.png</icon>
    <entry>
        <title type="html"><![CDATA[Fused featured in Maxar TED Talk]]></title>
        <id>https://docs-staging.fused.io/pr/532/blog/fused-powering-maxar/</id>
        <link href="https://docs-staging.fused.io/pr/532/blog/fused-powering-maxar/"/>
        <updated>2025-04-08T00:00:00.000Z</updated>
        <summary type="html"><![CDATA[Fused Powering Maxar]]></summary>
        <content type="html"><![CDATA[<p><img decoding="async" loading="lazy" alt="Fused Powering Maxar" src="https://docs-staging.fused.io/pr/532/assets/images/TED_Fused_Maxar-8a7aa2b11582bc2c38cfdb96eba9e9e6.png" width="2283" height="1239" class="img_ev3q"></p>
<p>Fused is excited to be featured in a <a href="https://conferences.ted.com/ted2025/program#day-73697" target="_blank" rel="noopener noreferrer">TED Talk today</a> by Peter Wilczynski, CPO at Maxar, which explored a multi-source site monitoring scenario of Vancouver's greening initiatives over the past five years powered by the Fused platform.</p>
<!-- -->
<p><img decoding="async" loading="lazy" alt="Fused Maxar Workbench" src="https://docs-staging.fused.io/pr/532/assets/images/fused_maxar_workbench-8362c81fd188bc31c25113e492134b89.png" width="1243" height="705" class="img_ev3q"></p>
<p>Site monitoring scenarios are at their most effective when data from disparate sources is combined—from satellite imagery and map data to municipal and demographic data. Analytics today requires bringing all these different sources of data together: from raw pixels to contextual intelligence — in real-time, seamlessly, and at scale.</p>
<p>This is an iterative process, each dataset being in its own format &amp; hosted on different cloud providers, updated independently and on different schedules.</p>
<p>Fused is built by <a href="https://docs-staging.fused.io/pr/532/blog/why-fused/">data scientists, engineers &amp; open source contributors</a> who know the reality of building pipelines with breaking changes in libraries, new file formats that require rethinking how data is ingested and business requirements that constantly change.</p>
<p>We firmly believe we need tools that help us bring as many datasets together as possible, especially in a world where LLMs and AI can increasingly <a href="https://docs-staging.fused.io/pr/532/blog/announcing-fused-ai-builder/">talk directly to data</a>.</p>
<p>If you’d like to try out an instance of the Fused workbench with pre-loaded data from Maxar later this month, which Peter demoed on screen, sign up for the waitlist on <a href="https://fused.maxar.com/" target="_blank" rel="noopener noreferrer">fused.maxar.com</a> to get access and see for yourself this is more than a pre-recorded tech demo!</p>]]></content>
        <author>
            <name>Isaac Brodsky</name>
            <uri>https://www.linkedin.com/in/isaacbrodsky/</uri>
        </author>
        <author>
            <name>Sina Kashuk</name>
            <uri>https://www.linkedin.com/in/skashuk/</uri>
        </author>
        <category label="fused" term="fused"/>
        <category label="workbench" term="workbench"/>
        <category label="announcement" term="announcement"/>
        <category label="ai-builder" term="ai-builder"/>
    </entry>
    <entry>
        <title type="html"><![CDATA[Announcing Fused AI Builder]]></title>
        <id>https://docs-staging.fused.io/pr/532/blog/announcing-fused-ai-builder/</id>
        <link href="https://docs-staging.fused.io/pr/532/blog/announcing-fused-ai-builder/"/>
        <updated>2025-04-01T00:00:00.000Z</updated>
        <summary type="html"><![CDATA[Fused AI Builder let's you create LLM Agents that can directly call & execute deployed Python code through Fused UDFs!]]></summary>
        <content type="html"><![CDATA[<p><strong>Fused AI Builder let's you create LLM Agents that can directly call &amp; execute deployed Python code through <a href="https://docs-staging.fused.io/pr/532/core-concepts/write/">Fused UDFs</a>!</strong></p>
<h3 class="anchor anchorWithStickyNavbar_LWe7" id="give-llms-the-ability-the-talk-to-your-data--code">Give LLMs the ability the talk to your data &amp; code<a href="https://docs-staging.fused.io/pr/532/blog/announcing-fused-ai-builder/#give-llms-the-ability-the-talk-to-your-data--code" class="hash-link" aria-label="Direct link to Give LLMs the ability the talk to your data &amp; code" title="Direct link to Give LLMs the ability the talk to your data &amp; code">​</a></h3>
<p>We're launching Fused AI Builder, a simple way for you to give an LLM access to any UDF you want</p>
<!-- -->
<div style="height:360px;width:100%" class="video__player"></div>
<!-- -->
<h3 class="anchor anchorWithStickyNavbar_LWe7" id="fused-udfs-meets-mcp-server">Fused UDFs meets MCP Server<a href="https://docs-staging.fused.io/pr/532/blog/announcing-fused-ai-builder/#fused-udfs-meets-mcp-server" class="hash-link" aria-label="Direct link to Fused UDFs meets MCP Server" title="Direct link to Fused UDFs meets MCP Server">​</a></h3>
<p><a href="https://modelcontextprotocol.io/introduction" target="_blank" rel="noopener noreferrer">MCP (Modal Context Protocol) Servers</a> allow Large Language Models like Claude or ChatGPT to directly make HTTP queries. This means they can now access APIs and make all sorts of calls.</p>
<p>But a lot of the internet still doesn't have APIs, be it a new dataset you just discovered that's hosted on an FTP server or data on an S3 bucket that needs some processing before it's useful.</p>
<p>That's where Fused UDFs come into play. UDFs allow you to write Python code that can be executed from anywhere, and more importantly called from anywhere.</p>
<p><img decoding="async" loading="lazy" alt="Fused + MCP Diagram" src="https://docs-staging.fused.io/pr/532/assets/images/Fused_AI_Builder_graph-970aec2d589988f2ab0374db1a9da784.png" width="1424" height="800" class="img_ev3q"></p>
<p>By using UDFs with MCP Server you can now easily write any Python code and allow a LLM like Antrophic's Claude to execute it &amp; use its output.</p>
<div style="max-width:600px;margin:0 auto"><div style="width:100%;height:360px" class="video__player" alignitems="center"></div></div>
<h3 class="anchor anchorWithStickyNavbar_LWe7" id="data-python--llms-all-in-one">Data, Python &amp; LLMs all in one<a href="https://docs-staging.fused.io/pr/532/blog/announcing-fused-ai-builder/#data-python--llms-all-in-one" class="hash-link" aria-label="Direct link to Data, Python &amp; LLMs all in one" title="Direct link to Data, Python &amp; LLMs all in one">​</a></h3>
<p>You can now use LLM + Fused UDFs to do a whole host of tasks:</p>
<!-- -->
<div class="tabs-container tabList__CuJ"><ul role="tablist" aria-orientation="horizontal" class="tabs unique-tabs"><li role="tab" tabindex="0" aria-selected="true" class="tabs__item tabItem_LNqP tabs__item--active">Internet Speed of any location</li><li role="tab" tabindex="-1" aria-selected="false" class="tabs__item tabItem_LNqP">Creating a Three.js website</li><li role="tab" tabindex="-1" aria-selected="false" class="tabs__item tabItem_LNqP">Combining Data</li></ul><div class="margin-top--md"><div role="tabpanel" class="tabItem_Ymn6"><div style="height:360px;width:100%" class="video__player"></div></div><div role="tabpanel" class="tabItem_Ymn6" hidden=""><div style="height:360px;width:100%" class="video__player"></div></div><div role="tabpanel" class="tabItem_Ymn6" hidden=""><p>🚧 This section is under construction. Our non-AI Agents are still working on this 🚧</p></div></div></div>]]></content>
        <author>
            <name>Max Lenormand</name>
            <uri>https://www.linkedin.com/in/maxime-lenormand-b94640107/</uri>
        </author>
        <category label="fused" term="fused"/>
        <category label="workbench" term="workbench"/>
        <category label="announcement" term="announcement"/>
        <category label="ai-builder" term="ai-builder"/>
        <category label="agents" term="agents"/>
    </entry>
    <entry>
        <title type="html"><![CDATA[Announcing Fused 2.0]]></title>
        <id>https://docs-staging.fused.io/pr/532/blog/announcing-fused-2-0/</id>
        <link href="https://docs-staging.fused.io/pr/532/blog/announcing-fused-2-0/"/>
        <updated>2025-02-25T00:00:00.000Z</updated>
        <summary type="html"><![CDATA[Fused 2.0 is our biggest update to date, with changes across Workbench & fused-py!]]></summary>
        <content type="html"><![CDATA[<p><strong>Fused 2.0 is our biggest update to date, with changes across Workbench &amp; <code>fused-py</code>!</strong></p>
<h3 class="anchor anchorWithStickyNavbar_LWe7" id="a-new-udf-editor-in-workbench">A New UDF Editor in Workbench<a href="https://docs-staging.fused.io/pr/532/blog/announcing-fused-2-0/#a-new-udf-editor-in-workbench" class="hash-link" aria-label="Direct link to A New UDF Editor in Workbench" title="Direct link to A New UDF Editor in Workbench">​</a></h3>
<p><img decoding="async" loading="lazy" alt="New Fused Workbench" src="https://docs-staging.fused.io/pr/532/assets/images/new_ui-dc5c99d8f202980e48d540526d943fcf.png" width="3452" height="1970" class="img_ev3q"></p>
<!-- -->
<h4 class="anchor anchorWithStickyNavbar_LWe7" id="introducing-collections-a-simple-way-to-organize-your-udfs">Introducing Collections: A simple way to organize your UDFs<a href="https://docs-staging.fused.io/pr/532/blog/announcing-fused-2-0/#introducing-collections-a-simple-way-to-organize-your-udfs" class="hash-link" aria-label="Direct link to Introducing Collections: A simple way to organize your UDFs" title="Direct link to Introducing Collections: A simple way to organize your UDFs">​</a></h4>
<p>Collections now allows you to organize your UDFs together as you work on different projects, save them together and keep your editor focused on the project at hand.</p>
<div style="width:100%;height:100%" class="video__player"></div>
<div class="theme-admonition theme-admonition-note admonition_xJq3 alert alert--secondary"><div class="admonitionHeading_Gvgb"><span class="admonitionIcon_Rf37"><svg viewBox="0 0 14 16"><path fill-rule="evenodd" d="M6.3 5.69a.942.942 0 0 1-.28-.7c0-.28.09-.52.28-.7.19-.18.42-.28.7-.28.28 0 .52.09.7.28.18.19.28.42.28.7 0 .28-.09.52-.28.7a1 1 0 0 1-.7.3c-.28 0-.52-.11-.7-.3zM8 7.99c-.02-.25-.11-.48-.31-.69-.2-.19-.42-.3-.69-.31H6c-.27.02-.48.13-.69.31-.2.2-.3.44-.31.69h1v3c.02.27.11.5.31.69.2.2.42.31.69.31h1c.27 0 .48-.11.69-.31.2-.19.3-.42.31-.69H8V7.98v.01zM7 2.3c-3.14 0-5.7 2.54-5.7 5.68 0 3.14 2.56 5.7 5.7 5.7s5.7-2.55 5.7-5.7c0-3.15-2.56-5.69-5.7-5.69v.01zM7 .98c3.86 0 7 3.14 7 7s-3.14 7-7 7-7-3.12-7-7 3.14-7 7-7z"></path></svg></span>note</div><div class="admonitionContent_BuS1"><p>Collection is still in early access so you need to enable it under "Preferences -&gt; Enable UDF Collections [Beta]" to access it</p></div></div>
<h4 class="anchor anchorWithStickyNavbar_LWe7" id="redesigned-udf-editor">Redesigned UDF Editor<a href="https://docs-staging.fused.io/pr/532/blog/announcing-fused-2-0/#redesigned-udf-editor" class="hash-link" aria-label="Direct link to Redesigned UDF Editor" title="Direct link to Redesigned UDF Editor">​</a></h4>
<p>UDF Editor now comes with a host of new features &amp; redesigned UI:</p>
<ul>
<li>Adding a new Full Screen Map View</li>
<li>The Visualize Tab is now under the UDF expanded parameters, allowing you to hide your Code Editor and just focus on tweaking the visualization of your data</li>
<li>Split screen "Editor" &amp; "Module" on top of each other: Keeping your code clean in the main "Editor" Tab is now easier by moving functions under the "Module" tab.</li>
</ul>
<!-- -->
<h4 class="anchor anchorWithStickyNavbar_LWe7" id="a-new-share-page">A New Share Page<a href="https://docs-staging.fused.io/pr/532/blog/announcing-fused-2-0/#a-new-share-page" class="hash-link" aria-label="Direct link to A New Share Page" title="Direct link to A New Share Page">​</a></h4>
<p>We've moved all the tools &amp; information you need to easily share your UDFs into a dedicated page (and button). You can easily:</p>
<ul>
<li>Create a token to share your UDFs</li>
<li>Edit the Description, Tags &amp; Image preview of your UDFs</li>
</ul>
<div style="width:100%;height:100%" class="video__player"></div>
<h3 class="anchor anchorWithStickyNavbar_LWe7" id="changes-to-fused-py">Changes to <code>fused-py</code><a href="https://docs-staging.fused.io/pr/532/blog/announcing-fused-2-0/#changes-to-fused-py" class="hash-link" aria-label="Direct link to changes-to-fused-py" title="Direct link to changes-to-fused-py">​</a></h3>
<p>Our Python library <code>fused-py</code> is getting some updates to make processing data in Python simpler, from a small one time task to processing huge datasets</p>
<h4 class="anchor anchorWithStickyNavbar_LWe7" id="simplifying-how-fused-handles-geometries">Simplifying how Fused handles geometries<a href="https://docs-staging.fused.io/pr/532/blog/announcing-fused-2-0/#simplifying-how-fused-handles-geometries" class="hash-link" aria-label="Direct link to Simplifying how Fused handles geometries" title="Direct link to Simplifying how Fused handles geometries">​</a></h4>
<ul>
<li>Moving away from Fused having <a href="https://docs-staging.fused.io/pr/532/core-concepts/filetile/#legacy-types">many different <code>fused.types</code></a> to only having 2 simple types: <a href="https://docs-staging.fused.io/pr/532/core-concepts/filetile/#fusedtypesbounds"><code>fused.types.Bounds</code></a> and <a href="https://docs-staging.fused.io/pr/532/core-concepts/filetile/#fusedtypestile"><code>fused.types.Tile</code></a>.</li>
<li>Replacing <code>bbox</code> object with <a href="https://docs-staging.fused.io/pr/532/core-concepts/filetile/#the-bounds-object"><code>bounds</code></a>: a more generic term to pass geometries to UDFs</li>
</ul>
<h4 class="anchor anchorWithStickyNavbar_LWe7" id="fusedsubmit-for-simple-multi-job-runs"><a href="https://docs-staging.fused.io/pr/532/core-concepts/run-udfs/run-small-udfs/#running-multiple-jobs-in-parallel"><code>fused.submit()</code></a> for simple, multi job runs<a href="https://docs-staging.fused.io/pr/532/blog/announcing-fused-2-0/#fusedsubmit-for-simple-multi-job-runs" class="hash-link" aria-label="Direct link to fusedsubmit-for-simple-multi-job-runs" title="Direct link to fusedsubmit-for-simple-multi-job-runs">​</a></h4>
<p>We're introducing <code>fused.submit()</code> as a simple way to run many UDFs all at once in parallel</p>
<p><img decoding="async" loading="lazy" alt="fused.submit() demo" src="https://docs-staging.fused.io/pr/532/assets/images/fused-submit-demo-177a79810cfb2cc7c54504684bae6b7d.png" width="1236" height="744" class="img_ev3q"></p>
<p>This can significantly speed up parallel tasks like:</p>
<ul>
<li>Fetching lots of individual data points from an API</li>
<li>Scaling small processing steps to lots of data points</li>
</ul>
<h4 class="anchor anchorWithStickyNavbar_LWe7" id="improved-caching">Improved caching<a href="https://docs-staging.fused.io/pr/532/blog/announcing-fused-2-0/#improved-caching" class="hash-link" aria-label="Direct link to Improved caching" title="Direct link to Improved caching">​</a></h4>
<p>Under the hood we've significantly improved how Fused caches results of recurring UDFs &amp; cached functions + we've introduced new tools for developers to control caching:</p>
<ul>
<li>A default 90 days cache time for all UDFs</li>
<li>Editing the cache duration with the new <a href="https://docs-staging.fused.io/pr/532/core-concepts/cache/#defining-your-cache-lifetime-cache_max_age"><code>cache_max_age</code> argument</a></li>
</ul>
<p><a href="https://docs-staging.fused.io/pr/532/core-concepts/cache/">Read more about Caching</a></p>
<h3 class="anchor anchorWithStickyNavbar_LWe7" id="full-fused-20-changelog">Full Fused 2.0 Changelog<a href="https://docs-staging.fused.io/pr/532/blog/announcing-fused-2-0/#full-fused-20-changelog" class="hash-link" aria-label="Direct link to Full Fused 2.0 Changelog" title="Direct link to Full Fused 2.0 Changelog">​</a></h3>
<p><a href="https://docs-staging.fused.io/pr/532/python-sdk/changelog/#v1140-2025-02-25">Read our Changelog</a> to see every change happening with Fused 2.0</p>]]></content>
        <author>
            <name>Max Lenormand</name>
            <uri>https://www.linkedin.com/in/maxime-lenormand-b94640107/</uri>
        </author>
        <category label="fused" term="fused"/>
        <category label="workbench" term="workbench"/>
        <category label="announcement" term="announcement"/>
    </entry>
    <entry>
        <title type="html"><![CDATA[Enhance your data with GERS IDs]]></title>
        <id>https://docs-staging.fused.io/pr/532/blog/enhance-your-data-with-gers-ids/</id>
        <link href="https://docs-staging.fused.io/pr/532/blog/enhance-your-data-with-gers-ids/"/>
        <updated>2025-02-18T00:00:00.000Z</updated>
        <summary type="html"><![CDATA[TL;DR Enriching your spatial data with GERS IDs can make it interoperable across the data ecosystem. You can use Fused UDFs to create custom HTTP endpoints to enrich your data with GERS.]]></summary>
        <content type="html"><![CDATA[<p><strong>TL;DR Enriching your spatial data with GERS IDs can make it interoperable across the data ecosystem. You can use Fused UDFs to create custom HTTP endpoints to enrich your data with GERS.</strong></p>
<p>The <a href="https://docs.overturemaps.org/gers/" target="_blank" rel="noopener noreferrer">Global Entity Reference System (GERS)</a> is a framework that structures, encodes, and matches map data to a shared universal reference within Overture. GERS helps organizations identify and reference their own datasets with standard identifiers to Overture data to help unify datasets.</p>
<!-- -->
<div style="width:100%;height:100%" class="video__player"></div>
<p><br>
<!-- -->In this blog post we show how to create simple endpoints with Fused UDFs to enrich a dataset with GERS IDs. We'll use the <a href="https://docs.overturemaps.org/guides/buildings/#14/32.58453/-117.05154/0/60" target="_blank" rel="noopener noreferrer">Overture Building footprints</a> to first enrich a polygon with GERS IDs then another one to look-up metadata for a specified GERS ID.</p>
<!-- -->
<h2 class="anchor anchorWithStickyNavbar_LWe7" id="the-benefit-of-gers">The benefit of GERS<a href="https://docs-staging.fused.io/pr/532/blog/enhance-your-data-with-gers-ids/#the-benefit-of-gers" class="hash-link" aria-label="Direct link to The benefit of GERS" title="Direct link to The benefit of GERS">​</a></h2>
<p>When third-party dataset is spatially matched to an Overture feature it's "enriched" with that feature's GERS ID and becomes "GERS-enabled". This makes it easy to associate it by ID to any other GERS-enabled dataset.</p>
<div class="codeBlockContainer_Ckt0 theme-code-block" style="--prism-background-color:hsl(220, 13%, 18%);--prism-color:hsl(220, 14%, 71%)"><div class="codeBlockContent_biex"><pre tabindex="0" class="prism-code language-text codeBlock_bY9V thin-scrollbar" style="background-color:hsl(220, 13%, 18%);color:hsl(220, 14%, 71%);text-shadow:0 1px rgba(0, 0, 0, 0.3)"><code class="codeBlockLines_e6Vv"><span class="token-line" style="color:hsl(220, 14%, 71%);text-shadow:0 1px rgba(0, 0, 0, 0.3)"><span class="token plain">                            gers_id             buliding_name</span><br></span><span class="token-line" style="color:hsl(220, 14%, 71%);text-shadow:0 1px rgba(0, 0, 0, 0.3)"><span class="token plain">0  08b2a1072534cfff020018b8a6efde22  James A. Farley Building</span><br></span><span class="token-line" style="color:hsl(220, 14%, 71%);text-shadow:0 1px rgba(0, 0, 0, 0.3)"><span class="token plain">1  08b2a100d2cb6fff02000821de8bdff1      Pennsylvania Station</span><br></span></code></pre><div class="buttonGroup__atx"><button type="button" aria-label="Copy code to clipboard" title="Copy" class="clean-btn"><span class="copyButtonIcons_eSgA" aria-hidden="true"><svg viewBox="0 0 24 24" class="copyButtonIcon_y97N"><path fill="currentColor" d="M19,21H8V7H19M19,5H8A2,2 0 0,0 6,7V21A2,2 0 0,0 8,23H19A2,2 0 0,0 21,21V7A2,2 0 0,0 19,5M16,1H4A2,2 0 0,0 2,3V17H4V3H16V1Z"></path></svg><svg viewBox="0 0 24 24" class="copyButtonSuccessIcon_LjdS"><path fill="currentColor" d="M21,7L9,19L3.5,13.5L4.91,12.09L9,16.17L19.59,5.59L21,7Z"></path></svg></span></button></div></div></div>
<p>For example, a municipal government with a dataset of building footprints for local offices, coffee shops, and museums could match those entities to a GERS ID. This would enable the government to easily join its data other "GERS-enabled" datasets to enrich them with additional information such as insurance data, historical property values, restaurant reviews, fire risk, or rooftop solar potential.</p>
<h2 class="anchor anchorWithStickyNavbar_LWe7" id="create-a-udf-to-enrich-a-polygon-with-gers-ids">Create a UDF to enrich a polygon with GERS IDs<a href="https://docs-staging.fused.io/pr/532/blog/enhance-your-data-with-gers-ids/#create-a-udf-to-enrich-a-polygon-with-gers-ids" class="hash-link" aria-label="Direct link to Create a UDF to enrich a polygon with GERS IDs" title="Direct link to Create a UDF to enrich a polygon with GERS IDs">​</a></h2>
<p>We can create a UDF that takes in a polygon and returns a GERS ID. This UDF will spatially match the polygon to Overture Buildings and return the GERS ID of the building that intersects the polygon. This is useful for enriching a dataset with GERS IDs.</p>
<p>Users can design and preview the workflow interactively, allowing them to test assumptions and visualize their effect. Parameters can be adjusted, and the output can be previewed before running the UDF on the entire dataset.</p>
<div class="language-python codeBlockContainer_Ckt0 theme-code-block" style="--prism-background-color:hsl(220, 13%, 18%);--prism-color:hsl(220, 14%, 71%)"><div class="codeBlockContent_biex"><pre tabindex="0" class="prism-code language-python codeBlock_bY9V thin-scrollbar" style="background-color:hsl(220, 13%, 18%);color:hsl(220, 14%, 71%);text-shadow:0 1px rgba(0, 0, 0, 0.3)"><code class="codeBlockLines_e6Vv codeBlockLinesWithNumbering_o6Pm"><span class="token-line codeLine_lJS_" style="color:hsl(220, 14%, 71%);text-shadow:0 1px rgba(0, 0, 0, 0.3)"><span class="codeLineNumber_Tfdd"></span><span class="codeLineContent_feaV"><span class="token keyword" style="color:hsl(286, 60%, 67%)">import</span><span class="token plain"> json</span></span><br></span><span class="token-line codeLine_lJS_" style="color:hsl(220, 14%, 71%);text-shadow:0 1px rgba(0, 0, 0, 0.3)"><span class="codeLineNumber_Tfdd"></span><span class="codeLineContent_feaV"><span class="token plain" style="display:inline-block"></span></span><br></span><span class="token-line codeLine_lJS_" style="color:hsl(220, 14%, 71%);text-shadow:0 1px rgba(0, 0, 0, 0.3)"><span class="codeLineNumber_Tfdd"></span><span class="codeLineContent_feaV"><span class="token plain">aoi </span><span class="token operator" style="color:hsl(207, 82%, 66%)">=</span><span class="token plain"> json</span><span class="token punctuation" style="color:hsl(220, 14%, 71%)">.</span><span class="token plain">dumps</span><span class="token punctuation" style="color:hsl(220, 14%, 71%)">(</span><span class="token punctuation" style="color:hsl(220, 14%, 71%)">{</span><span class="token string" style="color:hsl(95, 38%, 62%)">"type"</span><span class="token punctuation" style="color:hsl(220, 14%, 71%)">:</span><span class="token string" style="color:hsl(95, 38%, 62%)">"FeatureCollection"</span><span class="token punctuation" style="color:hsl(220, 14%, 71%)">,</span><span class="token string" style="color:hsl(95, 38%, 62%)">"features"</span><span class="token punctuation" style="color:hsl(220, 14%, 71%)">:</span><span class="token punctuation" style="color:hsl(220, 14%, 71%)">[</span><span class="token punctuation" style="color:hsl(220, 14%, 71%)">{</span><span class="token string" style="color:hsl(95, 38%, 62%)">"type"</span><span class="token punctuation" style="color:hsl(220, 14%, 71%)">:</span><span class="token string" style="color:hsl(95, 38%, 62%)">"Feature"</span><span class="token punctuation" style="color:hsl(220, 14%, 71%)">,</span><span class="token string" style="color:hsl(95, 38%, 62%)">"properties"</span><span class="token punctuation" style="color:hsl(220, 14%, 71%)">:</span><span class="token punctuation" style="color:hsl(220, 14%, 71%)">{</span><span class="token punctuation" style="color:hsl(220, 14%, 71%)">}</span><span class="token punctuation" style="color:hsl(220, 14%, 71%)">,</span><span class="token string" style="color:hsl(95, 38%, 62%)">"geometry"</span><span class="token punctuation" style="color:hsl(220, 14%, 71%)">:</span><span class="token punctuation" style="color:hsl(220, 14%, 71%)">{</span><span class="token string" style="color:hsl(95, 38%, 62%)">"coordinates"</span><span class="token punctuation" style="color:hsl(220, 14%, 71%)">:</span><span class="token punctuation" style="color:hsl(220, 14%, 71%)">[</span><span class="token punctuation" style="color:hsl(220, 14%, 71%)">[</span><span class="token punctuation" style="color:hsl(220, 14%, 71%)">[</span><span class="token operator" style="color:hsl(207, 82%, 66%)">-</span><span class="token number" style="color:hsl(29, 54%, 61%)">73.9945443706057</span><span class="token punctuation" style="color:hsl(220, 14%, 71%)">,</span><span class="token number" style="color:hsl(29, 54%, 61%)">40.751205998161026</span><span class="token punctuation" style="color:hsl(220, 14%, 71%)">]</span><span class="token punctuation" style="color:hsl(220, 14%, 71%)">,</span><span class="token punctuation" style="color:hsl(220, 14%, 71%)">[</span><span class="token operator" style="color:hsl(207, 82%, 66%)">-</span><span class="token number" style="color:hsl(29, 54%, 61%)">73.9945443706057</span><span class="token punctuation" style="color:hsl(220, 14%, 71%)">,</span><span class="token number" style="color:hsl(29, 54%, 61%)">40.749882643934455</span><span class="token punctuation" style="color:hsl(220, 14%, 71%)">]</span><span class="token punctuation" style="color:hsl(220, 14%, 71%)">,</span><span class="token punctuation" style="color:hsl(220, 14%, 71%)">[</span><span class="token operator" style="color:hsl(207, 82%, 66%)">-</span><span class="token number" style="color:hsl(29, 54%, 61%)">73.99222917395902</span><span class="token punctuation" style="color:hsl(220, 14%, 71%)">,</span><span class="token number" style="color:hsl(29, 54%, 61%)">40.749882643934455</span><span class="token punctuation" style="color:hsl(220, 14%, 71%)">]</span><span class="token punctuation" style="color:hsl(220, 14%, 71%)">,</span><span class="token punctuation" style="color:hsl(220, 14%, 71%)">[</span><span class="token operator" style="color:hsl(207, 82%, 66%)">-</span><span class="token number" style="color:hsl(29, 54%, 61%)">73.99222917395902</span><span class="token punctuation" style="color:hsl(220, 14%, 71%)">,</span><span class="token number" style="color:hsl(29, 54%, 61%)">40.751205998161026</span><span class="token punctuation" style="color:hsl(220, 14%, 71%)">]</span><span class="token punctuation" style="color:hsl(220, 14%, 71%)">,</span><span class="token punctuation" style="color:hsl(220, 14%, 71%)">[</span><span class="token operator" style="color:hsl(207, 82%, 66%)">-</span><span class="token number" style="color:hsl(29, 54%, 61%)">73.9945443706057</span><span class="token punctuation" style="color:hsl(220, 14%, 71%)">,</span><span class="token number" style="color:hsl(29, 54%, 61%)">40.751205998161026</span><span class="token punctuation" style="color:hsl(220, 14%, 71%)">]</span><span class="token punctuation" style="color:hsl(220, 14%, 71%)">]</span><span class="token punctuation" style="color:hsl(220, 14%, 71%)">]</span><span class="token punctuation" style="color:hsl(220, 14%, 71%)">,</span><span class="token string" style="color:hsl(95, 38%, 62%)">"type"</span><span class="token punctuation" style="color:hsl(220, 14%, 71%)">:</span><span class="token string" style="color:hsl(95, 38%, 62%)">"Polygon"</span><span class="token punctuation" style="color:hsl(220, 14%, 71%)">}</span><span class="token punctuation" style="color:hsl(220, 14%, 71%)">}</span><span class="token punctuation" style="color:hsl(220, 14%, 71%)">]</span><span class="token punctuation" style="color:hsl(220, 14%, 71%)">}</span><span class="token punctuation" style="color:hsl(220, 14%, 71%)">)</span><span class="token plain"></span></span><br></span><span class="token-line codeLine_lJS_" style="color:hsl(220, 14%, 71%);text-shadow:0 1px rgba(0, 0, 0, 0.3)"><span class="codeLineNumber_Tfdd"></span><span class="codeLineContent_feaV"><span class="token plain" style="display:inline-block"></span></span><br></span><span class="token-line codeLine_lJS_" style="color:hsl(220, 14%, 71%);text-shadow:0 1px rgba(0, 0, 0, 0.3)"><span class="codeLineNumber_Tfdd"></span><span class="codeLineContent_feaV"><span class="token plain"></span><span class="token decorator annotation punctuation" style="color:hsl(220, 14%, 71%)">@fused</span><span class="token decorator annotation punctuation" style="color:hsl(220, 14%, 71%)">.</span><span class="token decorator annotation punctuation" style="color:hsl(220, 14%, 71%)">udf</span><span class="token plain"></span></span><br></span><span class="token-line codeLine_lJS_" style="color:hsl(220, 14%, 71%);text-shadow:0 1px rgba(0, 0, 0, 0.3)"><span class="codeLineNumber_Tfdd"></span><span class="codeLineContent_feaV"><span class="token plain"></span><span class="token keyword" style="color:hsl(286, 60%, 67%)">def</span><span class="token plain"> </span><span class="token function" style="color:hsl(207, 82%, 66%)">udf</span><span class="token punctuation" style="color:hsl(220, 14%, 71%)">(</span><span class="token plain">bbox</span><span class="token punctuation" style="color:hsl(220, 14%, 71%)">:</span><span class="token plain"> fused</span><span class="token punctuation" style="color:hsl(220, 14%, 71%)">.</span><span class="token plain">types</span><span class="token punctuation" style="color:hsl(220, 14%, 71%)">.</span><span class="token plain">TileGDF</span><span class="token operator" style="color:hsl(207, 82%, 66%)">=</span><span class="token plain">aoi</span><span class="token punctuation" style="color:hsl(220, 14%, 71%)">)</span><span class="token punctuation" style="color:hsl(220, 14%, 71%)">:</span><span class="token plain"></span></span><br></span><span class="token-line codeLine_lJS_" style="color:hsl(220, 14%, 71%);text-shadow:0 1px rgba(0, 0, 0, 0.3)"><span class="codeLineNumber_Tfdd"></span><span class="codeLineContent_feaV"><span class="token plain">    </span><span class="token keyword" style="color:hsl(286, 60%, 67%)">import</span><span class="token plain"> geopandas </span><span class="token keyword" style="color:hsl(286, 60%, 67%)">as</span><span class="token plain"> gpd</span></span><br></span><span class="token-line codeLine_lJS_" style="color:hsl(220, 14%, 71%);text-shadow:0 1px rgba(0, 0, 0, 0.3)"><span class="codeLineNumber_Tfdd"></span><span class="codeLineContent_feaV"><span class="token plain">    utils </span><span class="token operator" style="color:hsl(207, 82%, 66%)">=</span><span class="token plain"> fused</span><span class="token punctuation" style="color:hsl(220, 14%, 71%)">.</span><span class="token plain">load</span><span class="token punctuation" style="color:hsl(220, 14%, 71%)">(</span><span class="token string" style="color:hsl(95, 38%, 62%)">"https://github.com/fusedio/udfs/tree/e1fefb7/public/Overture_Maps_Example/"</span><span class="token punctuation" style="color:hsl(220, 14%, 71%)">)</span><span class="token punctuation" style="color:hsl(220, 14%, 71%)">.</span><span class="token plain">utils</span></span><br></span><span class="token-line codeLine_lJS_" style="color:hsl(220, 14%, 71%);text-shadow:0 1px rgba(0, 0, 0, 0.3)"><span class="codeLineNumber_Tfdd"></span><span class="codeLineContent_feaV"><span class="token plain" style="display:inline-block"></span></span><br></span><span class="token-line codeLine_lJS_" style="color:hsl(220, 14%, 71%);text-shadow:0 1px rgba(0, 0, 0, 0.3)"><span class="codeLineNumber_Tfdd"></span><span class="codeLineContent_feaV"><span class="token plain">    </span><span class="token comment" style="color:hsl(220, 10%, 40%)"># 1. Convert bbox to GeoDataFrame</span><span class="token plain"></span></span><br></span><span class="token-line codeLine_lJS_" style="color:hsl(220, 14%, 71%);text-shadow:0 1px rgba(0, 0, 0, 0.3)"><span class="codeLineNumber_Tfdd"></span><span class="codeLineContent_feaV"><span class="token plain">    </span><span class="token keyword" style="color:hsl(286, 60%, 67%)">if</span><span class="token plain"> </span><span class="token builtin" style="color:hsl(95, 38%, 62%)">isinstance</span><span class="token punctuation" style="color:hsl(220, 14%, 71%)">(</span><span class="token plain">bbox</span><span class="token punctuation" style="color:hsl(220, 14%, 71%)">,</span><span class="token plain"> </span><span class="token builtin" style="color:hsl(95, 38%, 62%)">str</span><span class="token punctuation" style="color:hsl(220, 14%, 71%)">)</span><span class="token punctuation" style="color:hsl(220, 14%, 71%)">:</span><span class="token plain"></span></span><br></span><span class="token-line codeLine_lJS_" style="color:hsl(220, 14%, 71%);text-shadow:0 1px rgba(0, 0, 0, 0.3)"><span class="codeLineNumber_Tfdd"></span><span class="codeLineContent_feaV"><span class="token plain">        bbox </span><span class="token operator" style="color:hsl(207, 82%, 66%)">=</span><span class="token plain"> gpd</span><span class="token punctuation" style="color:hsl(220, 14%, 71%)">.</span><span class="token plain">GeoDataFrame</span><span class="token punctuation" style="color:hsl(220, 14%, 71%)">.</span><span class="token plain">from_features</span><span class="token punctuation" style="color:hsl(220, 14%, 71%)">(</span><span class="token plain">json</span><span class="token punctuation" style="color:hsl(220, 14%, 71%)">.</span><span class="token plain">loads</span><span class="token punctuation" style="color:hsl(220, 14%, 71%)">(</span><span class="token plain">bbox</span><span class="token punctuation" style="color:hsl(220, 14%, 71%)">)</span><span class="token punctuation" style="color:hsl(220, 14%, 71%)">)</span><span class="token plain"></span></span><br></span><span class="token-line codeLine_lJS_" style="color:hsl(220, 14%, 71%);text-shadow:0 1px rgba(0, 0, 0, 0.3)"><span class="codeLineNumber_Tfdd"></span><span class="codeLineContent_feaV"><span class="token plain" style="display:inline-block"></span></span><br></span><span class="token-line codeLine_lJS_" style="color:hsl(220, 14%, 71%);text-shadow:0 1px rgba(0, 0, 0, 0.3)"><span class="codeLineNumber_Tfdd"></span><span class="codeLineContent_feaV"><span class="token plain">    </span><span class="token comment" style="color:hsl(220, 10%, 40%)"># 2. Load Overture Buildings that intersect the given bbox centroid</span><span class="token plain"></span></span><br></span><span class="token-line codeLine_lJS_" style="color:hsl(220, 14%, 71%);text-shadow:0 1px rgba(0, 0, 0, 0.3)"><span class="codeLineNumber_Tfdd"></span><span class="codeLineContent_feaV"><span class="token plain">    gdf </span><span class="token operator" style="color:hsl(207, 82%, 66%)">=</span><span class="token plain"> utils</span><span class="token punctuation" style="color:hsl(220, 14%, 71%)">.</span><span class="token plain">get_overture</span><span class="token punctuation" style="color:hsl(220, 14%, 71%)">(</span><span class="token plain">bbox</span><span class="token operator" style="color:hsl(207, 82%, 66%)">=</span><span class="token plain">bbox</span><span class="token punctuation" style="color:hsl(220, 14%, 71%)">.</span><span class="token plain">geometry</span><span class="token punctuation" style="color:hsl(220, 14%, 71%)">.</span><span class="token plain">centroid</span><span class="token punctuation" style="color:hsl(220, 14%, 71%)">,</span><span class="token plain"> overture_type</span><span class="token operator" style="color:hsl(207, 82%, 66%)">=</span><span class="token string" style="color:hsl(95, 38%, 62%)">'building'</span><span class="token punctuation" style="color:hsl(220, 14%, 71%)">,</span><span class="token plain"> min_zoom</span><span class="token operator" style="color:hsl(207, 82%, 66%)">=</span><span class="token number" style="color:hsl(29, 54%, 61%)">10</span><span class="token punctuation" style="color:hsl(220, 14%, 71%)">)</span><span class="token plain"></span></span><br></span><span class="token-line codeLine_lJS_" style="color:hsl(220, 14%, 71%);text-shadow:0 1px rgba(0, 0, 0, 0.3)"><span class="codeLineNumber_Tfdd"></span><span class="codeLineContent_feaV"><span class="token plain" style="display:inline-block"></span></span><br></span><span class="token-line codeLine_lJS_" style="color:hsl(220, 14%, 71%);text-shadow:0 1px rgba(0, 0, 0, 0.3)"><span class="codeLineNumber_Tfdd"></span><span class="codeLineContent_feaV"><span class="token plain">    </span><span class="token comment" style="color:hsl(220, 10%, 40%)"># How many Overture buildings fall within the bbox centroid?</span><span class="token plain"></span></span><br></span><span class="token-line codeLine_lJS_" style="color:hsl(220, 14%, 71%);text-shadow:0 1px rgba(0, 0, 0, 0.3)"><span class="codeLineNumber_Tfdd"></span><span class="codeLineContent_feaV"><span class="token plain">    </span><span class="token keyword" style="color:hsl(286, 60%, 67%)">print</span><span class="token punctuation" style="color:hsl(220, 14%, 71%)">(</span><span class="token string" style="color:hsl(95, 38%, 62%)">"Buildings in centroid: "</span><span class="token punctuation" style="color:hsl(220, 14%, 71%)">,</span><span class="token plain"> </span><span class="token builtin" style="color:hsl(95, 38%, 62%)">len</span><span class="token punctuation" style="color:hsl(220, 14%, 71%)">(</span><span class="token plain">gdf</span><span class="token punctuation" style="color:hsl(220, 14%, 71%)">)</span><span class="token punctuation" style="color:hsl(220, 14%, 71%)">)</span><span class="token plain"></span></span><br></span><span class="token-line codeLine_lJS_" style="color:hsl(220, 14%, 71%);text-shadow:0 1px rgba(0, 0, 0, 0.3)"><span class="codeLineNumber_Tfdd"></span><span class="codeLineContent_feaV"><span class="token plain" style="display:inline-block"></span></span><br></span><span class="token-line codeLine_lJS_" style="color:hsl(220, 14%, 71%);text-shadow:0 1px rgba(0, 0, 0, 0.3)"><span class="codeLineNumber_Tfdd"></span><span class="codeLineContent_feaV"><span class="token plain">    </span><span class="token comment" style="color:hsl(220, 10%, 40%)"># 3. Rule to set only one GERS on the input polygon</span><span class="token plain"></span></span><br></span><span class="token-line codeLine_lJS_" style="color:hsl(220, 14%, 71%);text-shadow:0 1px rgba(0, 0, 0, 0.3)"><span class="codeLineNumber_Tfdd"></span><span class="codeLineContent_feaV"><span class="token plain">    bbox</span><span class="token punctuation" style="color:hsl(220, 14%, 71%)">[</span><span class="token string" style="color:hsl(95, 38%, 62%)">'id'</span><span class="token punctuation" style="color:hsl(220, 14%, 71%)">]</span><span class="token plain"> </span><span class="token operator" style="color:hsl(207, 82%, 66%)">=</span><span class="token plain"> gdf</span><span class="token punctuation" style="color:hsl(220, 14%, 71%)">.</span><span class="token builtin" style="color:hsl(95, 38%, 62%)">id</span><span class="token punctuation" style="color:hsl(220, 14%, 71%)">.</span><span class="token plain">values</span><span class="token punctuation" style="color:hsl(220, 14%, 71%)">[</span><span class="token number" style="color:hsl(29, 54%, 61%)">0</span><span class="token punctuation" style="color:hsl(220, 14%, 71%)">]</span><span class="token plain"></span></span><br></span><span class="token-line codeLine_lJS_" style="color:hsl(220, 14%, 71%);text-shadow:0 1px rgba(0, 0, 0, 0.3)"><span class="codeLineNumber_Tfdd"></span><span class="codeLineContent_feaV"><span class="token plain" style="display:inline-block"></span></span><br></span><span class="token-line codeLine_lJS_" style="color:hsl(220, 14%, 71%);text-shadow:0 1px rgba(0, 0, 0, 0.3)"><span class="codeLineNumber_Tfdd"></span><span class="codeLineContent_feaV"><span class="token plain">    </span><span class="token keyword" style="color:hsl(286, 60%, 67%)">return</span><span class="token plain"> bbox</span></span><br></span></code></pre><div class="buttonGroup__atx"><button type="button" aria-label="Copy code to clipboard" title="Copy" class="clean-btn"><span class="copyButtonIcons_eSgA" aria-hidden="true"><svg viewBox="0 0 24 24" class="copyButtonIcon_y97N"><path fill="currentColor" d="M19,21H8V7H19M19,5H8A2,2 0 0,0 6,7V21A2,2 0 0,0 8,23H19A2,2 0 0,0 21,21V7A2,2 0 0,0 19,5M16,1H4A2,2 0 0,0 2,3V17H4V3H16V1Z"></path></svg><svg viewBox="0 0 24 24" class="copyButtonSuccessIcon_LjdS"><path fill="currentColor" d="M21,7L9,19L3.5,13.5L4.91,12.09L9,16.17L19.59,5.59L21,7Z"></path></svg></span></button></div></div></div>
<h3 class="anchor anchorWithStickyNavbar_LWe7" id="create-an-http-endpoint">Create an HTTP endpoint<a href="https://docs-staging.fused.io/pr/532/blog/enhance-your-data-with-gers-ids/#create-an-http-endpoint" class="hash-link" aria-label="Direct link to Create an HTTP endpoint" title="Direct link to Create an HTTP endpoint">​</a></h3>
<p>With Fused, it's easy to turn your UDF into an <a href="https://docs-staging.fused.io/pr/532/workbench/udf-builder/code-editor/#share-snippets">HTTP endpoint</a>. This enables you to <a href="https://docs-staging.fused.io/pr/532/core-concepts/run-udfs/run-small-udfs/#http-requests">run the UDF</a> it programmatically via HTTP requests to integrate the functionality into various workflows and applications.</p>
<p>This endpoint runs a public UDF with the code above. You can call it with a geojson of a single polygon in the bbox query parameter and it will return a geojson with the polygon and an assigned GERS ID.</p>
<div class="codeBlockContainer_Ckt0 theme-code-block" style="--prism-background-color:hsl(220, 13%, 18%);--prism-color:hsl(220, 14%, 71%)"><div class="codeBlockContent_biex"><pre tabindex="0" class="prism-code language-text codeBlock_bY9V thin-scrollbar" style="background-color:hsl(220, 13%, 18%);color:hsl(220, 14%, 71%);text-shadow:0 1px rgba(0, 0, 0, 0.3)"><code class="codeBlockLines_e6Vv"><span class="token-line" style="color:hsl(220, 14%, 71%);text-shadow:0 1px rgba(0, 0, 0, 0.3)"><span class="token plain">https://www.fused.io/server/v1/realtime-shared/UDF_Overture_Buildings_GERS_Enrich/run/file?dtype_out_vector=geojson&amp;bbox={"type":"FeatureCollection","features":[{"type":"Feature","properties":{},"geometry":{"coordinates":[[[-73.9945443706057,40.751205998161026],[-73.9945443706057,40.749882643934455],[-73.99222917395902,40.749882643934455],[-73.99222917395902,40.751205998161026],[-73.9945443706057,40.751205998161026]]],"type":"Polygon"}}]}</span><br></span></code></pre><div class="buttonGroup__atx"><button type="button" aria-label="Copy code to clipboard" title="Copy" class="clean-btn"><span class="copyButtonIcons_eSgA" aria-hidden="true"><svg viewBox="0 0 24 24" class="copyButtonIcon_y97N"><path fill="currentColor" d="M19,21H8V7H19M19,5H8A2,2 0 0,0 6,7V21A2,2 0 0,0 8,23H19A2,2 0 0,0 21,21V7A2,2 0 0,0 19,5M16,1H4A2,2 0 0,0 2,3V17H4V3H16V1Z"></path></svg><svg viewBox="0 0 24 24" class="copyButtonSuccessIcon_LjdS"><path fill="currentColor" d="M21,7L9,19L3.5,13.5L4.91,12.09L9,16.17L19.59,5.59L21,7Z"></path></svg></span></button></div></div></div>
<h2 class="anchor anchorWithStickyNavbar_LWe7" id="create-a-udf-to-look-up-metadata-for-a-gers-ids">Create a UDF to look-up metadata for a GERS IDs<a href="https://docs-staging.fused.io/pr/532/blog/enhance-your-data-with-gers-ids/#create-a-udf-to-look-up-metadata-for-a-gers-ids" class="hash-link" aria-label="Direct link to Create a UDF to look-up metadata for a GERS IDs" title="Direct link to Create a UDF to look-up metadata for a GERS IDs">​</a></h2>
<p>We can also create a sample UDF to do a reverse operation: look-up a Building and its attributes by passing a GERS id. A user will be able to pass a GERS id and the UDF will look-up the building and return its geometry along with attributes about the building.</p>
<p>To do this, we create a UDF that takes in a <code>gers_id</code> parameter. Because the first 16 digits of GERS correspond to an H3 cell, we can use the ID to create a polygon to spatially filter the dataset. It'll bring up any buildings that intersect the H3 cell. Once we have the building, we can easily work with its geometry object and attributes using GeoPandas.</p>
<div class="language-python codeBlockContainer_Ckt0 theme-code-block" style="--prism-background-color:hsl(220, 13%, 18%);--prism-color:hsl(220, 14%, 71%)"><div class="codeBlockContent_biex"><pre tabindex="0" class="prism-code language-python codeBlock_bY9V thin-scrollbar" style="background-color:hsl(220, 13%, 18%);color:hsl(220, 14%, 71%);text-shadow:0 1px rgba(0, 0, 0, 0.3)"><code class="codeBlockLines_e6Vv codeBlockLinesWithNumbering_o6Pm"><span class="token-line codeLine_lJS_" style="color:hsl(220, 14%, 71%);text-shadow:0 1px rgba(0, 0, 0, 0.3)"><span class="codeLineNumber_Tfdd"></span><span class="codeLineContent_feaV"><span class="token decorator annotation punctuation" style="color:hsl(220, 14%, 71%)">@fused</span><span class="token decorator annotation punctuation" style="color:hsl(220, 14%, 71%)">.</span><span class="token decorator annotation punctuation" style="color:hsl(220, 14%, 71%)">udf</span><span class="token plain"></span></span><br></span><span class="token-line codeLine_lJS_" style="color:hsl(220, 14%, 71%);text-shadow:0 1px rgba(0, 0, 0, 0.3)"><span class="codeLineNumber_Tfdd"></span><span class="codeLineContent_feaV"><span class="token plain"></span><span class="token keyword" style="color:hsl(286, 60%, 67%)">def</span><span class="token plain"> </span><span class="token function" style="color:hsl(207, 82%, 66%)">udf</span><span class="token punctuation" style="color:hsl(220, 14%, 71%)">(</span><span class="token plain">gers_id</span><span class="token punctuation" style="color:hsl(220, 14%, 71%)">:</span><span class="token plain"> </span><span class="token builtin" style="color:hsl(95, 38%, 62%)">str</span><span class="token operator" style="color:hsl(207, 82%, 66%)">=</span><span class="token string" style="color:hsl(95, 38%, 62%)">'08b2a100d2cb6fff02000821de8bdff1'</span><span class="token punctuation" style="color:hsl(220, 14%, 71%)">)</span><span class="token punctuation" style="color:hsl(220, 14%, 71%)">:</span><span class="token plain"></span></span><br></span><span class="token-line codeLine_lJS_" style="color:hsl(220, 14%, 71%);text-shadow:0 1px rgba(0, 0, 0, 0.3)"><span class="codeLineNumber_Tfdd"></span><span class="codeLineContent_feaV"><span class="token plain">    </span><span class="token keyword" style="color:hsl(286, 60%, 67%)">import</span><span class="token plain"> h3</span></span><br></span><span class="token-line codeLine_lJS_" style="color:hsl(220, 14%, 71%);text-shadow:0 1px rgba(0, 0, 0, 0.3)"><span class="codeLineNumber_Tfdd"></span><span class="codeLineContent_feaV"><span class="token plain">    </span><span class="token keyword" style="color:hsl(286, 60%, 67%)">from</span><span class="token plain"> shapely</span><span class="token punctuation" style="color:hsl(220, 14%, 71%)">.</span><span class="token plain">geometry </span><span class="token keyword" style="color:hsl(286, 60%, 67%)">import</span><span class="token plain"> Polygon</span></span><br></span><span class="token-line codeLine_lJS_" style="color:hsl(220, 14%, 71%);text-shadow:0 1px rgba(0, 0, 0, 0.3)"><span class="codeLineNumber_Tfdd"></span><span class="codeLineContent_feaV"><span class="token plain">    </span><span class="token keyword" style="color:hsl(286, 60%, 67%)">import</span><span class="token plain"> geopandas </span><span class="token keyword" style="color:hsl(286, 60%, 67%)">as</span><span class="token plain"> gpd</span></span><br></span><span class="token-line codeLine_lJS_" style="color:hsl(220, 14%, 71%);text-shadow:0 1px rgba(0, 0, 0, 0.3)"><span class="codeLineNumber_Tfdd"></span><span class="codeLineContent_feaV"><span class="token plain">    </span><span class="token keyword" style="color:hsl(286, 60%, 67%)">import</span><span class="token plain"> pandas </span><span class="token keyword" style="color:hsl(286, 60%, 67%)">as</span><span class="token plain"> pd</span></span><br></span><span class="token-line codeLine_lJS_" style="color:hsl(220, 14%, 71%);text-shadow:0 1px rgba(0, 0, 0, 0.3)"><span class="codeLineNumber_Tfdd"></span><span class="codeLineContent_feaV"><span class="token plain" style="display:inline-block"></span></span><br></span><span class="token-line codeLine_lJS_" style="color:hsl(220, 14%, 71%);text-shadow:0 1px rgba(0, 0, 0, 0.3)"><span class="codeLineNumber_Tfdd"></span><span class="codeLineContent_feaV"><span class="token plain">    utils </span><span class="token operator" style="color:hsl(207, 82%, 66%)">=</span><span class="token plain"> fused</span><span class="token punctuation" style="color:hsl(220, 14%, 71%)">.</span><span class="token plain">load</span><span class="token punctuation" style="color:hsl(220, 14%, 71%)">(</span><span class="token string" style="color:hsl(95, 38%, 62%)">"https://github.com/fusedio/udfs/tree/e1fefb7/public/Overture_Maps_Example/"</span><span class="token punctuation" style="color:hsl(220, 14%, 71%)">)</span><span class="token punctuation" style="color:hsl(220, 14%, 71%)">.</span><span class="token plain">utils</span></span><br></span><span class="token-line codeLine_lJS_" style="color:hsl(220, 14%, 71%);text-shadow:0 1px rgba(0, 0, 0, 0.3)"><span class="codeLineNumber_Tfdd"></span><span class="codeLineContent_feaV"><span class="token plain" style="display:inline-block"></span></span><br></span><span class="token-line codeLine_lJS_" style="color:hsl(220, 14%, 71%);text-shadow:0 1px rgba(0, 0, 0, 0.3)"><span class="codeLineNumber_Tfdd"></span><span class="codeLineContent_feaV"><span class="token plain">    </span><span class="token comment" style="color:hsl(220, 10%, 40%)"># 1. H3 from GERS</span><span class="token plain"></span></span><br></span><span class="token-line codeLine_lJS_" style="color:hsl(220, 14%, 71%);text-shadow:0 1px rgba(0, 0, 0, 0.3)"><span class="codeLineNumber_Tfdd"></span><span class="codeLineContent_feaV"><span class="token plain">    h3_index </span><span class="token operator" style="color:hsl(207, 82%, 66%)">=</span><span class="token plain"> gers_id</span><span class="token punctuation" style="color:hsl(220, 14%, 71%)">[</span><span class="token punctuation" style="color:hsl(220, 14%, 71%)">:</span><span class="token number" style="color:hsl(29, 54%, 61%)">16</span><span class="token punctuation" style="color:hsl(220, 14%, 71%)">]</span><span class="token plain"></span></span><br></span><span class="token-line codeLine_lJS_" style="color:hsl(220, 14%, 71%);text-shadow:0 1px rgba(0, 0, 0, 0.3)"><span class="codeLineNumber_Tfdd"></span><span class="codeLineContent_feaV"><span class="token plain">    </span><span class="token keyword" style="color:hsl(286, 60%, 67%)">print</span><span class="token punctuation" style="color:hsl(220, 14%, 71%)">(</span><span class="token string" style="color:hsl(95, 38%, 62%)">'h3_index'</span><span class="token punctuation" style="color:hsl(220, 14%, 71%)">,</span><span class="token plain"> h3_index</span><span class="token punctuation" style="color:hsl(220, 14%, 71%)">)</span><span class="token plain"></span></span><br></span><span class="token-line codeLine_lJS_" style="color:hsl(220, 14%, 71%);text-shadow:0 1px rgba(0, 0, 0, 0.3)"><span class="codeLineNumber_Tfdd"></span><span class="codeLineContent_feaV"><span class="token plain" style="display:inline-block"></span></span><br></span><span class="token-line codeLine_lJS_" style="color:hsl(220, 14%, 71%);text-shadow:0 1px rgba(0, 0, 0, 0.3)"><span class="codeLineNumber_Tfdd"></span><span class="codeLineContent_feaV"><span class="token plain">    </span><span class="token comment" style="color:hsl(220, 10%, 40%)"># 2. Polygon from H3</span><span class="token plain"></span></span><br></span><span class="token-line codeLine_lJS_" style="color:hsl(220, 14%, 71%);text-shadow:0 1px rgba(0, 0, 0, 0.3)"><span class="codeLineNumber_Tfdd"></span><span class="codeLineContent_feaV"><span class="token plain">    bounds </span><span class="token operator" style="color:hsl(207, 82%, 66%)">=</span><span class="token plain"> Polygon</span><span class="token punctuation" style="color:hsl(220, 14%, 71%)">(</span><span class="token punctuation" style="color:hsl(220, 14%, 71%)">[</span><span class="token plain">coord</span><span class="token punctuation" style="color:hsl(220, 14%, 71%)">[</span><span class="token punctuation" style="color:hsl(220, 14%, 71%)">:</span><span class="token punctuation" style="color:hsl(220, 14%, 71%)">:</span><span class="token operator" style="color:hsl(207, 82%, 66%)">-</span><span class="token number" style="color:hsl(29, 54%, 61%)">1</span><span class="token punctuation" style="color:hsl(220, 14%, 71%)">]</span><span class="token plain"> </span><span class="token keyword" style="color:hsl(286, 60%, 67%)">for</span><span class="token plain"> coord </span><span class="token keyword" style="color:hsl(286, 60%, 67%)">in</span><span class="token plain"> h3</span><span class="token punctuation" style="color:hsl(220, 14%, 71%)">.</span><span class="token plain">cell_to_boundary</span><span class="token punctuation" style="color:hsl(220, 14%, 71%)">(</span><span class="token plain">h3_index</span><span class="token punctuation" style="color:hsl(220, 14%, 71%)">)</span><span class="token punctuation" style="color:hsl(220, 14%, 71%)">]</span><span class="token punctuation" style="color:hsl(220, 14%, 71%)">)</span><span class="token plain"></span></span><br></span><span class="token-line codeLine_lJS_" style="color:hsl(220, 14%, 71%);text-shadow:0 1px rgba(0, 0, 0, 0.3)"><span class="codeLineNumber_Tfdd"></span><span class="codeLineContent_feaV"><span class="token plain">    bbox </span><span class="token operator" style="color:hsl(207, 82%, 66%)">=</span><span class="token plain"> gpd</span><span class="token punctuation" style="color:hsl(220, 14%, 71%)">.</span><span class="token plain">GeoDataFrame</span><span class="token punctuation" style="color:hsl(220, 14%, 71%)">(</span><span class="token punctuation" style="color:hsl(220, 14%, 71%)">{</span><span class="token string" style="color:hsl(95, 38%, 62%)">'h3_index'</span><span class="token punctuation" style="color:hsl(220, 14%, 71%)">:</span><span class="token plain"> </span><span class="token punctuation" style="color:hsl(220, 14%, 71%)">[</span><span class="token plain">h3_index</span><span class="token punctuation" style="color:hsl(220, 14%, 71%)">]</span><span class="token punctuation" style="color:hsl(220, 14%, 71%)">,</span><span class="token plain"> </span><span class="token string" style="color:hsl(95, 38%, 62%)">'geometry'</span><span class="token punctuation" style="color:hsl(220, 14%, 71%)">:</span><span class="token plain"> </span><span class="token punctuation" style="color:hsl(220, 14%, 71%)">[</span><span class="token plain">bounds</span><span class="token punctuation" style="color:hsl(220, 14%, 71%)">]</span><span class="token punctuation" style="color:hsl(220, 14%, 71%)">}</span><span class="token punctuation" style="color:hsl(220, 14%, 71%)">)</span><span class="token plain"></span></span><br></span><span class="token-line codeLine_lJS_" style="color:hsl(220, 14%, 71%);text-shadow:0 1px rgba(0, 0, 0, 0.3)"><span class="codeLineNumber_Tfdd"></span><span class="codeLineContent_feaV"><span class="token plain" style="display:inline-block"></span></span><br></span><span class="token-line codeLine_lJS_" style="color:hsl(220, 14%, 71%);text-shadow:0 1px rgba(0, 0, 0, 0.3)"><span class="codeLineNumber_Tfdd"></span><span class="codeLineContent_feaV"><span class="token plain">    </span><span class="token comment" style="color:hsl(220, 10%, 40%)"># 3. Load Overture Buildings</span><span class="token plain"></span></span><br></span><span class="token-line codeLine_lJS_" style="color:hsl(220, 14%, 71%);text-shadow:0 1px rgba(0, 0, 0, 0.3)"><span class="codeLineNumber_Tfdd"></span><span class="codeLineContent_feaV"><span class="token plain">    gdf </span><span class="token operator" style="color:hsl(207, 82%, 66%)">=</span><span class="token plain"> utils</span><span class="token punctuation" style="color:hsl(220, 14%, 71%)">.</span><span class="token plain">get_overture</span><span class="token punctuation" style="color:hsl(220, 14%, 71%)">(</span><span class="token plain">bbox</span><span class="token operator" style="color:hsl(207, 82%, 66%)">=</span><span class="token plain">bbox</span><span class="token punctuation" style="color:hsl(220, 14%, 71%)">,</span><span class="token plain"> overture_type</span><span class="token operator" style="color:hsl(207, 82%, 66%)">=</span><span class="token string" style="color:hsl(95, 38%, 62%)">'building'</span><span class="token punctuation" style="color:hsl(220, 14%, 71%)">,</span><span class="token plain"> min_zoom</span><span class="token operator" style="color:hsl(207, 82%, 66%)">=</span><span class="token number" style="color:hsl(29, 54%, 61%)">10</span><span class="token punctuation" style="color:hsl(220, 14%, 71%)">)</span><span class="token plain"></span></span><br></span><span class="token-line codeLine_lJS_" style="color:hsl(220, 14%, 71%);text-shadow:0 1px rgba(0, 0, 0, 0.3)"><span class="codeLineNumber_Tfdd"></span><span class="codeLineContent_feaV"><span class="token plain" style="display:inline-block"></span></span><br></span><span class="token-line codeLine_lJS_" style="color:hsl(220, 14%, 71%);text-shadow:0 1px rgba(0, 0, 0, 0.3)"><span class="codeLineNumber_Tfdd"></span><span class="codeLineContent_feaV"><span class="token plain">    </span><span class="token comment" style="color:hsl(220, 10%, 40%)"># 4. Subselect building</span><span class="token plain"></span></span><br></span><span class="token-line codeLine_lJS_" style="color:hsl(220, 14%, 71%);text-shadow:0 1px rgba(0, 0, 0, 0.3)"><span class="codeLineNumber_Tfdd"></span><span class="codeLineContent_feaV"><span class="token plain">    gdf </span><span class="token operator" style="color:hsl(207, 82%, 66%)">=</span><span class="token plain"> gdf</span><span class="token punctuation" style="color:hsl(220, 14%, 71%)">[</span><span class="token plain">gdf</span><span class="token punctuation" style="color:hsl(220, 14%, 71%)">[</span><span class="token string" style="color:hsl(95, 38%, 62%)">'id'</span><span class="token punctuation" style="color:hsl(220, 14%, 71%)">]</span><span class="token plain"> </span><span class="token operator" style="color:hsl(207, 82%, 66%)">==</span><span class="token plain"> gers_id</span><span class="token punctuation" style="color:hsl(220, 14%, 71%)">]</span><span class="token plain"></span></span><br></span><span class="token-line codeLine_lJS_" style="color:hsl(220, 14%, 71%);text-shadow:0 1px rgba(0, 0, 0, 0.3)"><span class="codeLineNumber_Tfdd"></span><span class="codeLineContent_feaV"><span class="token plain" style="display:inline-block"></span></span><br></span><span class="token-line codeLine_lJS_" style="color:hsl(220, 14%, 71%);text-shadow:0 1px rgba(0, 0, 0, 0.3)"><span class="codeLineNumber_Tfdd"></span><span class="codeLineContent_feaV"><span class="token plain">    </span><span class="token comment" style="color:hsl(220, 10%, 40%)"># 5. De-struct the names column</span><span class="token plain"></span></span><br></span><span class="token-line codeLine_lJS_" style="color:hsl(220, 14%, 71%);text-shadow:0 1px rgba(0, 0, 0, 0.3)"><span class="codeLineNumber_Tfdd"></span><span class="codeLineContent_feaV"><span class="token plain">    normalized_df </span><span class="token operator" style="color:hsl(207, 82%, 66%)">=</span><span class="token plain"> pd</span><span class="token punctuation" style="color:hsl(220, 14%, 71%)">.</span><span class="token plain">json_normalize</span><span class="token punctuation" style="color:hsl(220, 14%, 71%)">(</span><span class="token plain">gdf</span><span class="token punctuation" style="color:hsl(220, 14%, 71%)">[</span><span class="token string" style="color:hsl(95, 38%, 62%)">'names'</span><span class="token punctuation" style="color:hsl(220, 14%, 71%)">]</span><span class="token punctuation" style="color:hsl(220, 14%, 71%)">)</span><span class="token plain"></span></span><br></span><span class="token-line codeLine_lJS_" style="color:hsl(220, 14%, 71%);text-shadow:0 1px rgba(0, 0, 0, 0.3)"><span class="codeLineNumber_Tfdd"></span><span class="codeLineContent_feaV"><span class="token plain">    gdf </span><span class="token operator" style="color:hsl(207, 82%, 66%)">=</span><span class="token plain"> gdf</span><span class="token punctuation" style="color:hsl(220, 14%, 71%)">.</span><span class="token plain">reset_index</span><span class="token punctuation" style="color:hsl(220, 14%, 71%)">(</span><span class="token plain">drop</span><span class="token operator" style="color:hsl(207, 82%, 66%)">=</span><span class="token boolean" style="color:hsl(29, 54%, 61%)">True</span><span class="token punctuation" style="color:hsl(220, 14%, 71%)">)</span><span class="token punctuation" style="color:hsl(220, 14%, 71%)">.</span><span class="token plain">join</span><span class="token punctuation" style="color:hsl(220, 14%, 71%)">(</span><span class="token plain">normalized_df</span><span class="token punctuation" style="color:hsl(220, 14%, 71%)">)</span><span class="token plain"></span></span><br></span><span class="token-line codeLine_lJS_" style="color:hsl(220, 14%, 71%);text-shadow:0 1px rgba(0, 0, 0, 0.3)"><span class="codeLineNumber_Tfdd"></span><span class="codeLineContent_feaV"><span class="token plain" style="display:inline-block"></span></span><br></span><span class="token-line codeLine_lJS_" style="color:hsl(220, 14%, 71%);text-shadow:0 1px rgba(0, 0, 0, 0.3)"><span class="codeLineNumber_Tfdd"></span><span class="codeLineContent_feaV"><span class="token plain">    </span><span class="token keyword" style="color:hsl(286, 60%, 67%)">return</span><span class="token plain"> gdf</span><span class="token punctuation" style="color:hsl(220, 14%, 71%)">[</span><span class="token punctuation" style="color:hsl(220, 14%, 71%)">[</span><span class="token string" style="color:hsl(95, 38%, 62%)">'id'</span><span class="token punctuation" style="color:hsl(220, 14%, 71%)">,</span><span class="token plain"> </span><span class="token string" style="color:hsl(95, 38%, 62%)">'primary'</span><span class="token punctuation" style="color:hsl(220, 14%, 71%)">,</span><span class="token plain"> </span><span class="token string" style="color:hsl(95, 38%, 62%)">'subtype'</span><span class="token punctuation" style="color:hsl(220, 14%, 71%)">,</span><span class="token plain"> </span><span class="token string" style="color:hsl(95, 38%, 62%)">'class'</span><span class="token punctuation" style="color:hsl(220, 14%, 71%)">,</span><span class="token plain"> </span><span class="token string" style="color:hsl(95, 38%, 62%)">'geometry'</span><span class="token punctuation" style="color:hsl(220, 14%, 71%)">]</span><span class="token punctuation" style="color:hsl(220, 14%, 71%)">]</span></span><br></span></code></pre><div class="buttonGroup__atx"><button type="button" aria-label="Copy code to clipboard" title="Copy" class="clean-btn"><span class="copyButtonIcons_eSgA" aria-hidden="true"><svg viewBox="0 0 24 24" class="copyButtonIcon_y97N"><path fill="currentColor" d="M19,21H8V7H19M19,5H8A2,2 0 0,0 6,7V21A2,2 0 0,0 8,23H19A2,2 0 0,0 21,21V7A2,2 0 0,0 19,5M16,1H4A2,2 0 0,0 2,3V17H4V3H16V1Z"></path></svg><svg viewBox="0 0 24 24" class="copyButtonSuccessIcon_LjdS"><path fill="currentColor" d="M21,7L9,19L3.5,13.5L4.91,12.09L9,16.17L19.59,5.59L21,7Z"></path></svg></span></button></div></div></div>
<h3 class="anchor anchorWithStickyNavbar_LWe7" id="create-an-http-endpoint-1">Create an HTTP endpoint<a href="https://docs-staging.fused.io/pr/532/blog/enhance-your-data-with-gers-ids/#create-an-http-endpoint-1" class="hash-link" aria-label="Direct link to Create an HTTP endpoint" title="Direct link to Create an HTTP endpoint">​</a></h3>
<p>Here's how you can create and use an HTTP endpoint for your GERS building lookup UDF.</p>
<p>This endpoint returns a CSV table of the building's GERS ID, primary name, subtype, class, and geometry. You can use this endpoint to enrich your dataset with GERS IDs by calling it with a GERS ID query parameter.</p>
<div class="codeBlockContainer_Ckt0 theme-code-block" style="--prism-background-color:hsl(220, 13%, 18%);--prism-color:hsl(220, 14%, 71%)"><div class="codeBlockContent_biex"><pre tabindex="0" class="prism-code language-text codeBlock_bY9V thin-scrollbar" style="background-color:hsl(220, 13%, 18%);color:hsl(220, 14%, 71%);text-shadow:0 1px rgba(0, 0, 0, 0.3)"><code class="codeBlockLines_e6Vv"><span class="token-line" style="color:hsl(220, 14%, 71%);text-shadow:0 1px rgba(0, 0, 0, 0.3)"><span class="token plain">https://www.fused.io/server/v1/realtime-shared/UDF_Overture_Buildings_GERS_Lookup/run/file?08b2a100d2cb6fff02000821de8bdff1&amp;dtype_out_vector=csv</span><br></span></code></pre><div class="buttonGroup__atx"><button type="button" aria-label="Copy code to clipboard" title="Copy" class="clean-btn"><span class="copyButtonIcons_eSgA" aria-hidden="true"><svg viewBox="0 0 24 24" class="copyButtonIcon_y97N"><path fill="currentColor" d="M19,21H8V7H19M19,5H8A2,2 0 0,0 6,7V21A2,2 0 0,0 8,23H19A2,2 0 0,0 21,21V7A2,2 0 0,0 19,5M16,1H4A2,2 0 0,0 2,3V17H4V3H16V1Z"></path></svg><svg viewBox="0 0 24 24" class="copyButtonSuccessIcon_LjdS"><path fill="currentColor" d="M21,7L9,19L3.5,13.5L4.91,12.09L9,16.17L19.59,5.59L21,7Z"></path></svg></span></button></div></div></div>
<p>For example, you could call this endpoint from a Google Sheet (<a href="https://docs.fused.io/user-guide/out/googlesheets/" target="_blank" rel="noopener noreferrer">docs</a>) to enrich a dataset with GERS IDs. This sample Google Sheet returns the enriches the “primary” name column for any given Building GERS. Just drag the formula to apply it to any row below. It works by calling the "GERS lookup" endpoint with a GERS ID query parameter.</p>]]></content>
        <author>
            <name>Jennings Anderson</name>
            <uri>https://www.linkedin.com/in/jenningsanderson/</uri>
        </author>
        <author>
            <name>Plinio Guzman</name>
            <uri>https://www.linkedin.com/in/plinioguzman/</uri>
        </author>
        <category label="gers" term="gers"/>
        <category label="h3" term="h3"/>
        <category label="overture" term="overture"/>
    </entry>
    <entry>
        <title type="html"><![CDATA[We're partnering with Overture to make their Data easily accessible with Fused]]></title>
        <id>https://docs-staging.fused.io/pr/532/blog/partnering-with-overture/</id>
        <link href="https://docs-staging.fused.io/pr/532/blog/partnering-with-overture/"/>
        <updated>2025-02-11T00:00:00.000Z</updated>
        <summary type="html"><![CDATA[_TL;DR: We've made it easier to work with Overture data by leveraging Fused._]]></summary>
        <content type="html"><![CDATA[<p><strong><em>TL;DR: We've made it easier to work with Overture data by leveraging Fused.</em></strong></p>
<p>Fused has been working with the team at The <a href="https://overturemaps.org/" target="_blank" rel="noopener noreferrer">Overture Maps Foundation</a> to enable direct access to their data through Fused UDFs. We are excited to share that the <a href="https://docs.overturemaps.org/getting-data/fused/" target="_blank" rel="noopener noreferrer">Overture docs</a> now show examples on how to see how to integrate any Overture data into your workflows using Fused.</p>
<p><img decoding="async" loading="lazy" alt="Alt" src="https://docs-staging.fused.io/pr/532/assets/images/overture_docs-27f92b1f4c47ece6cdf715e37b9daeca.png" width="2334" height="2228" class="img_ev3q"></p>
<p>Overture Maps aims to provide foundational building blocks of data across various themes designed to be broadly applicable across industries. Our goal at Fused is to make it easy to work with Overture data and adopt standards (such as <a href="https://docs.overturemaps.org/gers/" target="_blank" rel="noopener noreferrer">GERS</a>). To this end, we are creating easy abstractions to access data, tools to perform foundational operations such as conflation and enrichment, and example workflows to inspire and help you understand how to leverage this data.</p>
<p>One of the key usecases for Overture + Fused is enriching datasets with Overture Maps data. This tutorial showcases 2 simple Python workflows that do this by performing a spatial join with Overture Buildings. This example of a simple enrichment operation will help you understand how to work with Overture data in your own workflows.</p>
<!-- -->
<div class="theme-admonition theme-admonition-info admonition_xJq3 alert alert--info"><div class="admonitionHeading_Gvgb"><span class="admonitionIcon_Rf37"><svg viewBox="0 0 14 16"><path fill-rule="evenodd" d="M7 2.3c3.14 0 5.7 2.56 5.7 5.7s-2.56 5.7-5.7 5.7A5.71 5.71 0 0 1 1.3 8c0-3.14 2.56-5.7 5.7-5.7zM7 1C3.14 1 0 4.14 0 8s3.14 7 7 7 7-3.14 7-7-3.14-7-7-7zm1 3H6v5h2V4zm0 6H6v2h2v-2z"></path></svg></span>info</div><div class="admonitionContent_BuS1"><p>To follow along, check out the:</p><ul>
<li><a href="https://docs.overturemaps.org/getting-data/fused/" target="_blank" rel="noopener noreferrer">Overture Maps Docs "Getting Data" Page</a></li>
<li><a href="https://docs.overturemaps.org/examples/fused/" target="_blank" rel="noopener noreferrer">Overture Maps Docs "Examples" Page</a></li>
<li><a href="https://www.fused.io/workbench/catalog/Overture_Maps_Example-64071fb8-2c96-4015-adb9-596c3bac6787" target="_blank" rel="noopener noreferrer">Overture Maps Example UDF</a></li>
<li><a href="https://www.fused.io/workbench/catalog/Overture_Nsi-dd89972c-ce30-4544-ba0f-81fc09f5bbef" target="_blank" rel="noopener noreferrer">Overture + NSI UDF</a></li>
</ul></div></div>
<h2 class="anchor anchorWithStickyNavbar_LWe7" id="overview">Overview<a href="https://docs-staging.fused.io/pr/532/blog/partnering-with-overture/#overview" class="hash-link" aria-label="Direct link to Overview" title="Direct link to Overview">​</a></h2>
<p>The Overture Buildings dataset is dividen into themes. Two key themes are:</p>
<ul>
<li><a href="https://docs.overturemaps.org/guides/buildings/#14/32.58453/-117.05154/0/60" target="_blank" rel="noopener noreferrer">Buildings</a> is composed of building footprints represented as polygons</li>
<li><a href="https://docs.overturemaps.org/guides/places/#14/32.58453/-117.05154/0/60" target="_blank" rel="noopener noreferrer">Places</a> is composed of business establishment locations and associated metadata, represented with point coordinates.</li>
</ul>
<p>We'll first show how you can load Overture data by reusing an existing Fused UDF, then write a User Defined Function (UDF) with custom logic to perform enrichment with a spatial join. You'll be able to run the resulting UDF for any custom area of interest (AOI).</p>
<h2 class="anchor anchorWithStickyNavbar_LWe7" id="step-1-load-data-with-the-overture-maps-udf">Step 1: Load data with the Overture Maps UDF<a href="https://docs-staging.fused.io/pr/532/blog/partnering-with-overture/#step-1-load-data-with-the-overture-maps-udf" class="hash-link" aria-label="Direct link to Step 1: Load data with the Overture Maps UDF" title="Direct link to Step 1: Load data with the Overture Maps UDF">​</a></h2>
<p>Fused has a catalog of pre-made UDFs you can easily copy and repurpose for your own data analysis workflows. In the catalog, you'll find the Fused Overture UDF which enables you to quickly load Overture data from any of the themes for an area of interest (AOI). You can run the UDF with <code>fused.run</code> and specify an AOI to load data for using the bbox parameter. You may also pass optional parameters to select between Overture releases, themes, and columns - that way you can fetch only the data you need. In this example, we can specify the 'building' theme by setting the <code>overture_type</code> parameter.</p>
<div class="language-python codeBlockContainer_Ckt0 theme-code-block" style="--prism-background-color:hsl(220, 13%, 18%);--prism-color:hsl(220, 14%, 71%)"><div class="codeBlockContent_biex"><pre tabindex="0" class="prism-code language-python codeBlock_bY9V thin-scrollbar" style="background-color:hsl(220, 13%, 18%);color:hsl(220, 14%, 71%);text-shadow:0 1px rgba(0, 0, 0, 0.3)"><code class="codeBlockLines_e6Vv codeBlockLinesWithNumbering_o6Pm"><span class="token-line codeLine_lJS_" style="color:hsl(220, 14%, 71%);text-shadow:0 1px rgba(0, 0, 0, 0.3)"><span class="codeLineNumber_Tfdd"></span><span class="codeLineContent_feaV"><span class="token keyword" style="color:hsl(286, 60%, 67%)">import</span><span class="token plain"> fused</span></span><br></span><span class="token-line codeLine_lJS_" style="color:hsl(220, 14%, 71%);text-shadow:0 1px rgba(0, 0, 0, 0.3)"><span class="codeLineNumber_Tfdd"></span><span class="codeLineContent_feaV"><span class="token plain"></span><span class="token keyword" style="color:hsl(286, 60%, 67%)">import</span><span class="token plain"> geopandas </span><span class="token keyword" style="color:hsl(286, 60%, 67%)">as</span><span class="token plain"> gpd</span></span><br></span><span class="token-line codeLine_lJS_" style="color:hsl(220, 14%, 71%);text-shadow:0 1px rgba(0, 0, 0, 0.3)"><span class="codeLineNumber_Tfdd"></span><span class="codeLineContent_feaV"><span class="token plain"></span><span class="token keyword" style="color:hsl(286, 60%, 67%)">import</span><span class="token plain"> shapely</span></span><br></span><span class="token-line codeLine_lJS_" style="color:hsl(220, 14%, 71%);text-shadow:0 1px rgba(0, 0, 0, 0.3)"><span class="codeLineNumber_Tfdd"></span><span class="codeLineContent_feaV"><span class="token plain" style="display:inline-block"></span></span><br></span><span class="token-line codeLine_lJS_" style="color:hsl(220, 14%, 71%);text-shadow:0 1px rgba(0, 0, 0, 0.3)"><span class="codeLineNumber_Tfdd"></span><span class="codeLineContent_feaV"><span class="token plain">bbox </span><span class="token operator" style="color:hsl(207, 82%, 66%)">=</span><span class="token plain"> gpd</span><span class="token punctuation" style="color:hsl(220, 14%, 71%)">.</span><span class="token plain">GeoDataFrame</span><span class="token punctuation" style="color:hsl(220, 14%, 71%)">(</span><span class="token plain"></span></span><br></span><span class="token-line codeLine_lJS_" style="color:hsl(220, 14%, 71%);text-shadow:0 1px rgba(0, 0, 0, 0.3)"><span class="codeLineNumber_Tfdd"></span><span class="codeLineContent_feaV"><span class="token plain">    geometry</span><span class="token operator" style="color:hsl(207, 82%, 66%)">=</span><span class="token punctuation" style="color:hsl(220, 14%, 71%)">[</span><span class="token plain">shapely</span><span class="token punctuation" style="color:hsl(220, 14%, 71%)">.</span><span class="token plain">box</span><span class="token punctuation" style="color:hsl(220, 14%, 71%)">(</span><span class="token operator" style="color:hsl(207, 82%, 66%)">-</span><span class="token number" style="color:hsl(29, 54%, 61%)">73.9847</span><span class="token punctuation" style="color:hsl(220, 14%, 71%)">,</span><span class="token plain"> </span><span class="token number" style="color:hsl(29, 54%, 61%)">40.7666</span><span class="token punctuation" style="color:hsl(220, 14%, 71%)">,</span><span class="token plain"> </span><span class="token operator" style="color:hsl(207, 82%, 66%)">-</span><span class="token number" style="color:hsl(29, 54%, 61%)">73.9810</span><span class="token punctuation" style="color:hsl(220, 14%, 71%)">,</span><span class="token plain"> </span><span class="token number" style="color:hsl(29, 54%, 61%)">40.7694</span><span class="token punctuation" style="color:hsl(220, 14%, 71%)">)</span><span class="token punctuation" style="color:hsl(220, 14%, 71%)">]</span><span class="token punctuation" style="color:hsl(220, 14%, 71%)">,</span><span class="token plain"></span></span><br></span><span class="token-line codeLine_lJS_" style="color:hsl(220, 14%, 71%);text-shadow:0 1px rgba(0, 0, 0, 0.3)"><span class="codeLineNumber_Tfdd"></span><span class="codeLineContent_feaV"><span class="token plain">    crs</span><span class="token operator" style="color:hsl(207, 82%, 66%)">=</span><span class="token number" style="color:hsl(29, 54%, 61%)">4326</span><span class="token plain"></span></span><br></span><span class="token-line codeLine_lJS_" style="color:hsl(220, 14%, 71%);text-shadow:0 1px rgba(0, 0, 0, 0.3)"><span class="codeLineNumber_Tfdd"></span><span class="codeLineContent_feaV"><span class="token plain"></span><span class="token punctuation" style="color:hsl(220, 14%, 71%)">)</span><span class="token plain"></span></span><br></span><span class="token-line codeLine_lJS_" style="color:hsl(220, 14%, 71%);text-shadow:0 1px rgba(0, 0, 0, 0.3)"><span class="codeLineNumber_Tfdd"></span><span class="codeLineContent_feaV"><span class="token plain" style="display:inline-block"></span></span><br></span><span class="token-line codeLine_lJS_" style="color:hsl(220, 14%, 71%);text-shadow:0 1px rgba(0, 0, 0, 0.3)"><span class="codeLineNumber_Tfdd"></span><span class="codeLineContent_feaV"><span class="token plain">fused</span><span class="token punctuation" style="color:hsl(220, 14%, 71%)">.</span><span class="token plain">run</span><span class="token punctuation" style="color:hsl(220, 14%, 71%)">(</span><span class="token string" style="color:hsl(95, 38%, 62%)">'UDF_Overture_Maps_Example'</span><span class="token punctuation" style="color:hsl(220, 14%, 71%)">,</span><span class="token plain"> bbox</span><span class="token operator" style="color:hsl(207, 82%, 66%)">=</span><span class="token plain">bbox</span><span class="token punctuation" style="color:hsl(220, 14%, 71%)">,</span><span class="token plain"> overture_type</span><span class="token operator" style="color:hsl(207, 82%, 66%)">=</span><span class="token string" style="color:hsl(95, 38%, 62%)">'building'</span><span class="token punctuation" style="color:hsl(220, 14%, 71%)">)</span></span><br></span></code></pre><div class="buttonGroup__atx"><button type="button" aria-label="Copy code to clipboard" title="Copy" class="clean-btn"><span class="copyButtonIcons_eSgA" aria-hidden="true"><svg viewBox="0 0 24 24" class="copyButtonIcon_y97N"><path fill="currentColor" d="M19,21H8V7H19M19,5H8A2,2 0 0,0 6,7V21A2,2 0 0,0 8,23H19A2,2 0 0,0 21,21V7A2,2 0 0,0 19,5M16,1H4A2,2 0 0,0 2,3V17H4V3H16V1Z"></path></svg><svg viewBox="0 0 24 24" class="copyButtonSuccessIcon_LjdS"><path fill="currentColor" d="M21,7L9,19L3.5,13.5L4.91,12.09L9,16.17L19.59,5.59L21,7Z"></path></svg></span></button></div></div></div>
<p>The output should look like this:</p>
<div class="language-python codeBlockContainer_Ckt0 theme-code-block" style="--prism-background-color:hsl(220, 13%, 18%);--prism-color:hsl(220, 14%, 71%)"><div class="codeBlockContent_biex"><pre tabindex="0" class="prism-code language-python codeBlock_bY9V thin-scrollbar" style="background-color:hsl(220, 13%, 18%);color:hsl(220, 14%, 71%);text-shadow:0 1px rgba(0, 0, 0, 0.3)"><code class="codeBlockLines_e6Vv codeBlockLinesWithNumbering_o6Pm"><span class="token-line codeLine_lJS_" style="color:hsl(220, 14%, 71%);text-shadow:0 1px rgba(0, 0, 0, 0.3)"><span class="codeLineNumber_Tfdd"></span><span class="codeLineContent_feaV"><span class="token plain" style="display:inline-block"></span></span><br></span><span class="token-line codeLine_lJS_" style="color:hsl(220, 14%, 71%);text-shadow:0 1px rgba(0, 0, 0, 0.3)"><span class="codeLineNumber_Tfdd"></span><span class="codeLineContent_feaV"><span class="token plain">        </span><span class="token builtin" style="color:hsl(95, 38%, 62%)">id</span><span class="token plain">	                                geometry	                                        </span><span class="token keyword" style="color:hsl(286, 60%, 67%)">class</span><span class="token plain">   </span><span class="token punctuation" style="color:hsl(220, 14%, 71%)">.</span><span class="token punctuation" style="color:hsl(220, 14%, 71%)">.</span><span class="token punctuation" style="color:hsl(220, 14%, 71%)">.</span><span class="token plain"></span></span><br></span><span class="token-line codeLine_lJS_" style="color:hsl(220, 14%, 71%);text-shadow:0 1px rgba(0, 0, 0, 0.3)"><span class="codeLineNumber_Tfdd"></span><span class="codeLineContent_feaV"><span class="token plain"></span><span class="token number" style="color:hsl(29, 54%, 61%)">24134</span><span class="token plain">	08b2a100d65a6fff0200b45ce7e2b99b	POLYGON </span><span class="token punctuation" style="color:hsl(220, 14%, 71%)">(</span><span class="token punctuation" style="color:hsl(220, 14%, 71%)">(</span><span class="token operator" style="color:hsl(207, 82%, 66%)">-</span><span class="token number" style="color:hsl(29, 54%, 61%)">73.98552</span><span class="token plain"> </span><span class="token number" style="color:hsl(29, 54%, 61%)">40.76736</span><span class="token punctuation" style="color:hsl(220, 14%, 71%)">,</span><span class="token plain"> </span><span class="token operator" style="color:hsl(207, 82%, 66%)">-</span><span class="token number" style="color:hsl(29, 54%, 61%)">73.98557</span><span class="token plain"> </span><span class="token number" style="color:hsl(29, 54%, 61%)">40.767</span><span class="token punctuation" style="color:hsl(220, 14%, 71%)">.</span><span class="token punctuation" style="color:hsl(220, 14%, 71%)">.</span><span class="token punctuation" style="color:hsl(220, 14%, 71%)">.</span><span class="token plain">	apartments  </span><span class="token punctuation" style="color:hsl(220, 14%, 71%)">.</span><span class="token punctuation" style="color:hsl(220, 14%, 71%)">.</span><span class="token punctuation" style="color:hsl(220, 14%, 71%)">.</span><span class="token plain"></span></span><br></span><span class="token-line codeLine_lJS_" style="color:hsl(220, 14%, 71%);text-shadow:0 1px rgba(0, 0, 0, 0.3)"><span class="codeLineNumber_Tfdd"></span><span class="codeLineContent_feaV"><span class="token plain"></span><span class="token number" style="color:hsl(29, 54%, 61%)">24135</span><span class="token plain">	08b2a1008b259fff02007917db1c32d3	POLYGON </span><span class="token punctuation" style="color:hsl(220, 14%, 71%)">(</span><span class="token punctuation" style="color:hsl(220, 14%, 71%)">(</span><span class="token operator" style="color:hsl(207, 82%, 66%)">-</span><span class="token number" style="color:hsl(29, 54%, 61%)">73.98441</span><span class="token plain"> </span><span class="token number" style="color:hsl(29, 54%, 61%)">40.76703</span><span class="token punctuation" style="color:hsl(220, 14%, 71%)">,</span><span class="token plain"> </span><span class="token operator" style="color:hsl(207, 82%, 66%)">-</span><span class="token number" style="color:hsl(29, 54%, 61%)">73.98431</span><span class="token plain"> </span><span class="token number" style="color:hsl(29, 54%, 61%)">40.767</span><span class="token punctuation" style="color:hsl(220, 14%, 71%)">.</span><span class="token punctuation" style="color:hsl(220, 14%, 71%)">.</span><span class="token punctuation" style="color:hsl(220, 14%, 71%)">.</span><span class="token plain">	apartments  </span><span class="token punctuation" style="color:hsl(220, 14%, 71%)">.</span><span class="token punctuation" style="color:hsl(220, 14%, 71%)">.</span><span class="token punctuation" style="color:hsl(220, 14%, 71%)">.</span><span class="token plain"></span></span><br></span><span class="token-line codeLine_lJS_" style="color:hsl(220, 14%, 71%);text-shadow:0 1px rgba(0, 0, 0, 0.3)"><span class="codeLineNumber_Tfdd"></span><span class="codeLineContent_feaV"><span class="token plain"></span><span class="token number" style="color:hsl(29, 54%, 61%)">24178</span><span class="token plain">	08b2a100d6516fff0200ded2bf849c8a	POLYGON </span><span class="token punctuation" style="color:hsl(220, 14%, 71%)">(</span><span class="token punctuation" style="color:hsl(220, 14%, 71%)">(</span><span class="token operator" style="color:hsl(207, 82%, 66%)">-</span><span class="token number" style="color:hsl(29, 54%, 61%)">73.98375</span><span class="token plain"> </span><span class="token number" style="color:hsl(29, 54%, 61%)">40.76693</span><span class="token punctuation" style="color:hsl(220, 14%, 71%)">,</span><span class="token plain"> </span><span class="token operator" style="color:hsl(207, 82%, 66%)">-</span><span class="token number" style="color:hsl(29, 54%, 61%)">73.98381</span><span class="token plain"> </span><span class="token number" style="color:hsl(29, 54%, 61%)">40.766</span><span class="token punctuation" style="color:hsl(220, 14%, 71%)">.</span><span class="token punctuation" style="color:hsl(220, 14%, 71%)">.</span><span class="token punctuation" style="color:hsl(220, 14%, 71%)">.</span><span class="token plain">	apartments  </span><span class="token punctuation" style="color:hsl(220, 14%, 71%)">.</span><span class="token punctuation" style="color:hsl(220, 14%, 71%)">.</span><span class="token punctuation" style="color:hsl(220, 14%, 71%)">.</span><span class="token plain"></span></span><br></span><span class="token-line codeLine_lJS_" style="color:hsl(220, 14%, 71%);text-shadow:0 1px rgba(0, 0, 0, 0.3)"><span class="codeLineNumber_Tfdd"></span><span class="codeLineContent_feaV"><span class="token plain"></span><span class="token number" style="color:hsl(29, 54%, 61%)">24179</span><span class="token plain">	08b2a100d6516fff02006dc174022a7e	POLYGON </span><span class="token punctuation" style="color:hsl(220, 14%, 71%)">(</span><span class="token punctuation" style="color:hsl(220, 14%, 71%)">(</span><span class="token operator" style="color:hsl(207, 82%, 66%)">-</span><span class="token number" style="color:hsl(29, 54%, 61%)">73.98346</span><span class="token plain"> </span><span class="token number" style="color:hsl(29, 54%, 61%)">40.76623</span><span class="token punctuation" style="color:hsl(220, 14%, 71%)">,</span><span class="token plain"> </span><span class="token operator" style="color:hsl(207, 82%, 66%)">-</span><span class="token number" style="color:hsl(29, 54%, 61%)">73.98327</span><span class="token plain"> </span><span class="token number" style="color:hsl(29, 54%, 61%)">40.766</span><span class="token punctuation" style="color:hsl(220, 14%, 71%)">.</span><span class="token punctuation" style="color:hsl(220, 14%, 71%)">.</span><span class="token punctuation" style="color:hsl(220, 14%, 71%)">.</span><span class="token plain">	commercial  </span><span class="token punctuation" style="color:hsl(220, 14%, 71%)">.</span><span class="token punctuation" style="color:hsl(220, 14%, 71%)">.</span><span class="token punctuation" style="color:hsl(220, 14%, 71%)">.</span><span class="token plain"></span></span><br></span><span class="token-line codeLine_lJS_" style="color:hsl(220, 14%, 71%);text-shadow:0 1px rgba(0, 0, 0, 0.3)"><span class="codeLineNumber_Tfdd"></span><span class="codeLineContent_feaV"><span class="token plain"></span><span class="token number" style="color:hsl(29, 54%, 61%)">24180</span><span class="token plain">	08b2a1008b248fff0200315983940aa8	POLYGON </span><span class="token punctuation" style="color:hsl(220, 14%, 71%)">(</span><span class="token punctuation" style="color:hsl(220, 14%, 71%)">(</span><span class="token operator" style="color:hsl(207, 82%, 66%)">-</span><span class="token number" style="color:hsl(29, 54%, 61%)">73.98407</span><span class="token plain"> </span><span class="token number" style="color:hsl(29, 54%, 61%)">40.76749</span><span class="token punctuation" style="color:hsl(220, 14%, 71%)">,</span><span class="token plain"> </span><span class="token operator" style="color:hsl(207, 82%, 66%)">-</span><span class="token number" style="color:hsl(29, 54%, 61%)">73.98402</span><span class="token plain"> </span><span class="token number" style="color:hsl(29, 54%, 61%)">40.767</span><span class="token punctuation" style="color:hsl(220, 14%, 71%)">.</span><span class="token punctuation" style="color:hsl(220, 14%, 71%)">.</span><span class="token punctuation" style="color:hsl(220, 14%, 71%)">.</span><span class="token plain">	</span><span class="token boolean" style="color:hsl(29, 54%, 61%)">None</span><span class="token plain">    </span><span class="token punctuation" style="color:hsl(220, 14%, 71%)">.</span><span class="token punctuation" style="color:hsl(220, 14%, 71%)">.</span><span class="token punctuation" style="color:hsl(220, 14%, 71%)">.</span><span class="token plain"></span></span><br></span><span class="token-line codeLine_lJS_" style="color:hsl(220, 14%, 71%);text-shadow:0 1px rgba(0, 0, 0, 0.3)"><span class="codeLineNumber_Tfdd"></span><span class="codeLineContent_feaV"><span class="token plain" style="display:inline-block"></span></span><br></span></code></pre><div class="buttonGroup__atx"><button type="button" aria-label="Copy code to clipboard" title="Copy" class="clean-btn"><span class="copyButtonIcons_eSgA" aria-hidden="true"><svg viewBox="0 0 24 24" class="copyButtonIcon_y97N"><path fill="currentColor" d="M19,21H8V7H19M19,5H8A2,2 0 0,0 6,7V21A2,2 0 0,0 8,23H19A2,2 0 0,0 21,21V7A2,2 0 0,0 19,5M16,1H4A2,2 0 0,0 2,3V17H4V3H16V1Z"></path></svg><svg viewBox="0 0 24 24" class="copyButtonSuccessIcon_LjdS"><path fill="currentColor" d="M21,7L9,19L3.5,13.5L4.91,12.09L9,16.17L19.59,5.59L21,7Z"></path></svg></span></button></div></div></div>
<p>By browsing the UDF's <a href="https://www.fused.io/workbench/catalog/Overture_Maps_Example-64071fb8-2c96-4015-adb9-596c3bac6787" target="_blank" rel="noopener noreferrer">catalog page</a>, you can see its code and even copy it to run it interactively on the Fused Workbench. You'll notice that the UDF uses the <code>get_overture</code> helper function to read from spatially partitioned parquets of the overture data releases, hosted in a Source Cooperative S3 bucket. The source code of the helper function is fully open and hosted on GitHub <a href="https://github.com/fusedio/udfs/blob/main/public/Overture_Maps_Example/utils.py" target="_blank" rel="noopener noreferrer">here</a>.</p>
<p>Here's a simplified version to show the core of what's going on in <code>get_overture</code>. It constructs the table path on S3 and then uses the <a href="https://github.com/fusedio/udfs/blob/main/public/common/utils.py#L258" target="_blank" rel="noopener noreferrer">table_to_tile</a> helper function from Fused to load data that falls within the specified bounding box. This approach allows you to efficiently perform spatial queries on a large dataset and load only the records within the given area.</p>
<div class="language-python codeBlockContainer_Ckt0 theme-code-block" style="--prism-background-color:hsl(220, 13%, 18%);--prism-color:hsl(220, 14%, 71%)"><div class="codeBlockContent_biex"><pre tabindex="0" class="prism-code language-python codeBlock_bY9V thin-scrollbar" style="background-color:hsl(220, 13%, 18%);color:hsl(220, 14%, 71%);text-shadow:0 1px rgba(0, 0, 0, 0.3)"><code class="codeBlockLines_e6Vv codeBlockLinesWithNumbering_o6Pm"><span class="token-line codeLine_lJS_" style="color:hsl(220, 14%, 71%);text-shadow:0 1px rgba(0, 0, 0, 0.3)"><span class="codeLineNumber_Tfdd"></span><span class="codeLineContent_feaV"><span class="token comment" style="color:hsl(220, 10%, 40%)"># Structure the table path with input parameters</span><span class="token plain"></span></span><br></span><span class="token-line codeLine_lJS_" style="color:hsl(220, 14%, 71%);text-shadow:0 1px rgba(0, 0, 0, 0.3)"><span class="codeLineNumber_Tfdd"></span><span class="codeLineContent_feaV"><span class="token plain">table_path </span><span class="token operator" style="color:hsl(207, 82%, 66%)">=</span><span class="token plain"> </span><span class="token string-interpolation string" style="color:hsl(95, 38%, 62%)">f"s3://us-west-2.opendata.source.coop/fused/overture/</span><span class="token string-interpolation interpolation punctuation" style="color:hsl(220, 14%, 71%)">{</span><span class="token string-interpolation interpolation">release</span><span class="token string-interpolation interpolation punctuation" style="color:hsl(220, 14%, 71%)">}</span><span class="token string-interpolation string" style="color:hsl(95, 38%, 62%)">/theme=</span><span class="token string-interpolation interpolation punctuation" style="color:hsl(220, 14%, 71%)">{</span><span class="token string-interpolation interpolation">theme</span><span class="token string-interpolation interpolation punctuation" style="color:hsl(220, 14%, 71%)">}</span><span class="token string-interpolation string" style="color:hsl(95, 38%, 62%)">/type=</span><span class="token string-interpolation interpolation punctuation" style="color:hsl(220, 14%, 71%)">{</span><span class="token string-interpolation interpolation">overture_type</span><span class="token string-interpolation interpolation punctuation" style="color:hsl(220, 14%, 71%)">}</span><span class="token string-interpolation string" style="color:hsl(95, 38%, 62%)">"</span><span class="token plain"></span></span><br></span><span class="token-line codeLine_lJS_" style="color:hsl(220, 14%, 71%);text-shadow:0 1px rgba(0, 0, 0, 0.3)"><span class="codeLineNumber_Tfdd"></span><span class="codeLineContent_feaV"><span class="token plain" style="display:inline-block"></span></span><br></span><span class="token-line codeLine_lJS_" style="color:hsl(220, 14%, 71%);text-shadow:0 1px rgba(0, 0, 0, 0.3)"><span class="codeLineNumber_Tfdd"></span><span class="codeLineContent_feaV"><span class="token plain"></span><span class="token comment" style="color:hsl(220, 10%, 40%)"># Load the data within the bounding box</span><span class="token plain"></span></span><br></span><span class="token-line codeLine_lJS_" style="color:hsl(220, 14%, 71%);text-shadow:0 1px rgba(0, 0, 0, 0.3)"><span class="codeLineNumber_Tfdd"></span><span class="codeLineContent_feaV"><span class="token plain">df </span><span class="token operator" style="color:hsl(207, 82%, 66%)">=</span><span class="token plain"> utils</span><span class="token punctuation" style="color:hsl(220, 14%, 71%)">.</span><span class="token plain">table_to_tile</span><span class="token punctuation" style="color:hsl(220, 14%, 71%)">(</span><span class="token plain">bbox</span><span class="token punctuation" style="color:hsl(220, 14%, 71%)">,</span><span class="token plain"> table</span><span class="token operator" style="color:hsl(207, 82%, 66%)">=</span><span class="token plain">part_path</span><span class="token punctuation" style="color:hsl(220, 14%, 71%)">)</span></span><br></span></code></pre><div class="buttonGroup__atx"><button type="button" aria-label="Copy code to clipboard" title="Copy" class="clean-btn"><span class="copyButtonIcons_eSgA" aria-hidden="true"><svg viewBox="0 0 24 24" class="copyButtonIcon_y97N"><path fill="currentColor" d="M19,21H8V7H19M19,5H8A2,2 0 0,0 6,7V21A2,2 0 0,0 8,23H19A2,2 0 0,0 21,21V7A2,2 0 0,0 19,5M16,1H4A2,2 0 0,0 2,3V17H4V3H16V1Z"></path></svg><svg viewBox="0 0 24 24" class="copyButtonSuccessIcon_LjdS"><path fill="currentColor" d="M21,7L9,19L3.5,13.5L4.91,12.09L9,16.17L19.59,5.59L21,7Z"></path></svg></span></button></div></div></div>
<h2 class="anchor anchorWithStickyNavbar_LWe7" id="step-2-write-a-custom-udf-to-join-places-with-buildings">Step 2: Write a Custom UDF to join Places with Buildings<a href="https://docs-staging.fused.io/pr/532/blog/partnering-with-overture/#step-2-write-a-custom-udf-to-join-places-with-buildings" class="hash-link" aria-label="Direct link to Step 2: Write a Custom UDF to join Places with Buildings" title="Direct link to Step 2: Write a Custom UDF to join Places with Buildings">​</a></h2>
<p>The example above shows how to run an existing UDF to load Overture data, but it's likely you want to write your own data transformations. You can borrow <code>get_overture</code> to load data into your own UDFs. As an example, here is a UDF to load Overture Buildings polygons and Overture Places points. The UDF perform a spatial join between them to determine which points fall within each building.</p>
<div class="language-python codeBlockContainer_Ckt0 theme-code-block" style="--prism-background-color:hsl(220, 13%, 18%);--prism-color:hsl(220, 14%, 71%)"><div class="codeBlockContent_biex"><pre tabindex="0" class="prism-code language-python codeBlock_bY9V thin-scrollbar" style="background-color:hsl(220, 13%, 18%);color:hsl(220, 14%, 71%);text-shadow:0 1px rgba(0, 0, 0, 0.3)"><code class="codeBlockLines_e6Vv codeBlockLinesWithNumbering_o6Pm"><span class="token-line codeLine_lJS_" style="color:hsl(220, 14%, 71%);text-shadow:0 1px rgba(0, 0, 0, 0.3)"><span class="codeLineNumber_Tfdd"></span><span class="codeLineContent_feaV"><span class="token decorator annotation punctuation" style="color:hsl(220, 14%, 71%)">@fused</span><span class="token decorator annotation punctuation" style="color:hsl(220, 14%, 71%)">.</span><span class="token decorator annotation punctuation" style="color:hsl(220, 14%, 71%)">udf</span><span class="token plain"></span></span><br></span><span class="token-line codeLine_lJS_" style="color:hsl(220, 14%, 71%);text-shadow:0 1px rgba(0, 0, 0, 0.3)"><span class="codeLineNumber_Tfdd"></span><span class="codeLineContent_feaV"><span class="token plain"></span><span class="token keyword" style="color:hsl(286, 60%, 67%)">def</span><span class="token plain"> </span><span class="token function" style="color:hsl(207, 82%, 66%)">udf</span><span class="token punctuation" style="color:hsl(220, 14%, 71%)">(</span><span class="token plain">bbox</span><span class="token punctuation" style="color:hsl(220, 14%, 71%)">:</span><span class="token plain"> fused</span><span class="token punctuation" style="color:hsl(220, 14%, 71%)">.</span><span class="token plain">types</span><span class="token punctuation" style="color:hsl(220, 14%, 71%)">.</span><span class="token plain">TileGDF </span><span class="token operator" style="color:hsl(207, 82%, 66%)">=</span><span class="token plain"> </span><span class="token boolean" style="color:hsl(29, 54%, 61%)">None</span><span class="token punctuation" style="color:hsl(220, 14%, 71%)">)</span><span class="token punctuation" style="color:hsl(220, 14%, 71%)">:</span><span class="token plain"></span></span><br></span><span class="token-line codeLine_lJS_" style="color:hsl(220, 14%, 71%);text-shadow:0 1px rgba(0, 0, 0, 0.3)"><span class="codeLineNumber_Tfdd"></span><span class="codeLineContent_feaV"><span class="token plain" style="display:inline-block"></span></span><br></span><span class="token-line codeLine_lJS_" style="color:hsl(220, 14%, 71%);text-shadow:0 1px rgba(0, 0, 0, 0.3)"><span class="codeLineNumber_Tfdd"></span><span class="codeLineContent_feaV"><span class="token plain">    utils </span><span class="token operator" style="color:hsl(207, 82%, 66%)">=</span><span class="token plain"> fused</span><span class="token punctuation" style="color:hsl(220, 14%, 71%)">.</span><span class="token plain">load</span><span class="token punctuation" style="color:hsl(220, 14%, 71%)">(</span><span class="token string" style="color:hsl(95, 38%, 62%)">"https://github.com/fusedio/udfs/tree/e1fefb7/public/Overture_Maps_Example/"</span><span class="token punctuation" style="color:hsl(220, 14%, 71%)">)</span><span class="token punctuation" style="color:hsl(220, 14%, 71%)">.</span><span class="token plain">utils</span></span><br></span><span class="token-line codeLine_lJS_" style="color:hsl(220, 14%, 71%);text-shadow:0 1px rgba(0, 0, 0, 0.3)"><span class="codeLineNumber_Tfdd"></span><span class="codeLineContent_feaV"><span class="token plain" style="display:inline-block"></span></span><br></span><span class="token-line codeLine_lJS_" style="color:hsl(220, 14%, 71%);text-shadow:0 1px rgba(0, 0, 0, 0.3)"><span class="codeLineNumber_Tfdd"></span><span class="codeLineContent_feaV"><span class="token plain">    </span><span class="token comment" style="color:hsl(220, 10%, 40%)"># 1. Load Buildings</span><span class="token plain"></span></span><br></span><span class="token-line codeLine_lJS_" style="color:hsl(220, 14%, 71%);text-shadow:0 1px rgba(0, 0, 0, 0.3)"><span class="codeLineNumber_Tfdd"></span><span class="codeLineContent_feaV"><span class="token plain">    gdf_buildings </span><span class="token operator" style="color:hsl(207, 82%, 66%)">=</span><span class="token plain"> utils</span><span class="token punctuation" style="color:hsl(220, 14%, 71%)">.</span><span class="token plain">get_overture</span><span class="token punctuation" style="color:hsl(220, 14%, 71%)">(</span><span class="token plain">bbox</span><span class="token operator" style="color:hsl(207, 82%, 66%)">=</span><span class="token plain">bbox</span><span class="token punctuation" style="color:hsl(220, 14%, 71%)">,</span><span class="token plain"> theme</span><span class="token operator" style="color:hsl(207, 82%, 66%)">=</span><span class="token string" style="color:hsl(95, 38%, 62%)">'buildings'</span><span class="token punctuation" style="color:hsl(220, 14%, 71%)">)</span><span class="token plain"></span></span><br></span><span class="token-line codeLine_lJS_" style="color:hsl(220, 14%, 71%);text-shadow:0 1px rgba(0, 0, 0, 0.3)"><span class="codeLineNumber_Tfdd"></span><span class="codeLineContent_feaV"><span class="token plain" style="display:inline-block"></span></span><br></span><span class="token-line codeLine_lJS_" style="color:hsl(220, 14%, 71%);text-shadow:0 1px rgba(0, 0, 0, 0.3)"><span class="codeLineNumber_Tfdd"></span><span class="codeLineContent_feaV"><span class="token plain">    </span><span class="token comment" style="color:hsl(220, 10%, 40%)"># 2. Load Places</span><span class="token plain"></span></span><br></span><span class="token-line codeLine_lJS_" style="color:hsl(220, 14%, 71%);text-shadow:0 1px rgba(0, 0, 0, 0.3)"><span class="codeLineNumber_Tfdd"></span><span class="codeLineContent_feaV"><span class="token plain">    gdf_places </span><span class="token operator" style="color:hsl(207, 82%, 66%)">=</span><span class="token plain"> utils</span><span class="token punctuation" style="color:hsl(220, 14%, 71%)">.</span><span class="token plain">get_overture</span><span class="token punctuation" style="color:hsl(220, 14%, 71%)">(</span><span class="token plain">bbox</span><span class="token operator" style="color:hsl(207, 82%, 66%)">=</span><span class="token plain">bbox</span><span class="token punctuation" style="color:hsl(220, 14%, 71%)">,</span><span class="token plain"> theme</span><span class="token operator" style="color:hsl(207, 82%, 66%)">=</span><span class="token string" style="color:hsl(95, 38%, 62%)">'places'</span><span class="token punctuation" style="color:hsl(220, 14%, 71%)">)</span><span class="token plain"></span></span><br></span><span class="token-line codeLine_lJS_" style="color:hsl(220, 14%, 71%);text-shadow:0 1px rgba(0, 0, 0, 0.3)"><span class="codeLineNumber_Tfdd"></span><span class="codeLineContent_feaV"><span class="token plain" style="display:inline-block"></span></span><br></span><span class="token-line codeLine_lJS_" style="color:hsl(220, 14%, 71%);text-shadow:0 1px rgba(0, 0, 0, 0.3)"><span class="codeLineNumber_Tfdd"></span><span class="codeLineContent_feaV"><span class="token plain">    </span><span class="token comment" style="color:hsl(220, 10%, 40%)"># 3. Create a column with the Buliding Name</span><span class="token plain"></span></span><br></span><span class="token-line codeLine_lJS_" style="color:hsl(220, 14%, 71%);text-shadow:0 1px rgba(0, 0, 0, 0.3)"><span class="codeLineNumber_Tfdd"></span><span class="codeLineContent_feaV"><span class="token plain">    gdf_buildings</span><span class="token punctuation" style="color:hsl(220, 14%, 71%)">[</span><span class="token string" style="color:hsl(95, 38%, 62%)">'primary_name'</span><span class="token punctuation" style="color:hsl(220, 14%, 71%)">]</span><span class="token plain"> </span><span class="token operator" style="color:hsl(207, 82%, 66%)">=</span><span class="token plain"> gdf_buildings</span><span class="token punctuation" style="color:hsl(220, 14%, 71%)">[</span><span class="token string" style="color:hsl(95, 38%, 62%)">'names'</span><span class="token punctuation" style="color:hsl(220, 14%, 71%)">]</span><span class="token punctuation" style="color:hsl(220, 14%, 71%)">.</span><span class="token builtin" style="color:hsl(95, 38%, 62%)">apply</span><span class="token punctuation" style="color:hsl(220, 14%, 71%)">(</span><span class="token keyword" style="color:hsl(286, 60%, 67%)">lambda</span><span class="token plain"> x</span><span class="token punctuation" style="color:hsl(220, 14%, 71%)">:</span><span class="token plain"> x</span><span class="token punctuation" style="color:hsl(220, 14%, 71%)">.</span><span class="token plain">get</span><span class="token punctuation" style="color:hsl(220, 14%, 71%)">(</span><span class="token string" style="color:hsl(95, 38%, 62%)">'primary'</span><span class="token punctuation" style="color:hsl(220, 14%, 71%)">)</span><span class="token plain"> </span><span class="token keyword" style="color:hsl(286, 60%, 67%)">if</span><span class="token plain"> </span><span class="token builtin" style="color:hsl(95, 38%, 62%)">isinstance</span><span class="token punctuation" style="color:hsl(220, 14%, 71%)">(</span><span class="token plain">x</span><span class="token punctuation" style="color:hsl(220, 14%, 71%)">,</span><span class="token plain"> </span><span class="token builtin" style="color:hsl(95, 38%, 62%)">dict</span><span class="token punctuation" style="color:hsl(220, 14%, 71%)">)</span><span class="token plain"> </span><span class="token keyword" style="color:hsl(286, 60%, 67%)">else</span><span class="token plain"> </span><span class="token boolean" style="color:hsl(29, 54%, 61%)">None</span><span class="token punctuation" style="color:hsl(220, 14%, 71%)">)</span><span class="token plain"></span></span><br></span><span class="token-line codeLine_lJS_" style="color:hsl(220, 14%, 71%);text-shadow:0 1px rgba(0, 0, 0, 0.3)"><span class="codeLineNumber_Tfdd"></span><span class="codeLineContent_feaV"><span class="token plain" style="display:inline-block"></span></span><br></span><span class="token-line codeLine_lJS_" style="color:hsl(220, 14%, 71%);text-shadow:0 1px rgba(0, 0, 0, 0.3)"><span class="codeLineNumber_Tfdd"></span><span class="codeLineContent_feaV"><span class="token plain">    </span><span class="token comment" style="color:hsl(220, 10%, 40%)"># 4. Spatial join between Places and Buildings</span><span class="token plain"></span></span><br></span><span class="token-line codeLine_lJS_" style="color:hsl(220, 14%, 71%);text-shadow:0 1px rgba(0, 0, 0, 0.3)"><span class="codeLineNumber_Tfdd"></span><span class="codeLineContent_feaV"><span class="token plain">    gdf_joined </span><span class="token operator" style="color:hsl(207, 82%, 66%)">=</span><span class="token plain"> gdf_places</span><span class="token punctuation" style="color:hsl(220, 14%, 71%)">.</span><span class="token plain">sjoin</span><span class="token punctuation" style="color:hsl(220, 14%, 71%)">(</span><span class="token plain">gdf_buildings</span><span class="token punctuation" style="color:hsl(220, 14%, 71%)">[</span><span class="token punctuation" style="color:hsl(220, 14%, 71%)">[</span><span class="token string" style="color:hsl(95, 38%, 62%)">'geometry'</span><span class="token punctuation" style="color:hsl(220, 14%, 71%)">,</span><span class="token plain"> </span><span class="token string" style="color:hsl(95, 38%, 62%)">'primary_name'</span><span class="token punctuation" style="color:hsl(220, 14%, 71%)">]</span><span class="token punctuation" style="color:hsl(220, 14%, 71%)">]</span><span class="token punctuation" style="color:hsl(220, 14%, 71%)">)</span><span class="token punctuation" style="color:hsl(220, 14%, 71%)">[</span><span class="token punctuation" style="color:hsl(220, 14%, 71%)">[</span><span class="token string" style="color:hsl(95, 38%, 62%)">'id'</span><span class="token punctuation" style="color:hsl(220, 14%, 71%)">,</span><span class="token plain"> </span><span class="token string" style="color:hsl(95, 38%, 62%)">'names'</span><span class="token punctuation" style="color:hsl(220, 14%, 71%)">,</span><span class="token plain"> </span><span class="token string" style="color:hsl(95, 38%, 62%)">'primary_name'</span><span class="token punctuation" style="color:hsl(220, 14%, 71%)">,</span><span class="token plain"> </span><span class="token string" style="color:hsl(95, 38%, 62%)">'geometry'</span><span class="token punctuation" style="color:hsl(220, 14%, 71%)">]</span><span class="token punctuation" style="color:hsl(220, 14%, 71%)">]</span><span class="token plain"></span></span><br></span><span class="token-line codeLine_lJS_" style="color:hsl(220, 14%, 71%);text-shadow:0 1px rgba(0, 0, 0, 0.3)"><span class="codeLineNumber_Tfdd"></span><span class="codeLineContent_feaV"><span class="token plain" style="display:inline-block"></span></span><br></span><span class="token-line codeLine_lJS_" style="color:hsl(220, 14%, 71%);text-shadow:0 1px rgba(0, 0, 0, 0.3)"><span class="codeLineNumber_Tfdd"></span><span class="codeLineContent_feaV"><span class="token plain">    </span><span class="token keyword" style="color:hsl(286, 60%, 67%)">return</span><span class="token plain"> gdf_joined</span></span><br></span></code></pre><div class="buttonGroup__atx"><button type="button" aria-label="Copy code to clipboard" title="Copy" class="clean-btn"><span class="copyButtonIcons_eSgA" aria-hidden="true"><svg viewBox="0 0 24 24" class="copyButtonIcon_y97N"><path fill="currentColor" d="M19,21H8V7H19M19,5H8A2,2 0 0,0 6,7V21A2,2 0 0,0 8,23H19A2,2 0 0,0 21,21V7A2,2 0 0,0 19,5M16,1H4A2,2 0 0,0 2,3V17H4V3H16V1Z"></path></svg><svg viewBox="0 0 24 24" class="copyButtonSuccessIcon_LjdS"><path fill="currentColor" d="M21,7L9,19L3.5,13.5L4.91,12.09L9,16.17L19.59,5.59L21,7Z"></path></svg></span></button></div></div></div>
<p>To run this UDF, you simply call it with your AOI. Fused will execute the code with the given parameter then return the UDF's output.</p>
<div class="language-python codeBlockContainer_Ckt0 theme-code-block" style="--prism-background-color:hsl(220, 13%, 18%);--prism-color:hsl(220, 14%, 71%)"><div class="codeBlockContent_biex"><pre tabindex="0" class="prism-code language-python codeBlock_bY9V thin-scrollbar" style="background-color:hsl(220, 13%, 18%);color:hsl(220, 14%, 71%);text-shadow:0 1px rgba(0, 0, 0, 0.3)"><code class="codeBlockLines_e6Vv codeBlockLinesWithNumbering_o6Pm"><span class="token-line codeLine_lJS_" style="color:hsl(220, 14%, 71%);text-shadow:0 1px rgba(0, 0, 0, 0.3)"><span class="codeLineNumber_Tfdd"></span><span class="codeLineContent_feaV"><span class="token keyword" style="color:hsl(286, 60%, 67%)">import</span><span class="token plain"> fused</span></span><br></span><span class="token-line codeLine_lJS_" style="color:hsl(220, 14%, 71%);text-shadow:0 1px rgba(0, 0, 0, 0.3)"><span class="codeLineNumber_Tfdd"></span><span class="codeLineContent_feaV"><span class="token plain"></span><span class="token keyword" style="color:hsl(286, 60%, 67%)">import</span><span class="token plain"> geopandas </span><span class="token keyword" style="color:hsl(286, 60%, 67%)">as</span><span class="token plain"> gpd</span></span><br></span><span class="token-line codeLine_lJS_" style="color:hsl(220, 14%, 71%);text-shadow:0 1px rgba(0, 0, 0, 0.3)"><span class="codeLineNumber_Tfdd"></span><span class="codeLineContent_feaV"><span class="token plain"></span><span class="token keyword" style="color:hsl(286, 60%, 67%)">import</span><span class="token plain"> shapely</span></span><br></span><span class="token-line codeLine_lJS_" style="color:hsl(220, 14%, 71%);text-shadow:0 1px rgba(0, 0, 0, 0.3)"><span class="codeLineNumber_Tfdd"></span><span class="codeLineContent_feaV"><span class="token plain" style="display:inline-block"></span></span><br></span><span class="token-line codeLine_lJS_" style="color:hsl(220, 14%, 71%);text-shadow:0 1px rgba(0, 0, 0, 0.3)"><span class="codeLineNumber_Tfdd"></span><span class="codeLineContent_feaV"><span class="token plain">bbox </span><span class="token operator" style="color:hsl(207, 82%, 66%)">=</span><span class="token plain"> gpd</span><span class="token punctuation" style="color:hsl(220, 14%, 71%)">.</span><span class="token plain">GeoDataFrame</span><span class="token punctuation" style="color:hsl(220, 14%, 71%)">(</span><span class="token plain">geometry</span><span class="token operator" style="color:hsl(207, 82%, 66%)">=</span><span class="token punctuation" style="color:hsl(220, 14%, 71%)">[</span><span class="token plain">shapely</span><span class="token punctuation" style="color:hsl(220, 14%, 71%)">.</span><span class="token plain">box</span><span class="token punctuation" style="color:hsl(220, 14%, 71%)">(</span><span class="token operator" style="color:hsl(207, 82%, 66%)">-</span><span class="token number" style="color:hsl(29, 54%, 61%)">73.9847</span><span class="token punctuation" style="color:hsl(220, 14%, 71%)">,</span><span class="token plain"> </span><span class="token number" style="color:hsl(29, 54%, 61%)">40.7666</span><span class="token punctuation" style="color:hsl(220, 14%, 71%)">,</span><span class="token plain"> </span><span class="token operator" style="color:hsl(207, 82%, 66%)">-</span><span class="token number" style="color:hsl(29, 54%, 61%)">73.9810</span><span class="token punctuation" style="color:hsl(220, 14%, 71%)">,</span><span class="token plain"> </span><span class="token number" style="color:hsl(29, 54%, 61%)">40.7694</span><span class="token punctuation" style="color:hsl(220, 14%, 71%)">)</span><span class="token punctuation" style="color:hsl(220, 14%, 71%)">]</span><span class="token punctuation" style="color:hsl(220, 14%, 71%)">,</span><span class="token plain"> crs</span><span class="token operator" style="color:hsl(207, 82%, 66%)">=</span><span class="token number" style="color:hsl(29, 54%, 61%)">4326</span><span class="token punctuation" style="color:hsl(220, 14%, 71%)">)</span><span class="token plain"></span></span><br></span><span class="token-line codeLine_lJS_" style="color:hsl(220, 14%, 71%);text-shadow:0 1px rgba(0, 0, 0, 0.3)"><span class="codeLineNumber_Tfdd"></span><span class="codeLineContent_feaV"><span class="token plain" style="display:inline-block"></span></span><br></span><span class="token-line codeLine_lJS_" style="color:hsl(220, 14%, 71%);text-shadow:0 1px rgba(0, 0, 0, 0.3)"><span class="codeLineNumber_Tfdd"></span><span class="codeLineContent_feaV"><span class="token plain">fused</span><span class="token punctuation" style="color:hsl(220, 14%, 71%)">.</span><span class="token plain">run</span><span class="token punctuation" style="color:hsl(220, 14%, 71%)">(</span><span class="token plain">udf</span><span class="token punctuation" style="color:hsl(220, 14%, 71%)">,</span><span class="token plain"> bbox</span><span class="token operator" style="color:hsl(207, 82%, 66%)">=</span><span class="token plain">bbox</span><span class="token punctuation" style="color:hsl(220, 14%, 71%)">)</span></span><br></span></code></pre><div class="buttonGroup__atx"><button type="button" aria-label="Copy code to clipboard" title="Copy" class="clean-btn"><span class="copyButtonIcons_eSgA" aria-hidden="true"><svg viewBox="0 0 24 24" class="copyButtonIcon_y97N"><path fill="currentColor" d="M19,21H8V7H19M19,5H8A2,2 0 0,0 6,7V21A2,2 0 0,0 8,23H19A2,2 0 0,0 21,21V7A2,2 0 0,0 19,5M16,1H4A2,2 0 0,0 2,3V17H4V3H16V1Z"></path></svg><svg viewBox="0 0 24 24" class="copyButtonSuccessIcon_LjdS"><path fill="currentColor" d="M21,7L9,19L3.5,13.5L4.91,12.09L9,16.17L19.59,5.59L21,7Z"></path></svg></span></button></div></div></div>
<p>This will return a GeoDataFrame with the geometry of the Place, the <code>primary_name</code> of the building it falls within, and other attributes as defined in the UDF's return statement.</p>
<p>The output should look like this:</p>
<div class="language-python codeBlockContainer_Ckt0 theme-code-block" style="--prism-background-color:hsl(220, 13%, 18%);--prism-color:hsl(220, 14%, 71%)"><div class="codeBlockContent_biex"><pre tabindex="0" class="prism-code language-python codeBlock_bY9V thin-scrollbar" style="background-color:hsl(220, 13%, 18%);color:hsl(220, 14%, 71%);text-shadow:0 1px rgba(0, 0, 0, 0.3)"><code class="codeBlockLines_e6Vv codeBlockLinesWithNumbering_o6Pm"><span class="token-line codeLine_lJS_" style="color:hsl(220, 14%, 71%);text-shadow:0 1px rgba(0, 0, 0, 0.3)"><span class="codeLineNumber_Tfdd"></span><span class="codeLineContent_feaV"><span class="token plain">        </span><span class="token builtin" style="color:hsl(95, 38%, 62%)">id</span><span class="token plain">	                                names                                                   primary_name	    geometry</span></span><br></span><span class="token-line codeLine_lJS_" style="color:hsl(220, 14%, 71%);text-shadow:0 1px rgba(0, 0, 0, 0.3)"><span class="codeLineNumber_Tfdd"></span><span class="codeLineContent_feaV"><span class="token plain"></span><span class="token number" style="color:hsl(29, 54%, 61%)">3883</span><span class="token plain">	08f2a100d65160860308e7269804dcb7	</span><span class="token punctuation" style="color:hsl(220, 14%, 71%)">{</span><span class="token string" style="color:hsl(95, 38%, 62%)">'common'</span><span class="token punctuation" style="color:hsl(220, 14%, 71%)">:</span><span class="token plain"> </span><span class="token boolean" style="color:hsl(29, 54%, 61%)">None</span><span class="token punctuation" style="color:hsl(220, 14%, 71%)">,</span><span class="token plain"> </span><span class="token string" style="color:hsl(95, 38%, 62%)">'primary'</span><span class="token punctuation" style="color:hsl(220, 14%, 71%)">:</span><span class="token plain"> </span><span class="token string" style="color:hsl(95, 38%, 62%)">'Alamo Rent A Car'</span><span class="token punctuation" style="color:hsl(220, 14%, 71%)">.</span><span class="token punctuation" style="color:hsl(220, 14%, 71%)">.</span><span class="token punctuation" style="color:hsl(220, 14%, 71%)">.</span><span class="token plain">	The Sheffield </span><span class="token number" style="color:hsl(29, 54%, 61%)">57</span><span class="token plain">    POINT </span><span class="token punctuation" style="color:hsl(220, 14%, 71%)">(</span><span class="token operator" style="color:hsl(207, 82%, 66%)">-</span><span class="token number" style="color:hsl(29, 54%, 61%)">73.98404</span><span class="token plain"> </span><span class="token number" style="color:hsl(29, 54%, 61%)">40.76661</span><span class="token punctuation" style="color:hsl(220, 14%, 71%)">)</span><span class="token plain"></span></span><br></span><span class="token-line codeLine_lJS_" style="color:hsl(220, 14%, 71%);text-shadow:0 1px rgba(0, 0, 0, 0.3)"><span class="codeLineNumber_Tfdd"></span><span class="codeLineContent_feaV"><span class="token plain"></span><span class="token number" style="color:hsl(29, 54%, 61%)">3884</span><span class="token plain">	08f2a100d65160860306e05f63f3cbaf	</span><span class="token punctuation" style="color:hsl(220, 14%, 71%)">{</span><span class="token string" style="color:hsl(95, 38%, 62%)">'common'</span><span class="token punctuation" style="color:hsl(220, 14%, 71%)">:</span><span class="token plain"> </span><span class="token boolean" style="color:hsl(29, 54%, 61%)">None</span><span class="token punctuation" style="color:hsl(220, 14%, 71%)">,</span><span class="token plain"> </span><span class="token string" style="color:hsl(95, 38%, 62%)">'primary'</span><span class="token punctuation" style="color:hsl(220, 14%, 71%)">:</span><span class="token plain"> 'National Car Rent</span><span class="token punctuation" style="color:hsl(220, 14%, 71%)">.</span><span class="token punctuation" style="color:hsl(220, 14%, 71%)">.</span><span class="token punctuation" style="color:hsl(220, 14%, 71%)">.</span><span class="token plain">	The Sheffield </span><span class="token number" style="color:hsl(29, 54%, 61%)">57</span><span class="token plain">    POINT </span><span class="token punctuation" style="color:hsl(220, 14%, 71%)">(</span><span class="token operator" style="color:hsl(207, 82%, 66%)">-</span><span class="token number" style="color:hsl(29, 54%, 61%)">73.98403</span><span class="token plain"> </span><span class="token number" style="color:hsl(29, 54%, 61%)">40.76661</span><span class="token punctuation" style="color:hsl(220, 14%, 71%)">)</span><span class="token plain"></span></span><br></span><span class="token-line codeLine_lJS_" style="color:hsl(220, 14%, 71%);text-shadow:0 1px rgba(0, 0, 0, 0.3)"><span class="codeLineNumber_Tfdd"></span><span class="codeLineContent_feaV"><span class="token plain"></span><span class="token number" style="color:hsl(29, 54%, 61%)">3896</span><span class="token plain">	08f2a100d6516b110387be8074670bfa	</span><span class="token punctuation" style="color:hsl(220, 14%, 71%)">{</span><span class="token string" style="color:hsl(95, 38%, 62%)">'common'</span><span class="token punctuation" style="color:hsl(220, 14%, 71%)">:</span><span class="token plain"> </span><span class="token boolean" style="color:hsl(29, 54%, 61%)">None</span><span class="token punctuation" style="color:hsl(220, 14%, 71%)">,</span><span class="token plain"> </span><span class="token string" style="color:hsl(95, 38%, 62%)">'primary'</span><span class="token punctuation" style="color:hsl(220, 14%, 71%)">:</span><span class="token plain"> </span><span class="token string" style="color:hsl(95, 38%, 62%)">'Quality Fashion'</span><span class="token punctuation" style="color:hsl(220, 14%, 71%)">,</span><span class="token punctuation" style="color:hsl(220, 14%, 71%)">.</span><span class="token punctuation" style="color:hsl(220, 14%, 71%)">.</span><span class="token punctuation" style="color:hsl(220, 14%, 71%)">.</span><span class="token plain">	Hearst Tower	    POINT </span><span class="token punctuation" style="color:hsl(220, 14%, 71%)">(</span><span class="token operator" style="color:hsl(207, 82%, 66%)">-</span><span class="token number" style="color:hsl(29, 54%, 61%)">73.98370</span><span class="token plain"> </span><span class="token number" style="color:hsl(29, 54%, 61%)">40.76660</span><span class="token punctuation" style="color:hsl(220, 14%, 71%)">)</span><span class="token plain"></span></span><br></span><span class="token-line codeLine_lJS_" style="color:hsl(220, 14%, 71%);text-shadow:0 1px rgba(0, 0, 0, 0.3)"><span class="codeLineNumber_Tfdd"></span><span class="codeLineContent_feaV"><span class="token plain"></span><span class="token number" style="color:hsl(29, 54%, 61%)">3898</span><span class="token plain">	08f2a100d65147290359c345582a702e	</span><span class="token punctuation" style="color:hsl(220, 14%, 71%)">{</span><span class="token string" style="color:hsl(95, 38%, 62%)">'common'</span><span class="token punctuation" style="color:hsl(220, 14%, 71%)">:</span><span class="token plain"> </span><span class="token boolean" style="color:hsl(29, 54%, 61%)">None</span><span class="token punctuation" style="color:hsl(220, 14%, 71%)">,</span><span class="token plain"> </span><span class="token string" style="color:hsl(95, 38%, 62%)">'primary'</span><span class="token punctuation" style="color:hsl(220, 14%, 71%)">:</span><span class="token plain"> 'House Beautiful M</span><span class="token punctuation" style="color:hsl(220, 14%, 71%)">.</span><span class="token punctuation" style="color:hsl(220, 14%, 71%)">.</span><span class="token punctuation" style="color:hsl(220, 14%, 71%)">.</span><span class="token plain">	Hearst Tower	    POINT </span><span class="token punctuation" style="color:hsl(220, 14%, 71%)">(</span><span class="token operator" style="color:hsl(207, 82%, 66%)">-</span><span class="token number" style="color:hsl(29, 54%, 61%)">73.98338</span><span class="token plain"> </span><span class="token number" style="color:hsl(29, 54%, 61%)">40.76664</span><span class="token punctuation" style="color:hsl(220, 14%, 71%)">)</span></span><br></span></code></pre><div class="buttonGroup__atx"><button type="button" aria-label="Copy code to clipboard" title="Copy" class="clean-btn"><span class="copyButtonIcons_eSgA" aria-hidden="true"><svg viewBox="0 0 24 24" class="copyButtonIcon_y97N"><path fill="currentColor" d="M19,21H8V7H19M19,5H8A2,2 0 0,0 6,7V21A2,2 0 0,0 8,23H19A2,2 0 0,0 21,21V7A2,2 0 0,0 19,5M16,1H4A2,2 0 0,0 2,3V17H4V3H16V1Z"></path></svg><svg viewBox="0 0 24 24" class="copyButtonSuccessIcon_LjdS"><path fill="currentColor" d="M21,7L9,19L3.5,13.5L4.91,12.09L9,16.17L19.59,5.59L21,7Z"></path></svg></span></button></div></div></div>
<!-- -->
<div style="width:100%;height:100%" class="video__player"></div>
<h2 class="anchor anchorWithStickyNavbar_LWe7" id="step-3-write-a-custom-udf-to-join-buildings-with-the-nsi-dataset">Step 3: Write a Custom UDF to join Buildings with the NSI dataset<a href="https://docs-staging.fused.io/pr/532/blog/partnering-with-overture/#step-3-write-a-custom-udf-to-join-buildings-with-the-nsi-dataset" class="hash-link" aria-label="Direct link to Step 3: Write a Custom UDF to join Buildings with the NSI dataset" title="Direct link to Step 3: Write a Custom UDF to join Buildings with the NSI dataset">​</a></h2>
<p>As a second example, you can also enrich the Overture Buildings dataset with metadata data from the National Structure Inventory (NSI) API. The NSI API offers point data on buildings in the U.S. that is relevant to hazard analyses.</p>
<p>This UDF loads the Overture and NSI datasets, performs a spatial join to enrich the building polygons with hazard metadata, and returns the enriched GeoDataFrame. It can be used within a larger analysis workflow to enrich building polygons to calculate risk indices. You can read more about performing a point in polygon operation to enrich Overture Buildings with NSI <a href="https://docs-staging.fused.io/pr/532/user-guide/transform/geospatial/point-in-polygon/">here</a>.</p>
<div class="language-python codeBlockContainer_Ckt0 theme-code-block" style="--prism-background-color:hsl(220, 13%, 18%);--prism-color:hsl(220, 14%, 71%)"><div class="codeBlockContent_biex"><pre tabindex="0" class="prism-code language-python codeBlock_bY9V thin-scrollbar" style="background-color:hsl(220, 13%, 18%);color:hsl(220, 14%, 71%);text-shadow:0 1px rgba(0, 0, 0, 0.3)"><code class="codeBlockLines_e6Vv codeBlockLinesWithNumbering_o6Pm"><span class="token-line codeLine_lJS_" style="color:hsl(220, 14%, 71%);text-shadow:0 1px rgba(0, 0, 0, 0.3)"><span class="codeLineNumber_Tfdd"></span><span class="codeLineContent_feaV"><span class="token decorator annotation punctuation" style="color:hsl(220, 14%, 71%)">@fused</span><span class="token decorator annotation punctuation" style="color:hsl(220, 14%, 71%)">.</span><span class="token decorator annotation punctuation" style="color:hsl(220, 14%, 71%)">udf</span><span class="token plain"></span></span><br></span><span class="token-line codeLine_lJS_" style="color:hsl(220, 14%, 71%);text-shadow:0 1px rgba(0, 0, 0, 0.3)"><span class="codeLineNumber_Tfdd"></span><span class="codeLineContent_feaV"><span class="token plain"></span><span class="token keyword" style="color:hsl(286, 60%, 67%)">def</span><span class="token plain"> </span><span class="token function" style="color:hsl(207, 82%, 66%)">udf</span><span class="token punctuation" style="color:hsl(220, 14%, 71%)">(</span><span class="token plain">bbox</span><span class="token punctuation" style="color:hsl(220, 14%, 71%)">:</span><span class="token plain"> fused</span><span class="token punctuation" style="color:hsl(220, 14%, 71%)">.</span><span class="token plain">types</span><span class="token punctuation" style="color:hsl(220, 14%, 71%)">.</span><span class="token plain">TileGDF </span><span class="token operator" style="color:hsl(207, 82%, 66%)">=</span><span class="token plain"> </span><span class="token boolean" style="color:hsl(29, 54%, 61%)">None</span><span class="token punctuation" style="color:hsl(220, 14%, 71%)">)</span><span class="token punctuation" style="color:hsl(220, 14%, 71%)">:</span><span class="token plain"></span></span><br></span><span class="token-line codeLine_lJS_" style="color:hsl(220, 14%, 71%);text-shadow:0 1px rgba(0, 0, 0, 0.3)"><span class="codeLineNumber_Tfdd"></span><span class="codeLineContent_feaV"><span class="token plain">    </span><span class="token keyword" style="color:hsl(286, 60%, 67%)">import</span><span class="token plain"> geopandas </span><span class="token keyword" style="color:hsl(286, 60%, 67%)">as</span><span class="token plain"> gpd</span></span><br></span><span class="token-line codeLine_lJS_" style="color:hsl(220, 14%, 71%);text-shadow:0 1px rgba(0, 0, 0, 0.3)"><span class="codeLineNumber_Tfdd"></span><span class="codeLineContent_feaV"><span class="token plain">    </span><span class="token keyword" style="color:hsl(286, 60%, 67%)">import</span><span class="token plain"> pandas </span><span class="token keyword" style="color:hsl(286, 60%, 67%)">as</span><span class="token plain"> pd</span></span><br></span><span class="token-line codeLine_lJS_" style="color:hsl(220, 14%, 71%);text-shadow:0 1px rgba(0, 0, 0, 0.3)"><span class="codeLineNumber_Tfdd"></span><span class="codeLineContent_feaV"><span class="token plain">    </span><span class="token keyword" style="color:hsl(286, 60%, 67%)">import</span><span class="token plain"> requests</span></span><br></span><span class="token-line codeLine_lJS_" style="color:hsl(220, 14%, 71%);text-shadow:0 1px rgba(0, 0, 0, 0.3)"><span class="codeLineNumber_Tfdd"></span><span class="codeLineContent_feaV"><span class="token plain" style="display:inline-block"></span></span><br></span><span class="token-line codeLine_lJS_" style="color:hsl(220, 14%, 71%);text-shadow:0 1px rgba(0, 0, 0, 0.3)"><span class="codeLineNumber_Tfdd"></span><span class="codeLineContent_feaV"><span class="token plain">    utils </span><span class="token operator" style="color:hsl(207, 82%, 66%)">=</span><span class="token plain"> fused</span><span class="token punctuation" style="color:hsl(220, 14%, 71%)">.</span><span class="token plain">load</span><span class="token punctuation" style="color:hsl(220, 14%, 71%)">(</span><span class="token string" style="color:hsl(95, 38%, 62%)">"https://github.com/fusedio/udfs/tree/e1fefb7/public/Overture_Maps_Example/"</span><span class="token punctuation" style="color:hsl(220, 14%, 71%)">)</span><span class="token punctuation" style="color:hsl(220, 14%, 71%)">.</span><span class="token plain">utils</span></span><br></span><span class="token-line codeLine_lJS_" style="color:hsl(220, 14%, 71%);text-shadow:0 1px rgba(0, 0, 0, 0.3)"><span class="codeLineNumber_Tfdd"></span><span class="codeLineContent_feaV"><span class="token plain" style="display:inline-block"></span></span><br></span><span class="token-line codeLine_lJS_" style="color:hsl(220, 14%, 71%);text-shadow:0 1px rgba(0, 0, 0, 0.3)"><span class="codeLineNumber_Tfdd"></span><span class="codeLineContent_feaV"><span class="token plain">    </span><span class="token comment" style="color:hsl(220, 10%, 40%)"># 1. Load Overture Buildings</span><span class="token plain"></span></span><br></span><span class="token-line codeLine_lJS_" style="color:hsl(220, 14%, 71%);text-shadow:0 1px rgba(0, 0, 0, 0.3)"><span class="codeLineNumber_Tfdd"></span><span class="codeLineContent_feaV"><span class="token plain">    gdf_overture </span><span class="token operator" style="color:hsl(207, 82%, 66%)">=</span><span class="token plain"> utils</span><span class="token punctuation" style="color:hsl(220, 14%, 71%)">.</span><span class="token plain">get_overture</span><span class="token punctuation" style="color:hsl(220, 14%, 71%)">(</span><span class="token plain">bbox</span><span class="token operator" style="color:hsl(207, 82%, 66%)">=</span><span class="token plain">bbox</span><span class="token punctuation" style="color:hsl(220, 14%, 71%)">)</span><span class="token plain"></span></span><br></span><span class="token-line codeLine_lJS_" style="color:hsl(220, 14%, 71%);text-shadow:0 1px rgba(0, 0, 0, 0.3)"><span class="codeLineNumber_Tfdd"></span><span class="codeLineContent_feaV"><span class="token plain" style="display:inline-block"></span></span><br></span><span class="token-line codeLine_lJS_" style="color:hsl(220, 14%, 71%);text-shadow:0 1px rgba(0, 0, 0, 0.3)"><span class="codeLineNumber_Tfdd"></span><span class="codeLineContent_feaV"><span class="token plain">    </span><span class="token comment" style="color:hsl(220, 10%, 40%)"># 2. Load NSI from API</span><span class="token plain"></span></span><br></span><span class="token-line codeLine_lJS_" style="color:hsl(220, 14%, 71%);text-shadow:0 1px rgba(0, 0, 0, 0.3)"><span class="codeLineNumber_Tfdd"></span><span class="codeLineContent_feaV"><span class="token plain">    response </span><span class="token operator" style="color:hsl(207, 82%, 66%)">=</span><span class="token plain"> requests</span><span class="token punctuation" style="color:hsl(220, 14%, 71%)">.</span><span class="token plain">post</span><span class="token punctuation" style="color:hsl(220, 14%, 71%)">(</span><span class="token plain"></span></span><br></span><span class="token-line codeLine_lJS_" style="color:hsl(220, 14%, 71%);text-shadow:0 1px rgba(0, 0, 0, 0.3)"><span class="codeLineNumber_Tfdd"></span><span class="codeLineContent_feaV"><span class="token plain">        url</span><span class="token operator" style="color:hsl(207, 82%, 66%)">=</span><span class="token string" style="color:hsl(95, 38%, 62%)">"https://nsi.sec.usace.army.mil/nsiapi/structures?fmt=fc"</span><span class="token punctuation" style="color:hsl(220, 14%, 71%)">,</span><span class="token plain"></span></span><br></span><span class="token-line codeLine_lJS_" style="color:hsl(220, 14%, 71%);text-shadow:0 1px rgba(0, 0, 0, 0.3)"><span class="codeLineNumber_Tfdd"></span><span class="codeLineContent_feaV"><span class="token plain">        json</span><span class="token operator" style="color:hsl(207, 82%, 66%)">=</span><span class="token plain">bbox</span><span class="token punctuation" style="color:hsl(220, 14%, 71%)">.</span><span class="token plain">__geo_interface__</span><span class="token punctuation" style="color:hsl(220, 14%, 71%)">,</span><span class="token plain"></span></span><br></span><span class="token-line codeLine_lJS_" style="color:hsl(220, 14%, 71%);text-shadow:0 1px rgba(0, 0, 0, 0.3)"><span class="codeLineNumber_Tfdd"></span><span class="codeLineContent_feaV"><span class="token plain">    </span><span class="token punctuation" style="color:hsl(220, 14%, 71%)">)</span><span class="token plain"></span></span><br></span><span class="token-line codeLine_lJS_" style="color:hsl(220, 14%, 71%);text-shadow:0 1px rgba(0, 0, 0, 0.3)"><span class="codeLineNumber_Tfdd"></span><span class="codeLineContent_feaV"><span class="token plain" style="display:inline-block"></span></span><br></span><span class="token-line codeLine_lJS_" style="color:hsl(220, 14%, 71%);text-shadow:0 1px rgba(0, 0, 0, 0.3)"><span class="codeLineNumber_Tfdd"></span><span class="codeLineContent_feaV"><span class="token plain">    </span><span class="token comment" style="color:hsl(220, 10%, 40%)"># 3. Create NSI gdf</span><span class="token plain"></span></span><br></span><span class="token-line codeLine_lJS_" style="color:hsl(220, 14%, 71%);text-shadow:0 1px rgba(0, 0, 0, 0.3)"><span class="codeLineNumber_Tfdd"></span><span class="codeLineContent_feaV"><span class="token plain">    gdf </span><span class="token operator" style="color:hsl(207, 82%, 66%)">=</span><span class="token plain"> gpd</span><span class="token punctuation" style="color:hsl(220, 14%, 71%)">.</span><span class="token plain">GeoDataFrame</span><span class="token punctuation" style="color:hsl(220, 14%, 71%)">.</span><span class="token plain">from_features</span><span class="token punctuation" style="color:hsl(220, 14%, 71%)">(</span><span class="token plain">response</span><span class="token punctuation" style="color:hsl(220, 14%, 71%)">.</span><span class="token plain">json</span><span class="token punctuation" style="color:hsl(220, 14%, 71%)">(</span><span class="token punctuation" style="color:hsl(220, 14%, 71%)">)</span><span class="token punctuation" style="color:hsl(220, 14%, 71%)">[</span><span class="token string" style="color:hsl(95, 38%, 62%)">"features"</span><span class="token punctuation" style="color:hsl(220, 14%, 71%)">]</span><span class="token punctuation" style="color:hsl(220, 14%, 71%)">)</span><span class="token plain"></span></span><br></span><span class="token-line codeLine_lJS_" style="color:hsl(220, 14%, 71%);text-shadow:0 1px rgba(0, 0, 0, 0.3)"><span class="codeLineNumber_Tfdd"></span><span class="codeLineContent_feaV"><span class="token plain" style="display:inline-block"></span></span><br></span><span class="token-line codeLine_lJS_" style="color:hsl(220, 14%, 71%);text-shadow:0 1px rgba(0, 0, 0, 0.3)"><span class="codeLineNumber_Tfdd"></span><span class="codeLineContent_feaV"><span class="token plain">    </span><span class="token comment" style="color:hsl(220, 10%, 40%)"># 4. Join Overture and NSI</span><span class="token plain"></span></span><br></span><span class="token-line codeLine_lJS_" style="color:hsl(220, 14%, 71%);text-shadow:0 1px rgba(0, 0, 0, 0.3)"><span class="codeLineNumber_Tfdd"></span><span class="codeLineContent_feaV"><span class="token plain">    cols </span><span class="token operator" style="color:hsl(207, 82%, 66%)">=</span><span class="token plain"> </span><span class="token punctuation" style="color:hsl(220, 14%, 71%)">[</span><span class="token string" style="color:hsl(95, 38%, 62%)">"id"</span><span class="token punctuation" style="color:hsl(220, 14%, 71%)">,</span><span class="token string" style="color:hsl(95, 38%, 62%)">"geometry"</span><span class="token punctuation" style="color:hsl(220, 14%, 71%)">,</span><span class="token string" style="color:hsl(95, 38%, 62%)">"metric"</span><span class="token punctuation" style="color:hsl(220, 14%, 71%)">,</span><span class="token string" style="color:hsl(95, 38%, 62%)">"ground_elv_m"</span><span class="token punctuation" style="color:hsl(220, 14%, 71%)">,</span><span class="token string" style="color:hsl(95, 38%, 62%)">"height"</span><span class="token punctuation" style="color:hsl(220, 14%, 71%)">,</span><span class="token string" style="color:hsl(95, 38%, 62%)">"num_floors"</span><span class="token punctuation" style="color:hsl(220, 14%, 71%)">,</span><span class="token string" style="color:hsl(95, 38%, 62%)">"num_story"</span><span class="token punctuation" style="color:hsl(220, 14%, 71%)">]</span><span class="token plain"></span></span><br></span><span class="token-line codeLine_lJS_" style="color:hsl(220, 14%, 71%);text-shadow:0 1px rgba(0, 0, 0, 0.3)"><span class="codeLineNumber_Tfdd"></span><span class="codeLineContent_feaV"><span class="token plain">    join </span><span class="token operator" style="color:hsl(207, 82%, 66%)">=</span><span class="token plain"> gdf_overture</span><span class="token punctuation" style="color:hsl(220, 14%, 71%)">.</span><span class="token plain">sjoin</span><span class="token punctuation" style="color:hsl(220, 14%, 71%)">(</span><span class="token plain">gdf</span><span class="token punctuation" style="color:hsl(220, 14%, 71%)">,</span><span class="token plain"> how</span><span class="token operator" style="color:hsl(207, 82%, 66%)">=</span><span class="token string" style="color:hsl(95, 38%, 62%)">'left'</span><span class="token punctuation" style="color:hsl(220, 14%, 71%)">)</span><span class="token plain"></span></span><br></span><span class="token-line codeLine_lJS_" style="color:hsl(220, 14%, 71%);text-shadow:0 1px rgba(0, 0, 0, 0.3)"><span class="codeLineNumber_Tfdd"></span><span class="codeLineContent_feaV"><span class="token plain">    join</span><span class="token punctuation" style="color:hsl(220, 14%, 71%)">[</span><span class="token string" style="color:hsl(95, 38%, 62%)">"metric"</span><span class="token punctuation" style="color:hsl(220, 14%, 71%)">]</span><span class="token plain"> </span><span class="token operator" style="color:hsl(207, 82%, 66%)">=</span><span class="token plain"> join</span><span class="token punctuation" style="color:hsl(220, 14%, 71%)">.</span><span class="token builtin" style="color:hsl(95, 38%, 62%)">apply</span><span class="token punctuation" style="color:hsl(220, 14%, 71%)">(</span><span class="token keyword" style="color:hsl(286, 60%, 67%)">lambda</span><span class="token plain"> row</span><span class="token punctuation" style="color:hsl(220, 14%, 71%)">:</span><span class="token plain"> row</span><span class="token punctuation" style="color:hsl(220, 14%, 71%)">.</span><span class="token plain">height </span><span class="token keyword" style="color:hsl(286, 60%, 67%)">if</span><span class="token plain"> pd</span><span class="token punctuation" style="color:hsl(220, 14%, 71%)">.</span><span class="token plain">notnull</span><span class="token punctuation" style="color:hsl(220, 14%, 71%)">(</span><span class="token plain">row</span><span class="token punctuation" style="color:hsl(220, 14%, 71%)">.</span><span class="token plain">height</span><span class="token punctuation" style="color:hsl(220, 14%, 71%)">)</span><span class="token plain"> </span><span class="token keyword" style="color:hsl(286, 60%, 67%)">else</span><span class="token plain"> row</span><span class="token punctuation" style="color:hsl(220, 14%, 71%)">.</span><span class="token plain">num_story</span><span class="token operator" style="color:hsl(207, 82%, 66%)">*</span><span class="token number" style="color:hsl(29, 54%, 61%)">3</span><span class="token punctuation" style="color:hsl(220, 14%, 71%)">,</span><span class="token plain"> axis</span><span class="token operator" style="color:hsl(207, 82%, 66%)">=</span><span class="token number" style="color:hsl(29, 54%, 61%)">1</span><span class="token punctuation" style="color:hsl(220, 14%, 71%)">)</span><span class="token plain"></span></span><br></span><span class="token-line codeLine_lJS_" style="color:hsl(220, 14%, 71%);text-shadow:0 1px rgba(0, 0, 0, 0.3)"><span class="codeLineNumber_Tfdd"></span><span class="codeLineContent_feaV"><span class="token plain">    </span><span class="token keyword" style="color:hsl(286, 60%, 67%)">return</span><span class="token plain"> join</span><span class="token punctuation" style="color:hsl(220, 14%, 71%)">[</span><span class="token plain">cols</span><span class="token punctuation" style="color:hsl(220, 14%, 71%)">]</span><span class="token plain"></span></span><br></span><span class="token-line codeLine_lJS_" style="color:hsl(220, 14%, 71%);text-shadow:0 1px rgba(0, 0, 0, 0.3)"><span class="codeLineNumber_Tfdd"></span><span class="codeLineContent_feaV"><span class="token plain" style="display:inline-block"></span></span><br></span></code></pre><div class="buttonGroup__atx"><button type="button" aria-label="Copy code to clipboard" title="Copy" class="clean-btn"><span class="copyButtonIcons_eSgA" aria-hidden="true"><svg viewBox="0 0 24 24" class="copyButtonIcon_y97N"><path fill="currentColor" d="M19,21H8V7H19M19,5H8A2,2 0 0,0 6,7V21A2,2 0 0,0 8,23H19A2,2 0 0,0 21,21V7A2,2 0 0,0 19,5M16,1H4A2,2 0 0,0 2,3V17H4V3H16V1Z"></path></svg><svg viewBox="0 0 24 24" class="copyButtonSuccessIcon_LjdS"><path fill="currentColor" d="M21,7L9,19L3.5,13.5L4.91,12.09L9,16.17L19.59,5.59L21,7Z"></path></svg></span></button></div></div></div>
<p>The output should look like this:</p>
<div class="language-python codeBlockContainer_Ckt0 theme-code-block" style="--prism-background-color:hsl(220, 13%, 18%);--prism-color:hsl(220, 14%, 71%)"><div class="codeBlockContent_biex"><pre tabindex="0" class="prism-code language-python codeBlock_bY9V thin-scrollbar" style="background-color:hsl(220, 13%, 18%);color:hsl(220, 14%, 71%);text-shadow:0 1px rgba(0, 0, 0, 0.3)"><code class="codeBlockLines_e6Vv codeBlockLinesWithNumbering_o6Pm"><span class="token-line codeLine_lJS_" style="color:hsl(220, 14%, 71%);text-shadow:0 1px rgba(0, 0, 0, 0.3)"><span class="codeLineNumber_Tfdd"></span><span class="codeLineContent_feaV"><span class="token plain" style="display:inline-block"></span></span><br></span><span class="token-line codeLine_lJS_" style="color:hsl(220, 14%, 71%);text-shadow:0 1px rgba(0, 0, 0, 0.3)"><span class="codeLineNumber_Tfdd"></span><span class="codeLineContent_feaV"><span class="token plain">	    </span><span class="token builtin" style="color:hsl(95, 38%, 62%)">id</span><span class="token plain">	                                geometry	                                        val_struct      med_yr_blt  </span><span class="token punctuation" style="color:hsl(220, 14%, 71%)">.</span><span class="token punctuation" style="color:hsl(220, 14%, 71%)">.</span><span class="token punctuation" style="color:hsl(220, 14%, 71%)">.</span><span class="token plain"></span></span><br></span><span class="token-line codeLine_lJS_" style="color:hsl(220, 14%, 71%);text-shadow:0 1px rgba(0, 0, 0, 0.3)"><span class="codeLineNumber_Tfdd"></span><span class="codeLineContent_feaV"><span class="token plain"></span><span class="token number" style="color:hsl(29, 54%, 61%)">24178</span><span class="token plain">	08b2a100d6516fff0200ded2bf849c8a	POLYGON </span><span class="token punctuation" style="color:hsl(220, 14%, 71%)">(</span><span class="token punctuation" style="color:hsl(220, 14%, 71%)">(</span><span class="token operator" style="color:hsl(207, 82%, 66%)">-</span><span class="token number" style="color:hsl(29, 54%, 61%)">73.98375</span><span class="token plain"> </span><span class="token number" style="color:hsl(29, 54%, 61%)">40.76693</span><span class="token punctuation" style="color:hsl(220, 14%, 71%)">,</span><span class="token plain"> </span><span class="token operator" style="color:hsl(207, 82%, 66%)">-</span><span class="token number" style="color:hsl(29, 54%, 61%)">73.98381</span><span class="token plain"> </span><span class="token number" style="color:hsl(29, 54%, 61%)">40.766</span><span class="token punctuation" style="color:hsl(220, 14%, 71%)">.</span><span class="token punctuation" style="color:hsl(220, 14%, 71%)">.</span><span class="token punctuation" style="color:hsl(220, 14%, 71%)">.</span><span class="token plain">	</span><span class="token number" style="color:hsl(29, 54%, 61%)">378633.733</span><span class="token plain">	</span><span class="token number" style="color:hsl(29, 54%, 61%)">1939</span><span class="token plain">	</span><span class="token punctuation" style="color:hsl(220, 14%, 71%)">.</span><span class="token punctuation" style="color:hsl(220, 14%, 71%)">.</span><span class="token punctuation" style="color:hsl(220, 14%, 71%)">.</span><span class="token plain"></span></span><br></span><span class="token-line codeLine_lJS_" style="color:hsl(220, 14%, 71%);text-shadow:0 1px rgba(0, 0, 0, 0.3)"><span class="codeLineNumber_Tfdd"></span><span class="codeLineContent_feaV"><span class="token plain"></span><span class="token number" style="color:hsl(29, 54%, 61%)">24178</span><span class="token plain">	08b2a100d6516fff0200ded2bf849c8a	POLYGON </span><span class="token punctuation" style="color:hsl(220, 14%, 71%)">(</span><span class="token punctuation" style="color:hsl(220, 14%, 71%)">(</span><span class="token operator" style="color:hsl(207, 82%, 66%)">-</span><span class="token number" style="color:hsl(29, 54%, 61%)">73.98375</span><span class="token plain"> </span><span class="token number" style="color:hsl(29, 54%, 61%)">40.76693</span><span class="token punctuation" style="color:hsl(220, 14%, 71%)">,</span><span class="token plain"> </span><span class="token operator" style="color:hsl(207, 82%, 66%)">-</span><span class="token number" style="color:hsl(29, 54%, 61%)">73.98381</span><span class="token plain"> </span><span class="token number" style="color:hsl(29, 54%, 61%)">40.766</span><span class="token punctuation" style="color:hsl(220, 14%, 71%)">.</span><span class="token punctuation" style="color:hsl(220, 14%, 71%)">.</span><span class="token punctuation" style="color:hsl(220, 14%, 71%)">.</span><span class="token plain">	</span><span class="token number" style="color:hsl(29, 54%, 61%)">348190.820</span><span class="token plain">	</span><span class="token number" style="color:hsl(29, 54%, 61%)">1939</span><span class="token plain">	</span><span class="token punctuation" style="color:hsl(220, 14%, 71%)">.</span><span class="token punctuation" style="color:hsl(220, 14%, 71%)">.</span><span class="token punctuation" style="color:hsl(220, 14%, 71%)">.</span><span class="token plain"></span></span><br></span><span class="token-line codeLine_lJS_" style="color:hsl(220, 14%, 71%);text-shadow:0 1px rgba(0, 0, 0, 0.3)"><span class="codeLineNumber_Tfdd"></span><span class="codeLineContent_feaV"><span class="token plain"></span><span class="token number" style="color:hsl(29, 54%, 61%)">24178</span><span class="token plain">	08b2a100d6516fff0200ded2bf849c8a	POLYGON </span><span class="token punctuation" style="color:hsl(220, 14%, 71%)">(</span><span class="token punctuation" style="color:hsl(220, 14%, 71%)">(</span><span class="token operator" style="color:hsl(207, 82%, 66%)">-</span><span class="token number" style="color:hsl(29, 54%, 61%)">73.98375</span><span class="token plain"> </span><span class="token number" style="color:hsl(29, 54%, 61%)">40.76693</span><span class="token punctuation" style="color:hsl(220, 14%, 71%)">,</span><span class="token plain"> </span><span class="token operator" style="color:hsl(207, 82%, 66%)">-</span><span class="token number" style="color:hsl(29, 54%, 61%)">73.98381</span><span class="token plain"> </span><span class="token number" style="color:hsl(29, 54%, 61%)">40.766</span><span class="token punctuation" style="color:hsl(220, 14%, 71%)">.</span><span class="token punctuation" style="color:hsl(220, 14%, 71%)">.</span><span class="token punctuation" style="color:hsl(220, 14%, 71%)">.</span><span class="token plain">	</span><span class="token number" style="color:hsl(29, 54%, 61%)">378633.733</span><span class="token plain">	</span><span class="token number" style="color:hsl(29, 54%, 61%)">1939</span><span class="token plain">	</span><span class="token punctuation" style="color:hsl(220, 14%, 71%)">.</span><span class="token punctuation" style="color:hsl(220, 14%, 71%)">.</span><span class="token punctuation" style="color:hsl(220, 14%, 71%)">.</span></span><br></span></code></pre><div class="buttonGroup__atx"><button type="button" aria-label="Copy code to clipboard" title="Copy" class="clean-btn"><span class="copyButtonIcons_eSgA" aria-hidden="true"><svg viewBox="0 0 24 24" class="copyButtonIcon_y97N"><path fill="currentColor" d="M19,21H8V7H19M19,5H8A2,2 0 0,0 6,7V21A2,2 0 0,0 8,23H19A2,2 0 0,0 21,21V7A2,2 0 0,0 19,5M16,1H4A2,2 0 0,0 2,3V17H4V3H16V1Z"></path></svg><svg viewBox="0 0 24 24" class="copyButtonSuccessIcon_LjdS"><path fill="currentColor" d="M21,7L9,19L3.5,13.5L4.91,12.09L9,16.17L19.59,5.59L21,7Z"></path></svg></span></button></div></div></div>
<div style="width:100%;height:100%" class="video__player"></div>
<h2 class="anchor anchorWithStickyNavbar_LWe7" id="conclusion">Conclusion<a href="https://docs-staging.fused.io/pr/532/blog/partnering-with-overture/#conclusion" class="hash-link" aria-label="Direct link to Conclusion" title="Direct link to Conclusion">​</a></h2>
<p>In this short tutorial, we outlined how you can integrate Overture data into your workflows using Fused. We saw how you can use Fused to load the data, write a custom Python workflow, and run it for a custom AOI. We hope the these foundational pieces help you see how you can unlock the full potential of Overture Maps and start creating your own workflows to enrich your own datasets.</p>]]></content>
        <author>
            <name>Jennings Anderson</name>
            <uri>https://www.linkedin.com/in/jenningsanderson/</uri>
        </author>
        <author>
            <name>Plinio Guzman</name>
            <uri>https://www.linkedin.com/in/plinioguzman/</uri>
        </author>
        <category label="overture" term="overture"/>
        <category label="spatial" term="spatial"/>
        <category label="join" term="join"/>
    </entry>
    <entry>
        <title type="html"><![CDATA[How Pilot Fiber creates internal tools to support telecom operations]]></title>
        <id>https://docs-staging.fused.io/pr/532/blog/how-pilot-fiber-creates-internal-tools-to-support-telecom-operations/</id>
        <link href="https://docs-staging.fused.io/pr/532/blog/how-pilot-fiber-creates-internal-tools-to-support-telecom-operations/"/>
        <updated>2025-01-23T00:00:00.000Z</updated>
        <summary type="html"><![CDATA[TL;DR Pilot Fiber creates apps with Fused to quickly identify and resolve service interruptions for its New York City customers.]]></summary>
        <content type="html"><![CDATA[<p><strong>TL;DR Pilot Fiber creates apps with Fused to quickly identify and resolve service interruptions for its New York City customers.</strong></p>
<!-- -->
<div style="height:360px;width:100%" class="video__player"></div>
<br>
<p><a href="https://www.pilotfiber.com/" target="_blank" rel="noopener noreferrer">Pilot Fiber</a> is a commercial <a href="https://en.wikipedia.org/wiki/Internet_service_provider" target="_blank" rel="noopener noreferrer">Internet Service Provider</a> primarily in New York City. Our primary value proposition in competing with national-scale ISPs is our commitment to customer experience–we are fast and flexible in responding to customer needs in all aspects of the business:</p>
<ul>
<li>During the sales process, we aim to answer customer questions quickly and accurately, including technical details and routing.</li>
<li>When designing our deployment into new buildings, we equip our engineers with as much detail as possible before they arrive on-site to maximize the efficiency of time spent with building engineers.</li>
<li>When an incident interrupts a service we will immediately jump into action to address the cause and restore connectivity.</li>
</ul>
<p>We use Fused to support all of these areas, and this post focuses on the last one: incident management.</p>
<ul>
<li>What happens when a service interruption occurs?</li>
<li>How do we identify the likely location of an issue and get to a solution as quickly as possible?</li>
</ul>
<!-- -->
<h3 class="anchor anchorWithStickyNavbar_LWe7" id="the-problem-why-speed-matters">The Problem: Why Speed Matters<a href="https://docs-staging.fused.io/pr/532/blog/how-pilot-fiber-creates-internal-tools-to-support-telecom-operations/#the-problem-why-speed-matters" class="hash-link" aria-label="Direct link to The Problem: Why Speed Matters" title="Direct link to The Problem: Why Speed Matters">​</a></h3>
<p>One of the most common ways a customer's service can be impacted is through damage to the physical fiber cables connecting them back to a data center and the internet. Almost all fiber optic cables in Manhattan run through a shared manhole-and-duct system beneath the streets. As such, road construction or work by other providers in a manhole has the potential to damage the equipment of multiple providers. When that damage occurs, it is first come, first served to get your network repaired and customers back online. Field teams from multiple providers can't work in the same manhole simultaneously, so being onsite first and ready to repair can mean a difference of hours in customer downtime.</p>
<p>Because of this, Pilot uses an active fiber monitoring system across our network. Sophisticated devices in our data centers are constantly shooting light down the fibers in our network looking for potential damage. Those devices return a reflectance signature from the fiber and compare it with a reference “snapshot” created when that fiber was initially installed in a building.</p>
<p>When an anomaly is registered, it immediately fires an alert giving a fiber route and distance to the potential problem (i.e. “There is unexpected light loss on the fiber serving 1234 5th Avenue at a distance of 2.351 kilometers from the data center.”). When this happens, our engineering and support teams analyze the data within minutes to determine the issue's exact location and, if necessary, get crews headed to the site to begin repairs.</p>
<div style="width:100%;height:100%" class="video__player"></div>
<br>
<h2 class="anchor anchorWithStickyNavbar_LWe7" id="the-process-fused-as-the-glue-layer">The Process: Fused As The Glue-Layer<a href="https://docs-staging.fused.io/pr/532/blog/how-pilot-fiber-creates-internal-tools-to-support-telecom-operations/#the-process-fused-as-the-glue-layer" class="hash-link" aria-label="Direct link to The Process: Fused As The Glue-Layer" title="Direct link to The Process: Fused As The Glue-Layer">​</a></h2>
<p>Historically, this analysis has required the attention of an Outside Plant engineer with access to specialized software and network knowledge, regardless of the time of day or day of the week. This bottleneck is not ideal when time is of the essence, even at 3 a.m. So today, we are creating a more sophisticated future using Fused to make this information accessible to more support team members and make our response times even faster.</p>
<p>Using Fused as a back-end glue layer, we built a web app allowing users to select a route and distance and calculate where the system has registered the fault. We also created a simple user interface that provides the user a view of nearby network infrastructure and automatically generates the reports field crews would need to complete repairs based on that nearby infrastructure.</p>
<p>The workflow requires a series of calls to UDFs that act as intermediaries to a <a href="https://www.postgresql.org/" target="_blank" rel="noopener noreferrer">Postgres</a>/<a href="https://postgis.net/" target="_blank" rel="noopener noreferrer">PostGIS</a> database, which in turn is sourcing data from other internal sources. This structure allows us to easily keep the business logic organized at the UDF layer while limiting the scope of data access and security via Postgres and internal processes maintaining the sync.</p>
<p>The basic process is seen below:</p>
<!-- -->
<div style="text-align:center"><img src="https://docs-staging.fused.io/pr/532/assets/images/kyle1-30eda2325c15afb280926c5ac72fc818.png" alt="File"></div>
<p><em>Workflow diagram.</em></p>
<p>Two separate flows are initiated when the user inputs a route and a distance to process. One retrieves the selected route to load onto the Mapbox-based map within the app, while the second kicks off a processing chain to analyze the fault information. This chain utilizes UDFs that assist in isolating the location of the fault and relevant nearby infrastructure and adding elements to the map display to assist the user in visualizing what may be occurring.</p>
<!-- -->
<div style="text-align:center"><img src="https://docs-staging.fused.io/pr/532/assets/images/kyle2-a52573fdb14a66db182c087c31aacf11.png" alt="File"></div>
<p><em>UDF to find fault location.</em></p>
<p>If you consider the cables you see strung along utility poles, they are not perfectly straight: they can sag, bend, go up and down, and have coils of extra cable along the way. The same is true of our cables under the streets. All of those variations add distance to the run, which needs to be considered when determining where a fault is likely to be located.</p>
<p>Taking those variables into account, we use Fused to apply <a href="http://geopandas.org/" target="_blank" rel="noopener noreferrer">GeoPandas</a> and PostGIS spatial functionality to assess where the fault is most likely to be located. After calculating that location, the tool loads splice cases along that route that point to where problems are most likely to have occurred, and slack loops built into the route to make the user aware of nearby capacity that could enable faster repair of more significant damage. We next determine which splice cases are closest to the likely damage point and if any of those are within 150m of the automated distance calculation. These manholes would be the first locations our field teams would be sent to investigate.</p>
<p>Once we have determined the relevant nearby splice cases, we use another UDF to build a CSV that reproduces what a splice report export looks like from our primary fiber mapping software. This report details what cables enter the case, what fibers on which cables are spliced to which fibers on other cables, and what building and/or customer circuits are being carried along which fibers. Fused then integrates with a separate process we previously built to process that CSV into the final file that goes to the field teams. This gives them the confidence to quickly address issues while minimizing the risk of damaging other circuits, as well as giving them the information needed to monitor the status of other services in the case while they work.</p>
<h2 class="anchor anchorWithStickyNavbar_LWe7" id="the-impact-of-fused">The Impact of Fused<a href="https://docs-staging.fused.io/pr/532/blog/how-pilot-fiber-creates-internal-tools-to-support-telecom-operations/#the-impact-of-fused" class="hash-link" aria-label="Direct link to The Impact of Fused" title="Direct link to The Impact of Fused">​</a></h2>
<p>The impact of Fused across this process is many-fold:</p>
<ul>
<li>The ability to easily work with data across several systems.</li>
<li>Centralizing business logic to the UDFs involved eliminates the tendency for this logic to be spread across client-side processes, server-side processes, and possibly the database itself.</li>
<li>Modularization of operations into UDFs. For example, the UDF that generates the splice reports for this process can easily be reused in any other method that requires the same functionality.</li>
<li>The effortless ability for the same UDF to simultaneously serve as a modular processing unit where needed in one workflow and a map service for display in another.</li>
<li>Using Python and standard libraries enables developers who may not be spatial data experts to read, understand, and modify UDFs as necessary.</li>
</ul>
<h2 class="anchor anchorWithStickyNavbar_LWe7" id="conclusion">Conclusion<a href="https://docs-staging.fused.io/pr/532/blog/how-pilot-fiber-creates-internal-tools-to-support-telecom-operations/#conclusion" class="hash-link" aria-label="Direct link to Conclusion" title="Direct link to Conclusion">​</a></h2>
<p>Pilot's success in the market is largely based on our flexibility and responsiveness to customer needs, which is never more important than when physical damage to the network is impacting their service. Within this scenario, Fused is providing a critical layer enabling us to offer more non-technical users access to data in multiple systems through a simple UI that will result in repair teams moving to restore service to our customers as quickly as possible.</p>
<p>Fused is an ideal product for Pilot Fiber in that we can increasingly make highly technical information available in a usable format to additional teams throughout the company in support of our drive to be fast, flexible, and accurate in delivering service to our customers in all aspects of the business.</p>]]></content>
        <author>
            <name>Kyle Pittman</name>
            <uri>https://www.linkedin.com/in/kwpittman/</uri>
        </author>
        <author>
            <name>Nelina Huang</name>
            <uri>https://www.linkedin.com/in/nelinahuang/</uri>
        </author>
        <category label="postgres" term="postgres"/>
        <category label="postgis" term="postgis"/>
        <category label="csv" term="csv"/>
        <category label="integrations" term="integrations"/>
    </entry>
    <entry>
        <title type="html"><![CDATA[How Fused Powers BlackPrint’s Acquisition Intelligence Platform]]></title>
        <id>https://docs-staging.fused.io/pr/532/blog/how-fused-powers-blackprints-acquisition-intelligence-platform/</id>
        <link href="https://docs-staging.fused.io/pr/532/blog/how-fused-powers-blackprints-acquisition-intelligence-platform/"/>
        <updated>2025-01-22T00:00:00.000Z</updated>
        <summary type="html"><![CDATA[TL;DR BlackPrint streamlines and transforms fragmented real estate data into actionable insights across Latin America.]]></summary>
        <content type="html"><![CDATA[<p><strong>TL;DR BlackPrint streamlines and transforms fragmented real estate data into actionable insights across Latin America.</strong></p>
<!-- -->
<div style="height:360px;width:100%" class="video__player"></div>
<br>
<p><a href="https://www.blackprint.ai/" target="_blank" rel="noopener noreferrer">BlackPrint Technologies</a> began its journey as a satellite mapping service designed to help municipalities modernize their property registries. Recognizing a greater opportunity, we transitioned into the private sector to address a significant gap in the commercial real estate market: the need for accessible, actionable data. Today, our platform empowers professionals with precise acquisition intelligence, transforming how decisions are made across Mexico and, soon, all of Latin America.</p>
<p>In this blog post, we will explore how BlackPrint built the backend of its intelligence platform with Fused to provide a comprehensive view of the commercial real estate market in Mexico.</p>
<!-- -->
<h2 class="anchor anchorWithStickyNavbar_LWe7" id="the-problem-challenges-in-real-estate-data">The Problem: Challenges in Real Estate Data<a href="https://docs-staging.fused.io/pr/532/blog/how-fused-powers-blackprints-acquisition-intelligence-platform/#the-problem-challenges-in-real-estate-data" class="hash-link" aria-label="Direct link to The Problem: Challenges in Real Estate Data" title="Direct link to The Problem: Challenges in Real Estate Data">​</a></h2>
<p>Real estate professionals face fragmented data sources and manual processes. This complexity limits access to critical metrics such as zoning regulations, demographic patterns, and traffic trends, making site selection decisions both high-stakes and prone to errors. BlackPrint recognized this challenge and set out to create an all-in-one platform, transforming disjointed data into actionable intelligence to empower professionals across the commercial real estate landscape in Latin America.
Our Solution: The BlackPrint Approach</p>
<p>BlackPrint's platform offers a comprehensive suite of tools and insights, including property and zoning data, demographic and socioeconomic analytics, and detailed foot and vehicle traffic analysis. Underpinning this solution is a staggering volume of geospatial data sourced from diverse datasets such as cadastral records, demographic studies, and traffic sensors. This vast amount of information is meticulously analyzed to deliver actionable insights, all while being presented through an intuitive and user-friendly interface. By simplifying complex data into accessible formats, BlackPrint empowers users—regardless of their technical expertise—to navigate and leverage insights with ease. Building such a robust platform required not only expertise but also the right tools. That's where Fused came in.</p>
<!-- -->
<div style="text-align:center"><img src="https://docs-staging.fused.io/pr/532/assets/images/blackprint1-ff3bd77cb03ac6a1c24e3f3f34be9eda.png" alt="File"></div>
<h2 class="anchor anchorWithStickyNavbar_LWe7" id="leveraging-fused-a-partnership-for-efficiency">Leveraging Fused: A Partnership for Efficiency<a href="https://docs-staging.fused.io/pr/532/blog/how-fused-powers-blackprints-acquisition-intelligence-platform/#leveraging-fused-a-partnership-for-efficiency" class="hash-link" aria-label="Direct link to Leveraging Fused: A Partnership for Efficiency" title="Direct link to Leveraging Fused: A Partnership for Efficiency">​</a></h2>
<p>Fused became an indispensable partner in turning our vision for BlackPrint into reality. Its end-to-end cloud platform allowed us to move from concept to MVP significantly faster by simplifying our data processing and data delivery workflows. Before using Fused, we faced daunting challenges, such as processing and visually inspecting terabytes of traffic data and massive datasets from the <a href="https://docs.overturemaps.org/guides/places/" target="_blank" rel="noopener noreferrer">Overture Maps Foundation</a> for points of interest.</p>
<p>These tasks, which previously required extensive time and resources, became streamlined and efficient with Fused. Its ability to process geospatial datasets via HTTP-accessible Python functions made the development process seamless, enabling us to focus on creating an intuitive, high-performance platform. With Fused, we could deliver real-time insights and user-friendly visualizations at a scale that was unimaginable only a few years ago.</p>
<div style="width:100%;height:100%" class="video__player"></div>
<br>
<h2 class="anchor anchorWithStickyNavbar_LWe7" id="empowering-professionals-with-unprecedented-insights">Empowering Professionals with Unprecedented Insights<a href="https://docs-staging.fused.io/pr/532/blog/how-fused-powers-blackprints-acquisition-intelligence-platform/#empowering-professionals-with-unprecedented-insights" class="hash-link" aria-label="Direct link to Empowering Professionals with Unprecedented Insights" title="Direct link to Empowering Professionals with Unprecedented Insights">​</a></h2>
<p>BlackPrint's platform is transforming real estate decision-making by delivering unprecedented insights to professionals. For example, a retailer in Mexico City utilized our tools to identify a high-traffic site with optimal customer reach, saving weeks of manual analysis and significantly improving accuracy.</p>
<!-- -->
<div style="text-align:center"><img src="https://docs-staging.fused.io/pr/532/assets/images/blackprint2-b0e8aceadb45cce505d37ffa3533a644.png" alt="File"></div>
<p>Our platform's effectiveness is measured through key metrics like time saved, improved precision, and enhanced ROI for our clients. Users have reported up to a 30% increase in efficiency when planning site expansions or evaluating investments.</p>
<p>Looking ahead, BlackPrint's vision extends beyond Mexico, aiming to revolutionize acquisition intelligence across Latin America. With partners like Fused, we continue to innovate, making geospatial analytics scalable, intuitive, and accessible to professionals at every level.</p>
<!-- -->
<div style="text-align:center"><img src="https://docs-staging.fused.io/pr/532/assets/images/blackprint3-59969cbb852d81f9bca17e5191976efc.png" alt="File"></div>
<h2 class="anchor anchorWithStickyNavbar_LWe7" id="conclusion">Conclusion<a href="https://docs-staging.fused.io/pr/532/blog/how-fused-powers-blackprints-acquisition-intelligence-platform/#conclusion" class="hash-link" aria-label="Direct link to Conclusion" title="Direct link to Conclusion">​</a></h2>
<p>BlackPrint Technologies is on a mission to redefine real estate intelligence by delivering actionable insights that drive smarter, faster decisions. This journey has been significantly accelerated thanks to Fused, whose serverless data delivery empowered us to process and serve complex geospatial data at an unprecedented scale. Together, we are shaping a future where real estate professionals can access intuitive, data-driven tools that simplify their workflows and enhance their outcomes. Join us in transforming the industry—visit <a href="https://www.blackprint.ai/" target="_blank" rel="noopener noreferrer">blackprint.ai</a> to see how we are revolutionizing real estate decision-making.</p>]]></content>
        <author>
            <name>Gilberto S. Perezalonso</name>
            <uri>https://www.linkedin.com/in/gilberto-s-perezalonso/</uri>
        </author>
        <category label="site suitability" term="site suitability"/>
        <category label="real estate" term="real estate"/>
        <category label="overture" term="overture"/>
        <category label="app" term="app"/>
    </entry>
    <entry>
        <title type="html"><![CDATA[Hot-spot analysis for invasive species using Overture Maps]]></title>
        <id>https://docs-staging.fused.io/pr/532/blog/hot-spot-analysis-for-invasive-species-using-overture-maps/</id>
        <link href="https://docs-staging.fused.io/pr/532/blog/hot-spot-analysis-for-invasive-species-using-overture-maps/"/>
        <updated>2025-01-21T00:00:00.000Z</updated>
        <summary type="html"><![CDATA[TL;DR Elizabeth Rosenbloom creates hotspot maps to identify key areas where Arundo donax is likely to spread, streamlining analysis to improve invasive species mitigation.]]></summary>
        <content type="html"><![CDATA[<p><strong>TL;DR Elizabeth Rosenbloom creates hotspot maps to identify key areas where Arundo donax is likely to spread, streamlining analysis to improve invasive species mitigation.</strong></p>
<!-- -->
<div style="height:360px;width:100%" class="video__player"></div>
<br>
<p>In 2020 while working in Silicon Valley for the county of Santa Clara Valley, I became obsessed with improving monitoring and prevention efforts surrounding Arundo donax. The search and mitigation process this invasive plant species, Arundo donax, was a Sisophisian struggle that had been subject to the same procedures year in and year out, with no progress on beating the spread. To improve the efficacy and efficiency in battling against this notorious weed, I decided to build a tool that would identify the key areas for mitigation - both for the frequency of propagation (occurrence) and for spread potential.</p>
<p>In this blog post I show how I used Fused to create a map of key hotspots where Arundo donax is likely to spread based on built-environment factors derived from Overture Maps data.</p>
<!-- -->
<div class="theme-admonition theme-admonition-info admonition_xJq3 alert alert--info"><div class="admonitionHeading_Gvgb"><span class="admonitionIcon_Rf37"><svg viewBox="0 0 14 16"><path fill-rule="evenodd" d="M7 2.3c3.14 0 5.7 2.56 5.7 5.7s-2.56 5.7-5.7 5.7A5.71 5.71 0 0 1 1.3 8c0-3.14 2.56-5.7 5.7-5.7zM7 1C3.14 1 0 4.14 0 8s3.14 7 7 7 7-3.14 7-7-3.14-7-7-7zm1 3H6v5h2V4zm0 6H6v2h2v-2z"></path></svg></span>info</div><div class="admonitionContent_BuS1"><p>To follow along, you check out the UDF associated with the blog post:</p><ul>
<li><a href="https://www.fused.io/workbench/catalog/Invasive_Species_Hotspot-410a8f87-f3ad-4cb9-a867-c59db519d2a5" target="_blank" rel="noopener noreferrer">Invasive_Species_Hotspot UDF</a></li>
</ul></div></div>
<h2 class="anchor anchorWithStickyNavbar_LWe7" id="introduction">Introduction<a href="https://docs-staging.fused.io/pr/532/blog/hot-spot-analysis-for-invasive-species-using-overture-maps/#introduction" class="hash-link" aria-label="Direct link to Introduction" title="Direct link to Introduction">​</a></h2>
<p>In 2020, the problem with managing Arundo was that many agency employees considered this to be a hopeless pursuit, given the exorbitant amount of time cleaning, layering, and calculating the weighted analysis would take. Despite our vast ArcGIS library of tools, engineers, hydrologists, and GIS managers all warned me that I was going to drive myself crazy trying to get the enterprise software to successfully run my analysis. My only regret in building the tool back then was that I didn't have a tool like Fused to expedite the data pulling, processing, and calculating - as it would have saved me from the very lunacy I was warned about.</p>
<p>The obsession with the grass species, Arundo donax, began with an insight to the positive feedback loops created by increased flooding and the spread of invasive species due to climate change. Arundo donax is one of the most invasive plant species worldwide. In addition to destroying biodiversity and disrupting habitats for native species, this large grass also contributes to significant flooding patterns. As weather events become more severe and biodiversity declines, these changes create compounded consequences in our changing climate.</p>
<!-- -->
<div style="text-align:center"><img src="https://docs-staging.fused.io/pr/532/assets/images/liz1-38b52736378aa34d74985b2a1d29a353.png" alt="File"></div>
<h2 class="anchor anchorWithStickyNavbar_LWe7" id="challenges-with-hot-spot-analysis">Challenges with Hot-spot Analysis<a href="https://docs-staging.fused.io/pr/532/blog/hot-spot-analysis-for-invasive-species-using-overture-maps/#challenges-with-hot-spot-analysis" class="hash-link" aria-label="Direct link to Challenges with Hot-spot Analysis" title="Direct link to Challenges with Hot-spot Analysis">​</a></h2>
<p>Hot-spot analysis tools using weighted sums can significantly increase accuracy in targeting key areas for prevention. To build a hot-spot analysis for Arundo donax, the following variables need to be scored according to their degree of influence: distance to nutrient loading sources (such as a golf course), distance to a riparian buffer (creek or river), distance to a water-flow disruptor (such as a bridge), and size of the stream.</p>
<p>The key pain points of running a weighted sum on traditional GIS software include:</p>
<ul>
<li>Slow calculations: “State-of-the-art” software like ArcGIS can take several hours to calculate weighted sums. Furthermore, running weighted sums on large datasets/geographic areas can be nearly impossible given exhaustive RAM and GPU demands, so analyses over 1000 sq miles often require a user to split analyses into different geographic regions.</li>
<li>Program crashes: beyond the significant wait time required for typical weighted sum calculations, users of prominent GIS software often experience output delays as a result of runtime errors and other issues spurring a program crash.</li>
<li>Data transformations, cleaning, and standardization: most users of traditional GIS software will find they need to start from scratch when compiling data for a hot-spot analysis or weighted sum. Sometimes, standard base layers like slope and aspect will be searchable on the local software basis. Still, often, lengthy transformations are required to make the layers compatible with the final overlay calculation.</li>
</ul>
<h2 class="anchor anchorWithStickyNavbar_LWe7" id="how-fused-changed-my-workflow">How Fused Changed My Workflow<a href="https://docs-staging.fused.io/pr/532/blog/hot-spot-analysis-for-invasive-species-using-overture-maps/#how-fused-changed-my-workflow" class="hash-link" aria-label="Direct link to How Fused Changed My Workflow" title="Direct link to How Fused Changed My Workflow">​</a></h2>
<p>Using cloud-based systems like Fused can significantly increase calculation speeds, program resilience, and access to public Cloud Native datasets.</p>
<p>After encountering the Fused and learning about how I could improve the speed and geographic spread of site suitability analyses, I wanted to put it to the test by expanding on a previous analysis I did in 2021 using ArcGIS. The original 2021 analysis took several months of data collection, interviews with other local agencies, and extensive data cleaning, standardization, and transformations. I experienced all the aforementioned pain points of hot-spot analysis/weighted sum calculations and more.</p>
<p>Flash forward to today, where I am compiling global data sets, layering them, and deriving statistical insights within 1% of the time that it took me using ArcGIS. Running buffer analyses, weighting variables, and procuring data has taken a fraction of the time for GLOBAL data - and if you remember from before, the previous analysis from 2021 took months for a county-wide calculation and final product.</p>
<div style="width:100%;height:100%" class="video__player"></div>
<br>
<p>The most satisfying aspect of my new hot-spot analysis application wasn't just the expansive end product; the process was more seamless and engaging than I had imagined.</p>
<h2 class="anchor anchorWithStickyNavbar_LWe7" id="workflow-design">Workflow Design<a href="https://docs-staging.fused.io/pr/532/blog/hot-spot-analysis-for-invasive-species-using-overture-maps/#workflow-design" class="hash-link" aria-label="Direct link to Workflow Design" title="Direct link to Workflow Design">​</a></h2>
<p>I created a UDF with a simple model to identify hotspots susceptible to arundo. The model uses a weighted sum of several base Overture data classes:</p>
<ul>
<li>Golf Courses</li>
<li>Bridges</li>
<li>Water bodies (rivers, streams, etc.)</li>
</ul>
<!-- -->
<div style="text-align:center"><img src="https://docs-staging.fused.io/pr/532/assets/images/liz_udf-8f6a409b07d794f6bf15d8b2cb148f89.png" alt="File"></div>
<p>The UDF performs the following steps:</p>
<ol>
<li>Create GeoDataFrames from the Overture maps dataset using get_overture</li>
<li>Generate an H3 score based on buffers around each feature</li>
<li>Aggregate the H3 scores to create a weighted sum</li>
</ol>
<h2 class="anchor anchorWithStickyNavbar_LWe7" id="key-takeaways">Key Takeaways<a href="https://docs-staging.fused.io/pr/532/blog/hot-spot-analysis-for-invasive-species-using-overture-maps/#key-takeaways" class="hash-link" aria-label="Direct link to Key Takeaways" title="Direct link to Key Takeaways">​</a></h2>
<p>Given the complexity of procuring, layering, and interweaving data along with significant wait times and resource consumption, many governmental agencies, non-profits, and even private corporations struggle to run spatial analyses such as site-suitability and hot-spot tools. Insights and tools can be created by improving the speed and efficacy of operations such as weighted sums and fuzzy analysis across spatial layers with UDFs.</p>
<p>Site-suitability and hot-spot analysis go beyond species detection. By simplifying the approach to these types of tools, we can more quickly and accurately detect climate-vulnerable zones, prioritize habitat restoration, and create models to build resilient communities. Industries such as real estate development, retail, and logistics can more quickly understand the variables that affect their businesses by using cloud-based systems like Fused, which can easily manage large datasets.</p>]]></content>
        <author>
            <name>Elizabeth Rosenbloom</name>
            <uri>https://www.linkedin.com/in/elizabethrosenbloom/</uri>
        </author>
        <category label="h3" term="h3"/>
        <category label="overture" term="overture"/>
        <category label="hot-spot" term="hot-spot"/>
    </entry>
    <entry>
        <title type="html"><![CDATA[Calculating Fire Ratings with Overture Buildings and Places]]></title>
        <id>https://docs-staging.fused.io/pr/532/blog/fire-ratings/</id>
        <link href="https://docs-staging.fused.io/pr/532/blog/fire-ratings/"/>
        <updated>2025-01-20T00:00:00.000Z</updated>
        <summary type="html"><![CDATA[TL;DR Chris Amico shows how to combine Overture Maps data with fire perimeters to analyze wildfire impact on buildings and businesses.]]></summary>
        <content type="html"><![CDATA[<p><strong>TL;DR Chris Amico shows how to combine Overture Maps data with fire perimeters to analyze wildfire impact on buildings and businesses.</strong></p>
<!-- -->
<div style="height:360px;width:100%" class="video__player"></div>
<br>
<p>As communities continue to rebuild and recover from the devastation caused by natural disasters such as wildfires, the question remains: How can we quantify what was lost, especially in the built environment? With the ability to analyze detailed building footprints and overlay fire boundaries, we can begin to answer this by providing a rough estimate of the damage and identifying which structures were impacted by the flames.</p>
<p>In this blog post, Chris Amico shows how by leveraging data such as Overture Building footprints and fire progression maps, we can gain insight into the extent of fire risk. This enables news agencies to derive insights such as count of shops or homes exposed or even assess the capacity of highway routes for residents to evacuate before a prospect fire reaches them.</p>
<!-- -->
<div class="theme-admonition theme-admonition-info admonition_xJq3 alert alert--info"><div class="admonitionHeading_Gvgb"><span class="admonitionIcon_Rf37"><svg viewBox="0 0 14 16"><path fill-rule="evenodd" d="M7 2.3c3.14 0 5.7 2.56 5.7 5.7s-2.56 5.7-5.7 5.7A5.71 5.71 0 0 1 1.3 8c0-3.14 2.56-5.7 5.7-5.7zM7 1C3.14 1 0 4.14 0 8s3.14 7 7 7 7-3.14 7-7-3.14-7-7-7zm1 3H6v5h2V4zm0 6H6v2h2v-2z"></path></svg></span>info</div><div class="admonitionContent_BuS1"><p>To follow along, you check out the UDFs and app associated with the blog post:</p><ul>
<li><a href="https://www.fused.io/workbench/catalog/Fire_Proximity_GERS_Lookup-51a55f1c-f7d6-4ae8-9587-ca9e3270b551" target="_blank" rel="noopener noreferrer">Fire Proximity GERS_Lookup UDF</a></li>
<li><a href="https://www.fused.io/workbench/catalog/Fire_Proximity_Building_Score-e17cbc0f-1541-4271-942e-00779838b19d" target="_blank" rel="noopener noreferrer">Fire Proximity Building_Score UDF</a></li>
<li><a href="https://www.fused.io/workbench/catalog/Fire_Proximity_Buffer-4e1fbf84-ea8b-4758-8b09-a32d35b545ca" target="_blank" rel="noopener noreferrer">Fire Proximity Buffer UDF</a></li>
<li><a href="https://docs.google.com/spreadsheets/d/1swfP35TUrTx2eI3LSh1Jbguj77G1rdio0oZ_eKnt74I/edit?usp=sharing" target="_blank" rel="noopener noreferrer">Google Sheet</a> that enriches the "Fire Risk" column for any given Building GERS</li>
<li><a href="https://www.fused.io/workbench/apps#app/s/i/fa_6Lqarya7D9jVQ95hTUXFmH" target="_blank" rel="noopener noreferrer">App: H3 rollups within water buffer</a></li>
</ul></div></div>
<h3 class="anchor anchorWithStickyNavbar_LWe7" id="introduction">Introduction<a href="https://docs-staging.fused.io/pr/532/blog/fire-ratings/#introduction" class="hash-link" aria-label="Direct link to Introduction" title="Direct link to Introduction">​</a></h3>
<p>Fused simplifies the process of spatially joining datasets with Overture Maps data, such as integrating with fire-related datasets.</p>
<p>For this example, we use the <a href="https://data-nifc.opendata.arcgis.com/datasets/nifc::interagencyfireperimeterhistory-all-years-view/about" target="_blank" rel="noopener noreferrer">Inter Agency Fire Perimeter Historical dataset</a> (published by the <a href="https://www.nifc.gov/" target="_blank" rel="noopener noreferrer">National Interagency Fire Center (NIFC)</a>) which includes historical fire perimeters up to 2024. Joining fire perimeters with Overture Buildings and Places data enables us to highlight service gaps or identify regions that may require immediate response.</p>
<p>This demo will first select buildings within a buffer zone to determine which fire perimeter they fall within. Then, it will perform an H3 stats roll-up of business categories from Overture Places, counting the number and types of businesses that fall within each distance range. This will involve rolling up Overture Places business categories into H3 hexagons.</p>
<h2 class="anchor anchorWithStickyNavbar_LWe7" id="the-workflow">The Workflow<a href="https://docs-staging.fused.io/pr/532/blog/fire-ratings/#the-workflow" class="hash-link" aria-label="Direct link to The Workflow" title="Direct link to The Workflow">​</a></h2>
<p>These UDFs return Overture Buildings and Places within a buffer distance from a fire. They offers a simple way to determine the scope of possible fire damage and quickly assess the number of businesses, homes, and other significant structures within the affected area. By adjusting the buffer or selecting fire extent based on dates, users can fine-tune their analysis to gain deeper insights into how far the fire's reach extends and what establishments were most at risk.</p>
<div style="width:100%;height:100%" class="video__player"></div>
<h3 class="anchor anchorWithStickyNavbar_LWe7" id="a-fire-proximity-buffer">a. Fire Proximity Buffer<a href="https://docs-staging.fused.io/pr/532/blog/fire-ratings/#a-fire-proximity-buffer" class="hash-link" aria-label="Direct link to a. Fire Proximity Buffer" title="Direct link to a. Fire Proximity Buffer">​</a></h3>
<p>First, we create a buffer around the fire perimeter to define the area of interest. This buffer helps us understand the extent of the fire's impact and provides a clear boundary for further analysis.</p>
<ul>
<li>In Historic Perimeter: The building/point is within a historic perimeter</li>
<li>Near Historic Perimeter: The building/point is within 1km of a historic perimeter</li>
<li>Outside Perimeter: The building/point is within 10km of a historic perimeter</li>
</ul>
<!-- -->
<div style="text-align:center"><img src="https://docs-staging.fused.io/pr/532/assets/images/fire_buffers-4371573d48e932d90b6d3d3f8959c23a.png" alt="File"></div>
<h3 class="anchor anchorWithStickyNavbar_LWe7" id="b-fire-proximity-building-score">b. Fire Proximity Building Score<a href="https://docs-staging.fused.io/pr/532/blog/fire-ratings/#b-fire-proximity-building-score" class="hash-link" aria-label="Direct link to b. Fire Proximity Building Score" title="Direct link to b. Fire Proximity Building Score">​</a></h3>
<p>Next, we load the Overture Buildings dataset and spatially join it with the fire buffer zones. This workflow categorizes buildings based on their proximity to the fire, helping us assess which structures are most at risk.</p>
<ol>
<li>Load the NIFC fire perimeter data</li>
<li>Create buffer zones around the fire perimeters</li>
<li>Load Overture Buildings</li>
<li>Spatially join buildings within the buffer zones to categorize them by proximity to the fire</li>
</ol>
<!-- -->
<div style="text-align:center"><img src="https://docs-staging.fused.io/pr/532/assets/images/fire_buildings-53c757bcbef9f37defee091cb2bbe68b.png" alt="File"></div>
<h3 class="anchor anchorWithStickyNavbar_LWe7" id="c-overture-places-rollup-by-h3">c. Overture Places Rollup by H3<a href="https://docs-staging.fused.io/pr/532/blog/fire-ratings/#c-overture-places-rollup-by-h3" class="hash-link" aria-label="Direct link to c. Overture Places Rollup by H3" title="Direct link to c. Overture Places Rollup by H3">​</a></h3>
<p>Finally, we perform a spatial aggregation by calculating the H3 index for the centroids of Overture Places within the fire buffer. This allows us to roll up business categories into H3 hexagons, enabling a holistic overview of business distribution in relation to the fire perimeter.</p>
<ol>
<li>Load the NIFC fire perimeter data</li>
<li>Load Overture Places</li>
<li>Determine the H3 for the centroid of each building</li>
<li>Normalize the 'categories' column into individual columns</li>
<li>Roll-up categories by H3, create categories primary set</li>
</ol>
<!-- -->
<div style="text-align:center"><img src="https://docs-staging.fused.io/pr/532/assets/images/fire_h3_broad-5c957e77933653ab577a39ec223d8e06.png" alt="File"></div>
<h2 class="anchor anchorWithStickyNavbar_LWe7" id="conclusion-and-next-steps">Conclusion and Next Steps<a href="https://docs-staging.fused.io/pr/532/blog/fire-ratings/#conclusion-and-next-steps" class="hash-link" aria-label="Direct link to Conclusion and Next Steps" title="Direct link to Conclusion and Next Steps">​</a></h2>
<p>This kind of analysis helps understand not only the immediate impact but also in planning for future fire preparedness and recovery efforts. In this post, we saw how Overture and Fire-extent data can help us estimate the extent of the damage, from individual buildings to entire neighborhoods.</p>
<p>Organizations looking to integrate these types of perspectives into their workflows could create apps or API services that deliver derivative products, such as GERS lookups to categorize "fire risk" based on buffer proximity.</p>
<p>They could also use Fused <a href="https://docs-staging.fused.io/pr/532/core-concepts/run-udfs/run-small-udfs/#http-requests">HTTP endpoints</a> from the UDF to return a CSV with the GERS and "Fire Risk" score for buildings within a defined bounding box, as specified by a query parameter. Additionally, they could also use the HTTP endpoints to automatically enrich the "Fire Risk" column of an arbitrary dataset for any given Building GERS. Users could apply it to any row of their table, with the functionality powered by a "GERS lookup" endpoint using a GERS ID query parameter.</p>]]></content>
        <author>
            <name>Chris Amico</name>
            <uri>https://www.linkedin.com/in/chrisamico/</uri>
        </author>
        <author>
            <name>Plinio Guzman</name>
            <uri>https://www.linkedin.com/in/plinioguzman/</uri>
        </author>
        <category label="h3" term="h3"/>
        <category label="places" term="places"/>
        <category label="buffer" term="buffer"/>
    </entry>
    <entry>
        <title type="html"><![CDATA[Characterize cities with embeddings of Overture Place categories]]></title>
        <id>https://docs-staging.fused.io/pr/532/blog/characterize-cities-with-embeddings-of-overture-place-categories/</id>
        <link href="https://docs-staging.fused.io/pr/532/blog/characterize-cities-with-embeddings-of-overture-place-categories/"/>
        <updated>2025-01-16T00:00:00.000Z</updated>
        <summary type="html"><![CDATA[TL;DR Maribel Hernandez shows how to create clusters of business categories using Overture Places data.]]></summary>
        <content type="html"><![CDATA[<p><strong>TL;DR Maribel Hernandez shows how to create clusters of business categories using Overture Places data.</strong></p>
<!-- -->
<div style="height:360px;width:100%" class="video__player"></div>
<br>
<p>Maribel Hernandez is a computer scientist and researcher at <a href="https://www.cinvestav.mx/" target="_blank" rel="noopener noreferrer">CINVESTAV</a>, a multidisciplinary academic institution in Mexico. She specializes in graph theory in the field of computational genomics and complex networks. In this blog post, Maribel shows how she characterizes cities based on the distribution of businesses by rolling-up business categories by H3.</p>
<p>As someone who works with urban networks, Maribel's focus is on exploring how cities function and how their design impacts inclusivity. The core question driving this analysis is: Does the city have an even distribution of business services? Or are there shortages such as food deserts or unequal access to health facilities?</p>
<!-- -->
<div class="theme-admonition theme-admonition-info admonition_xJq3 alert alert--info"><div class="admonitionHeading_Gvgb"><span class="admonitionIcon_Rf37"><svg viewBox="0 0 14 16"><path fill-rule="evenodd" d="M7 2.3c3.14 0 5.7 2.56 5.7 5.7s-2.56 5.7-5.7 5.7A5.71 5.71 0 0 1 1.3 8c0-3.14 2.56-5.7 5.7-5.7zM7 1C3.14 1 0 4.14 0 8s3.14 7 7 7 7-3.14 7-7-3.14-7-7-7zm1 3H6v5h2V4zm0 6H6v2h2v-2z"></path></svg></span>info</div><div class="admonitionContent_BuS1"><p>To follow along, you can clone and run the associated:</p><ul>
<li><a href="https://colab.research.google.com/drive/11Q5iONwvEb9cg7ukGptBsQCV4yAM0r_b?authuser=1#scrollTo=FT478_wRzltw" target="_blank" rel="noopener noreferrer">Colab Notebook</a></li>
<li><a href="https://www.fused.io/workbench/catalog/Overture_Places_Embedding_Clusters-3d326d5a-87de-491a-92e4-cf2cdd4c93bb" target="_blank" rel="noopener noreferrer">Overture Places Embedding Clusters UDF</a></li>
</ul></div></div>
<h2 class="anchor anchorWithStickyNavbar_LWe7" id="introduction">Introduction<a href="https://docs-staging.fused.io/pr/532/blog/characterize-cities-with-embeddings-of-overture-place-categories/#introduction" class="hash-link" aria-label="Direct link to Introduction" title="Direct link to Introduction">​</a></h2>
<p>Consider these scenarios:</p>
<ul>
<li>How connected are areas dominated by upper-class establishments to the broader city fabric?</li>
<li>Are health services distributed with equal access from low-income neighborhoods?</li>
<li>Do certain metropolis have better accessibility and service availability compared to others?</li>
</ul>
<p>Take, for example, a comparison between 3 key cities in Mexico: Mexico City, León, and Mérida. Are neighborhoods in these cities equally served by essential services such as healthcare, food, and transportation? Could some areas be considered food deserts, while others enjoy easy access to all services?</p>
<div style="width:100%;height:100%" class="video__player"></div>
<h2 class="anchor anchorWithStickyNavbar_LWe7" id="creating-embeddings-of-overture-places">Creating Embeddings of Overture Places<a href="https://docs-staging.fused.io/pr/532/blog/characterize-cities-with-embeddings-of-overture-place-categories/#creating-embeddings-of-overture-places" class="hash-link" aria-label="Direct link to Creating Embeddings of Overture Places" title="Direct link to Creating Embeddings of Overture Places">​</a></h2>
<p>To answer these questions, I use a method that can scale across cities and ensure consistency. By grouping business categories in Overture Places at the H3 grid level, we can analyze the distribution of services and their accessibility. This approach provides a quantifiable way to compare cities globally, shedding light on the urban inclusivity of different regions.
Workflow</p>
<p>The UDF I created follows this workflow:</p>
<ol>
<li>Load Overture Places records for a given H3</li>
<li>Create business category column</li>
<li>Create an embedding to represent business categories</li>
<li>Run UDF for all H3 spanning an area of interest (polyfill)</li>
<li>Calculate Kmeans clustering based on cosine similarity.</li>
<li>Describe each cluster</li>
</ol>
<!-- -->
<div style="text-align:center"><img src="https://docs-staging.fused.io/pr/532/assets/images/workbench-40031a539a5c176695745e3530d89800.png" alt="File"></div>
<p><em>Preview of UDF on Workbench.</em></p>
<h2 class="anchor anchorWithStickyNavbar_LWe7" id="descriptive-analysis">Descriptive analysis<a href="https://docs-staging.fused.io/pr/532/blog/characterize-cities-with-embeddings-of-overture-place-categories/#descriptive-analysis" class="hash-link" aria-label="Direct link to Descriptive analysis" title="Direct link to Descriptive analysis">​</a></h2>
<p>When analyzing the urban fabric of cities like Mexico City, Leon, and Merida, we can obsere distinct patterns of service distribution that manifest as rings around the city center.</p>
<!-- -->
<div style="text-align:center"><img src="https://docs-staging.fused.io/pr/532/assets/images/cdmx-293897fc4011d9a7f01e9ab55bbe5507.png" alt="File"></div>
<p><em>Mexico City.</em></p>
<h3 class="anchor anchorWithStickyNavbar_LWe7" id="a-the-heart-of-the-city">a. The heart of the city<a href="https://docs-staging.fused.io/pr/532/blog/characterize-cities-with-embeddings-of-overture-place-categories/#a-the-heart-of-the-city" class="hash-link" aria-label="Direct link to a. The heart of the city" title="Direct link to a. The heart of the city">​</a></h3>
<p>Especially in Leon and Merida, the central area tends to form a cohesive, dense cluster of services. The core zone houses a variety of businesses including health services, retail, and food outlets, which are generally well-connected and easily accessible. Intuitively, the central cluster can be thought of as the “heart” of the city, serving as the primary hub for commerce, social interaction, and access to essential services.</p>
<!-- -->
<div style="text-align:center"><img src="https://docs-staging.fused.io/pr/532/assets/images/leon-af4912bb6121a29388ba4b452c13b69f.png" alt="File"></div>
<p><em>Leon.</em></p>
<h3 class="anchor anchorWithStickyNavbar_LWe7" id="b-islands-of-services">b. Islands of Services<a href="https://docs-staging.fused.io/pr/532/blog/characterize-cities-with-embeddings-of-overture-place-categories/#b-islands-of-services" class="hash-link" aria-label="Direct link to b. Islands of Services" title="Direct link to b. Islands of Services">​</a></h3>
<p>Beyond the center, we notice smaller clusters of services scattered across the city, often in the form of “islands.” These islands represent pockets of neighborhoods that, while not part of the dense city center, offer an array of unique services. These can serve to highlight the phenomenon of emergent neighborhoods within a greater whole.</p>
<!-- -->
<div style="text-align:center"><img src="https://docs-staging.fused.io/pr/532/assets/images/merida-fbae513ad83c1752a1510de02ba95f4f.png" alt="File"></div>
<p><em>Merida.</em></p>
<h3 class="anchor anchorWithStickyNavbar_LWe7" id="c-peripheral-ring">c. Peripheral ring<a href="https://docs-staging.fused.io/pr/532/blog/characterize-cities-with-embeddings-of-overture-place-categories/#c-peripheral-ring" class="hash-link" aria-label="Direct link to c. Peripheral ring" title="Direct link to c. Peripheral ring">​</a></h3>
<p>The periphery of these cities forms another distinct pattern. These outer regions also tend to cluster together in similar service categories, forming a ring that surrounds the central core. It’s possible services in these peripheral areas are often more limited in scope and may reflect a focus on residential and less commercial needs, or reflect lower-income neighborhoods with scarcer access to key services.</p>
<h2 class="anchor anchorWithStickyNavbar_LWe7" id="conclusion">Conclusion<a href="https://docs-staging.fused.io/pr/532/blog/characterize-cities-with-embeddings-of-overture-place-categories/#conclusion" class="hash-link" aria-label="Direct link to Conclusion" title="Direct link to Conclusion">​</a></h2>
<p>This ring-like pattern of service distribution suggests a common trend where the core of the city is highly accessible, while the periphery often lacks the same diversity and depth of business services. The islands of services in between can be seen as attempts to bridge this gap, but they are not always as effective in meeting the needs of the population on the periphery.</p>
<p>These spatial patterns offer valuable insights into the inclusivity of urban networks, highlighting areas that may need attention to ensure strategic business placement and guarantee equitable access to essential services.</p>
<h2 class="anchor anchorWithStickyNavbar_LWe7" id="future-work">Future work<a href="https://docs-staging.fused.io/pr/532/blog/characterize-cities-with-embeddings-of-overture-place-categories/#future-work" class="hash-link" aria-label="Direct link to Future work" title="Direct link to Future work">​</a></h2>
<ul>
<li>Create Network: Create a bipartite network between place categories and H3 indices, using weights as counts for each category.</li>
<li>Tie in Demographic Data: Integrate INEGI sociodemographic data at the census block group level to understand how services align with population needs.</li>
<li>Access by Neighborhood: Use origin-destination (OD) movement networks to evaluate service accessibility by neighborhood of residence.</li>
<li>Segregation Analysis: Identify zones with low visit rates or difficult accessibility. These zones may represent areas of segregation or neglect in the urban network.</li>
</ul>]]></content>
        <author>
            <name>Maribel Hernandez</name>
            <uri>https://www.linkedin.com/in/maribel-hern%C3%A1ndez-758b24134/</uri>
        </author>
        <category label="overture" term="overture"/>
        <category label="places" term="places"/>
        <category label="embeddings" term="embeddings"/>
        <category label="clustering" term="clustering"/>
    </entry>
    <entry>
        <title type="html"><![CDATA[Streamlining the design of parcel delivery routes with H3]]></title>
        <id>https://docs-staging.fused.io/pr/532/blog/streamlining-the-design-of-parcel-delivery-routes-with-h3/</id>
        <link href="https://docs-staging.fused.io/pr/532/blog/streamlining-the-design-of-parcel-delivery-routes-with-h3/"/>
        <updated>2025-01-09T00:00:00.000Z</updated>
        <summary type="html"><![CDATA[TL;DR GLS uses Fused to create internal tooling to optimize routing for parcel delivery operations.]]></summary>
        <content type="html"><![CDATA[<p><strong>TL;DR GLS uses Fused to create internal tooling to optimize routing for parcel delivery operations.</strong></p>
<!-- -->
<div style="height:360px;width:100%" class="video__player"></div>
<br>
<p>In the parcel delivery business, geospatial analyses are crucial to answer questions about daily operations. Do delivery drivers visit the same regions each day, letting them know their areas intimately? Or is there a high volatility of the regions? And of course, how do we optimize the routes of multiple drivers servicing the same region?</p>
<p>Those are the questions Antonius is working on at GLS Studio, an innovation lab by GLS (<a href="https://www.gls-us.com/" target="_blank" rel="noopener noreferrer">General Logistics Systems</a>) which is an international parcel delivery service provider.</p>
<p>In this blog post, Antonius highlights how he uses Fused to create stable delivery areas for single-day and multi-day aggregates.</p>
<!-- -->
<h2 class="anchor anchorWithStickyNavbar_LWe7" id="the-challenge-designing-delivery-areas">The Challenge Designing Delivery Areas<a href="https://docs-staging.fused.io/pr/532/blog/streamlining-the-design-of-parcel-delivery-routes-with-h3/#the-challenge-designing-delivery-areas" class="hash-link" aria-label="Direct link to The Challenge Designing Delivery Areas" title="Direct link to The Challenge Designing Delivery Areas">​</a></h2>
<p>While the planned areas of driver tours to delivery packages can be rather well-defined, an evaluation of the areas actually served by drivers is equally important and might not be as easy. It can be used for guiding delivery drivers to become more efficient while also enabling managers to identify planned areas that are suboptimal due to built environment features like rivers or big highways.</p>
<p>Creating delivery areas out of single geospatial data points is challenging. A naïve approach would be to use convex polygons, but this causes multiple issues:</p>
<ul>
<li>A single data point can have a high influence on the shape and area of the polygon</li>
<li>A tour consisting of multiple not connected sub-areas is hard to detect and correctly display</li>
<li>This limits the area to what is covered by historic data which leaves a gap in new target regions</li>
<li>Calculations using polygons are computationally expensive, hindering ad-hoc changes to the selected time span or the calculation parameters</li>
</ul>
<p>Building new and sometimes experimental features means that the database is often not optimized for the use case. Data needs to be joined between multiple tables and even between multiple data sources. Therefore, fetching all data can be slow, highly limiting the usefulness of having an experimental feature to play around with.</p>
<h2 class="anchor anchorWithStickyNavbar_LWe7" id="solving-the-challenge-with-h3-and-fused-udfs">Solving the Challenge with H3 and Fused UDFs<a href="https://docs-staging.fused.io/pr/532/blog/streamlining-the-design-of-parcel-delivery-routes-with-h3/#solving-the-challenge-with-h3-and-fused-udfs" class="hash-link" aria-label="Direct link to Solving the Challenge with H3 and Fused UDFs" title="Direct link to Solving the Challenge with H3 and Fused UDFs">​</a></h2>
<h3 class="anchor anchorWithStickyNavbar_LWe7" id="dynamic-delivery-areas-with-h3">Dynamic Delivery Areas with H3<a href="https://docs-staging.fused.io/pr/532/blog/streamlining-the-design-of-parcel-delivery-routes-with-h3/#dynamic-delivery-areas-with-h3" class="hash-link" aria-label="Direct link to Dynamic Delivery Areas with H3" title="Direct link to Dynamic Delivery Areas with H3">​</a></h3>
<p>The solution to the first problem came by using H3 cells instead of polygons. By assigning cells to the drivers based on their historic deliveries to the cell, driver areas result automatically. Using H3 cells across different resolutions also allows us to represent the differences between urban and rural areas which see different parcel volumes. While there exists one "base resolution" to ensure non-overlapping and complete areas, the logical hierarchy among H3 cells can be used to calculate on lower resolutions for rural areas that see fewer deliveries, speeding up the computation and ensuring a broader coverage of those areas beyond the historical data points.</p>
<div style="width:100%;height:100%" class="video__player"></div>
<br>
<p>On the other hand, disputed H3 cells can be broken down to a higher resolution and assigned to different drivers or, when the "base resolution" has been reached, assigned to the driver delivering most parcels to the cell. As H3 cells have clearly defined neighborhoods, areas can easily be extended beyond their historical limits when desired, covering the empty space around to include a new parcel that falls outside of historically served area boundaries.</p>
<!-- -->
<div style="text-align:center"><img src="https://docs-staging.fused.io/pr/532/assets/images/antonius_app-94f1c8b61b32d1d4eb9e2507b822cc06.png" alt="File"></div>
<p><em>Fused app to show dynamic delivery areas at different H3 resolutions.</em></p>
<h3 class="anchor anchorWithStickyNavbar_LWe7" id="streamlining-workflows-with-fused-udfs-and-caching">Streamlining workflows with Fused UDFs and Caching<a href="https://docs-staging.fused.io/pr/532/blog/streamlining-the-design-of-parcel-delivery-routes-with-h3/#streamlining-workflows-with-fused-udfs-and-caching" class="hash-link" aria-label="Direct link to Streamlining workflows with Fused UDFs and Caching" title="Direct link to Streamlining workflows with Fused UDFs and Caching">​</a></h3>
<p>Fused UDFs helped us solve problems around the latency of querying and calculations. When a user looks at an area for a day, they are probably interested in the same area on some of the previous and following days as well, right? So why not pre-calculate that already?</p>
<p>Using Fused, it is simply a matter of fire-and-forget to trigger the UDF with parameters for some previous and following days which are then already running to cache. So when the user views an adjacent day, the data will already be there. And more broadly, when it is possible to limit the number of parameter combinations in an experimental feature to a manageable amount, this fire-and-have-it-cached approach is not limited to caching data from previous and following days, but can also be used for a range of other cases.</p>
<!-- -->
<div style="text-align:center"><img src="https://docs-staging.fused.io/pr/532/assets/images/antonius_excalidraw-8fe927afa0708a250079f480047f7540.png" alt="File"></div>
<p><em>Sample workflow with Fused UDFs.</em></p>
<h2 class="anchor anchorWithStickyNavbar_LWe7" id="conclusion">Conclusion<a href="https://docs-staging.fused.io/pr/532/blog/streamlining-the-design-of-parcel-delivery-routes-with-h3/#conclusion" class="hash-link" aria-label="Direct link to Conclusion" title="Direct link to Conclusion">​</a></h2>
<p>When developing new features that are not yet supported by the current data infrastructure, Fused UDFs enabled us to easily test things without having to change the underlying infrastructure in advance. The UDFs are easily shareable and adjustable, allowing testing by multiple people without having to run code locally while automatically making sure everyone is using the same code that is hosted in the UDF. And because we can easily call UDFs with HTTP endpoints, when we have verified the feasibility of a feature, it’s easy to integrate into our product.</p>]]></content>
        <author>
            <name>Antonius Moosdorf</name>
        </author>
        <category label="workflow" term="workflow"/>
        <category label="caching" term="caching"/>
        <category label="h3" term="h3"/>
    </entry>
    <entry>
        <title type="html"><![CDATA[The Strength in Weak Data Part 3: Prepping the Model Dataset]]></title>
        <id>https://docs-staging.fused.io/pr/532/blog/the-strength-in-weak-data-part-3-prepping-the-model-dataset/</id>
        <link href="https://docs-staging.fused.io/pr/532/blog/the-strength-in-weak-data-part-3-prepping-the-model-dataset/"/>
        <updated>2024-12-12T00:00:00.000Z</updated>
        <summary type="html"><![CDATA[TL;DR Kristin shares a UDF to create training data for a corn yield prediction model using Zonal Statistics.]]></summary>
        <content type="html"><![CDATA[<p><strong>TL;DR Kristin shares a UDF to create training data for a corn yield prediction model using Zonal Statistics.</strong></p>
<!-- -->
<div style="height:360px;width:100%" class="video__player"></div>
<p>Hello friends, thanks for following my journey so far. To catch you up, I'm trying to solve the problem of farmers and traders relying on weak and untimely predictions of corn yield. Weak because they are at the national level and untimely because the predictions come once a month.</p>
<p>So here's the deal: farmers and traders have been relying on national-level corn yield predictions that are not only <strong>weak</strong> but also <strong>painfully slow</strong>, arriving just <strong>once a month</strong>. Imagine making critical decisions based on a single data point each month.</p>
<p>Not ideal, right? That's exactly the issue we're tackling in this blog post series.</p>
<!-- -->
<div class="theme-admonition theme-admonition-info admonition_xJq3 alert alert--info"><div class="admonitionHeading_Gvgb"><span class="admonitionIcon_Rf37"><svg viewBox="0 0 14 16"><path fill-rule="evenodd" d="M7 2.3c3.14 0 5.7 2.56 5.7 5.7s-2.56 5.7-5.7 5.7A5.71 5.71 0 0 1 1.3 8c0-3.14 2.56-5.7 5.7-5.7zM7 1C3.14 1 0 4.14 0 8s3.14 7 7 7 7-3.14 7-7-3.14-7-7-7zm1 3H6v5h2V4zm0 6H6v2h2v-2z"></path></svg></span>info</div><div class="admonitionContent_BuS1"><p>Catch up with <a href="https://docs-staging.fused.io/pr/532/blog/the-strength-in-weak-data/">Part 1</a> and <a href="https://docs-staging.fused.io/pr/532/blog/the-strength-in-weak-data-part-2/">Part 2</a> of Kristin's blog series.</p><p>Find Kristin's UDF code associated with the blog post here:</p><ul>
<li><a href="https://www.fused.io/workbench/catalog/Solar_Induced_Fluorescence-37a48cc8-711e-4b56-93ea-48f5639e4062" target="_blank" rel="noopener noreferrer">Solar Induced Fluorescence UDF</a></li>
<li><a href="https://www.fused.io/workbench/catalog/Crop_Mask_Zonal_Statistics-dc1e6bf9-e2e6-4a1b-9061-094bc4825978" target="_blank" rel="noopener noreferrer">Crop Mask Zonal Statistics UDF</a></li>
</ul></div></div>
<p>Let's say you are a corn trader and it's halfway through the month, a major flood devastates key corn-growing areas. If you only get yield estimates monthly, you won't know until it's too late—prices will have already spiked, and you've missed your chance to act. But with updates <strong>twice a month or more</strong>, you'd catch the disaster early, adjust your trades, and stay ahead of the market. In a <strong>$21 billion corn commodities market</strong>, better, faster insights can make all the difference. Advanced geospatial modeling can bring those efficiencies, turning weak data into powerful decisions.</p>
<h2 class="anchor anchorWithStickyNavbar_LWe7" id="motivations">Motivations<a href="https://docs-staging.fused.io/pr/532/blog/the-strength-in-weak-data-part-3-prepping-the-model-dataset/#motivations" class="hash-link" aria-label="Direct link to Motivations" title="Direct link to Motivations">​</a></h2>
<p>Let's find some efficiencies using advanced geospatial modeling and the latest research.
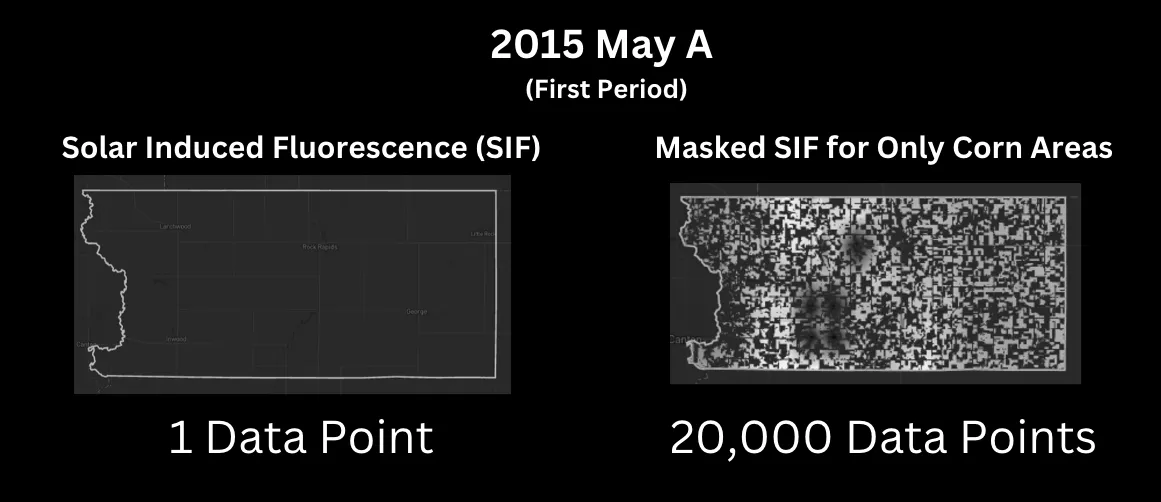
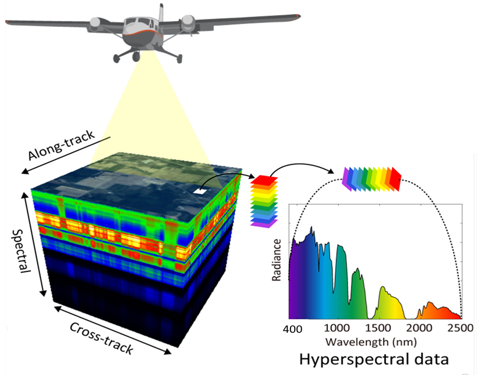
</p>
<p>I previously showed how <a href="https://appliedsciences.nasa.gov/our-impact/news/solar-induced-fluorescence-learn-new-approach-remote-sensing-vegetation" target="_blank" rel="noopener noreferrer">Solar Induced Flourescence (SIF)</a> is a direct measurement of photosynthesis and therefore a better indicator of crop yield than NVDI indices.</p>
<p>But there's a catch—this data is weak because it's at a <strong>25 km² resolution</strong>, which any geospatial machine learning scientist would find, well, less than ideal. To make matters worse, our actual yield data (our target variable) is at the <strong>county level</strong>. Double yikes!</p>
<p>But fear not. This problem can be solved!</p>
<p>Thanks to the scaling capabilities for geospatial modeling in Fused I am able to solve this data by increasing the amount of data and therefore the statistical power of it.</p>
<h2 class="anchor anchorWithStickyNavbar_LWe7" id="diving-into-the-data-details">Diving into the Data Details<a href="https://docs-staging.fused.io/pr/532/blog/the-strength-in-weak-data-part-3-prepping-the-model-dataset/#diving-into-the-data-details" class="hash-link" aria-label="Direct link to Diving into the Data Details" title="Direct link to Diving into the Data Details">​</a></h2>
<p>
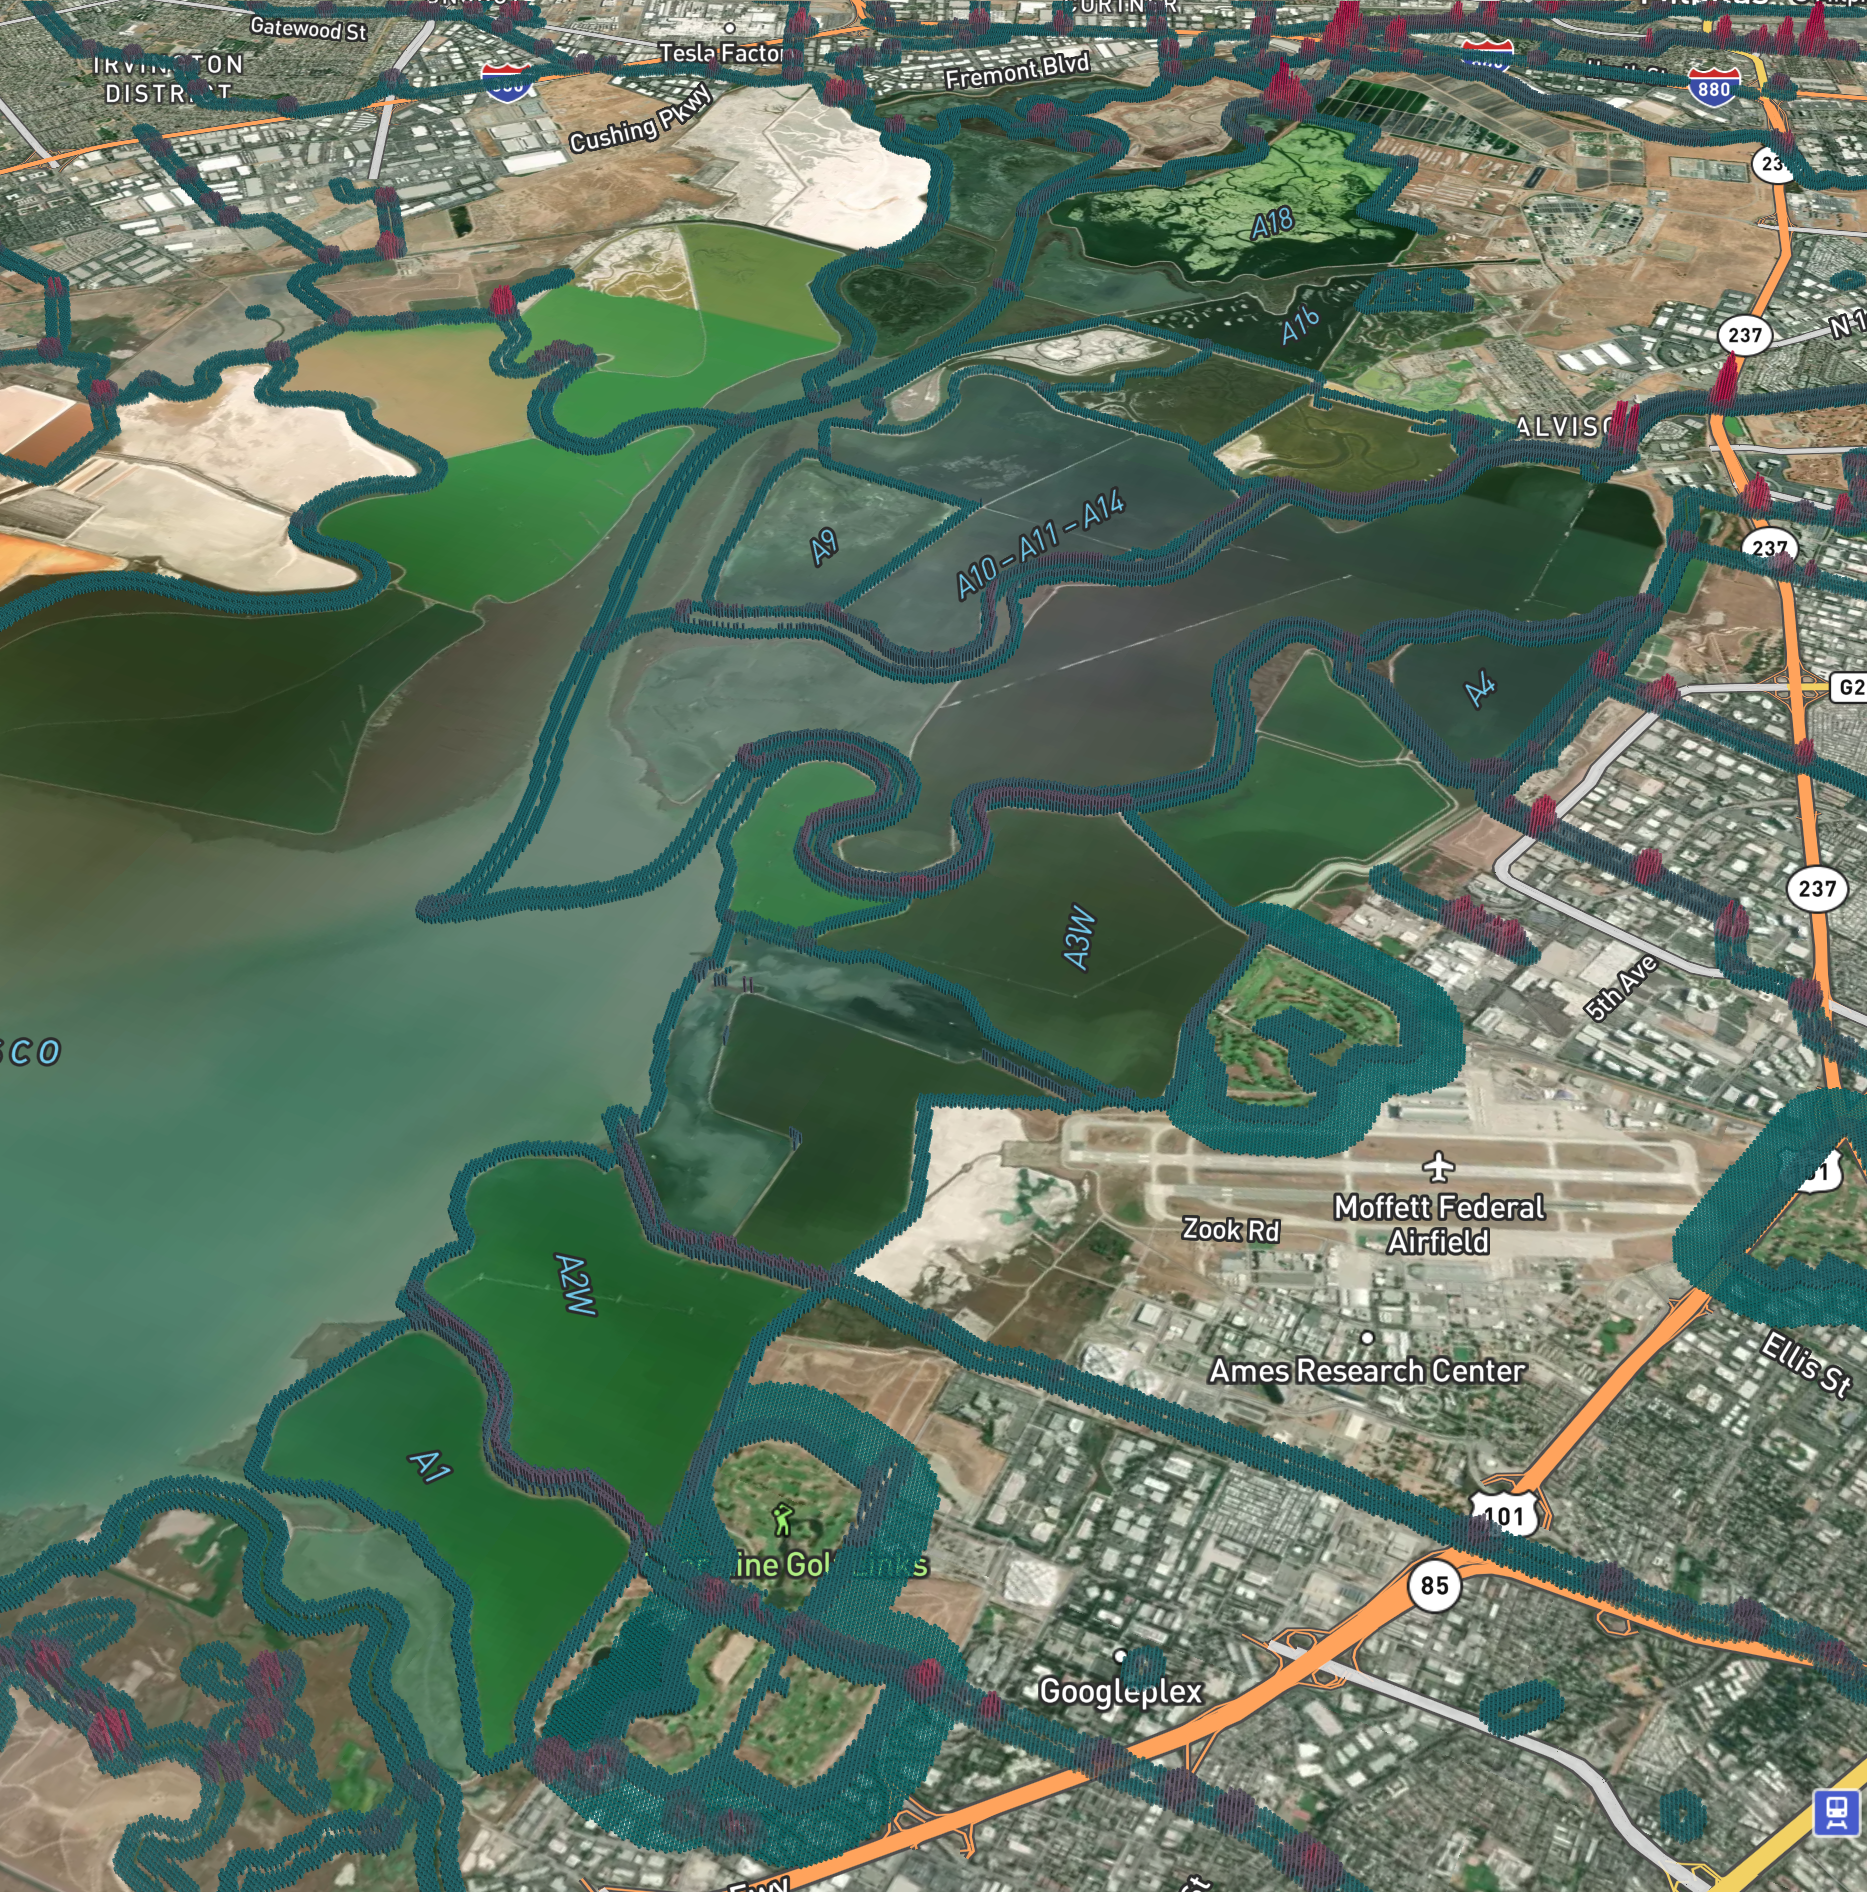
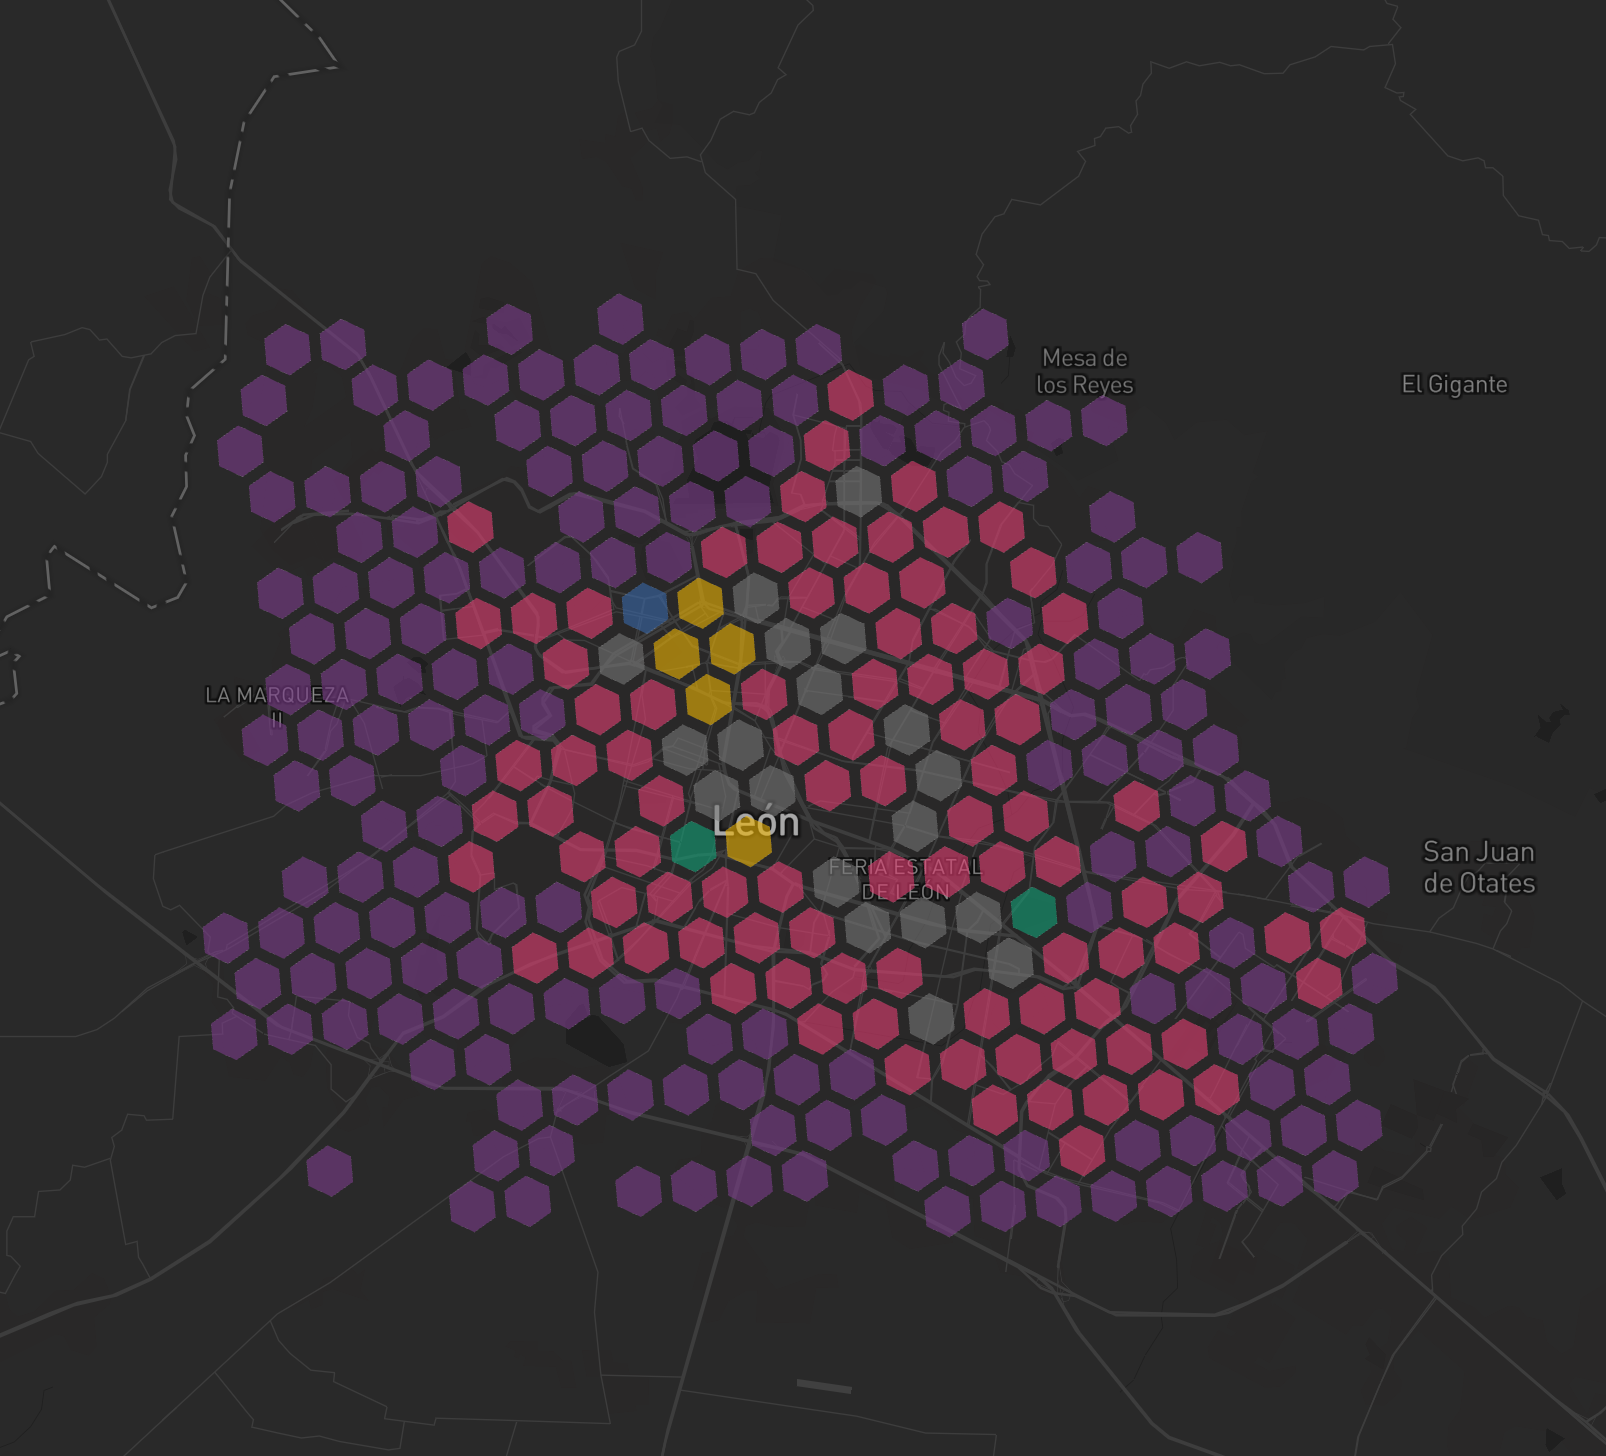
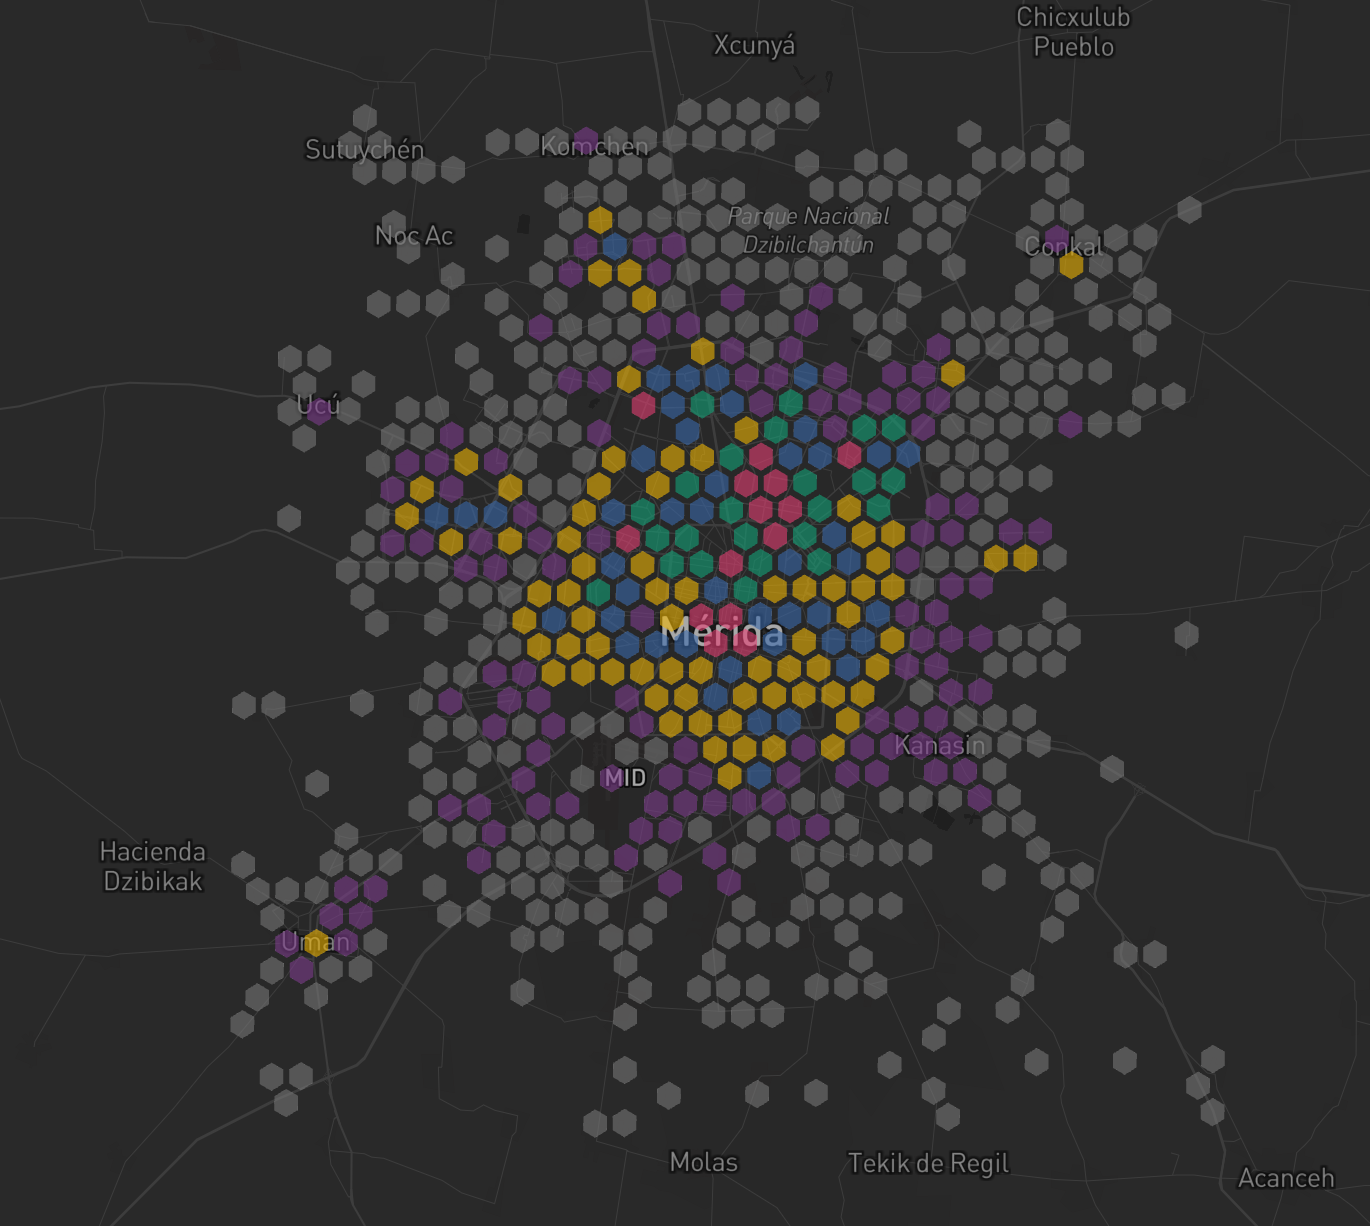
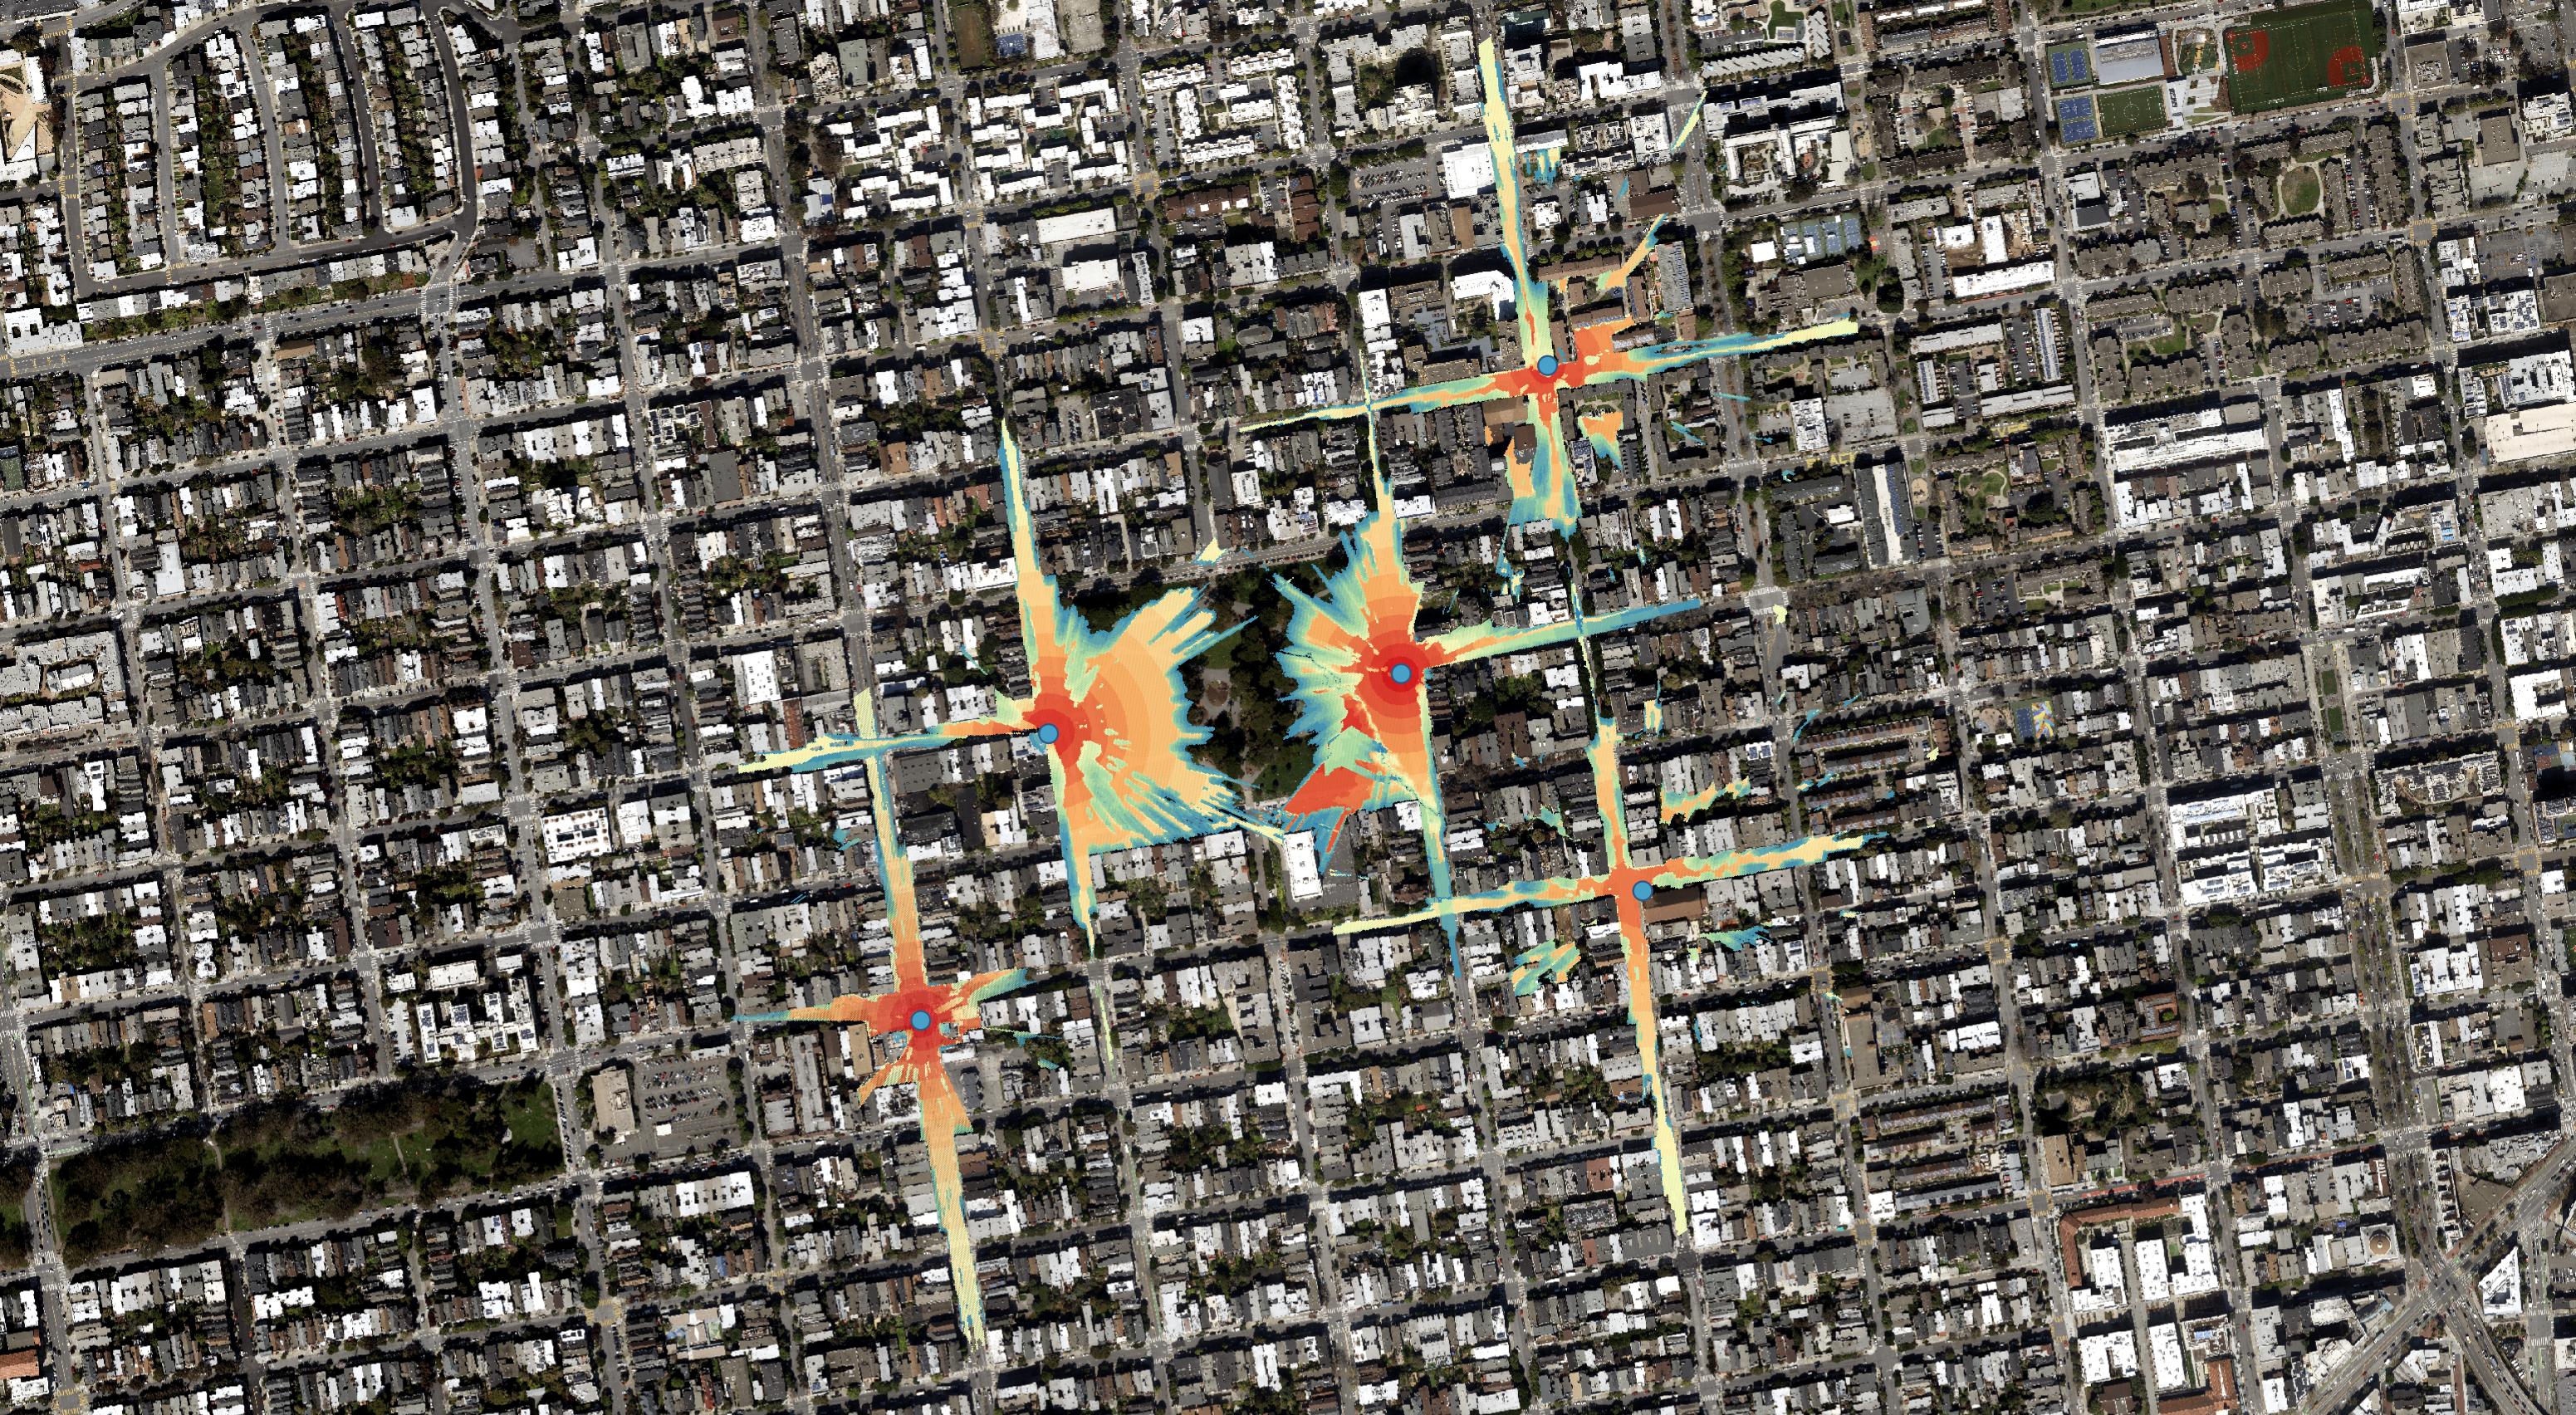
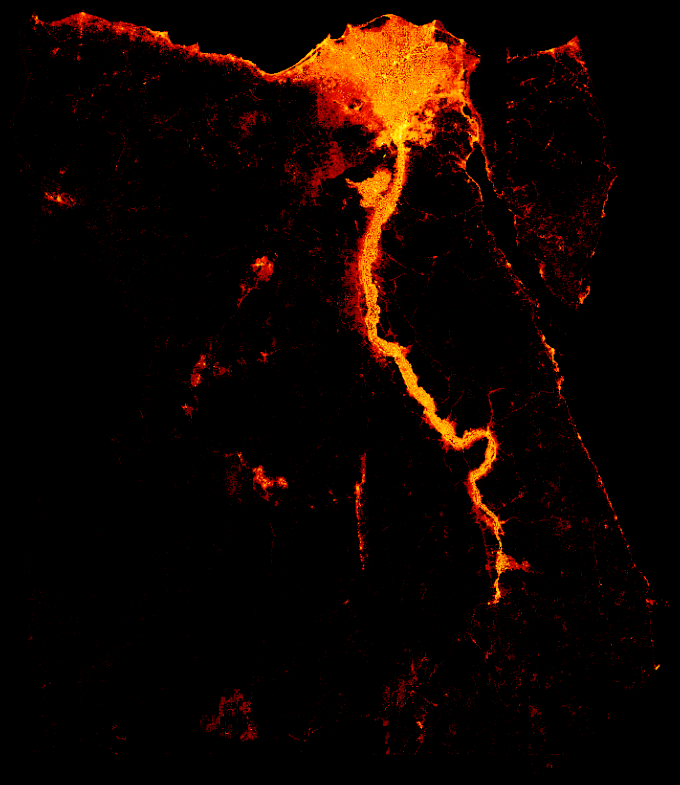
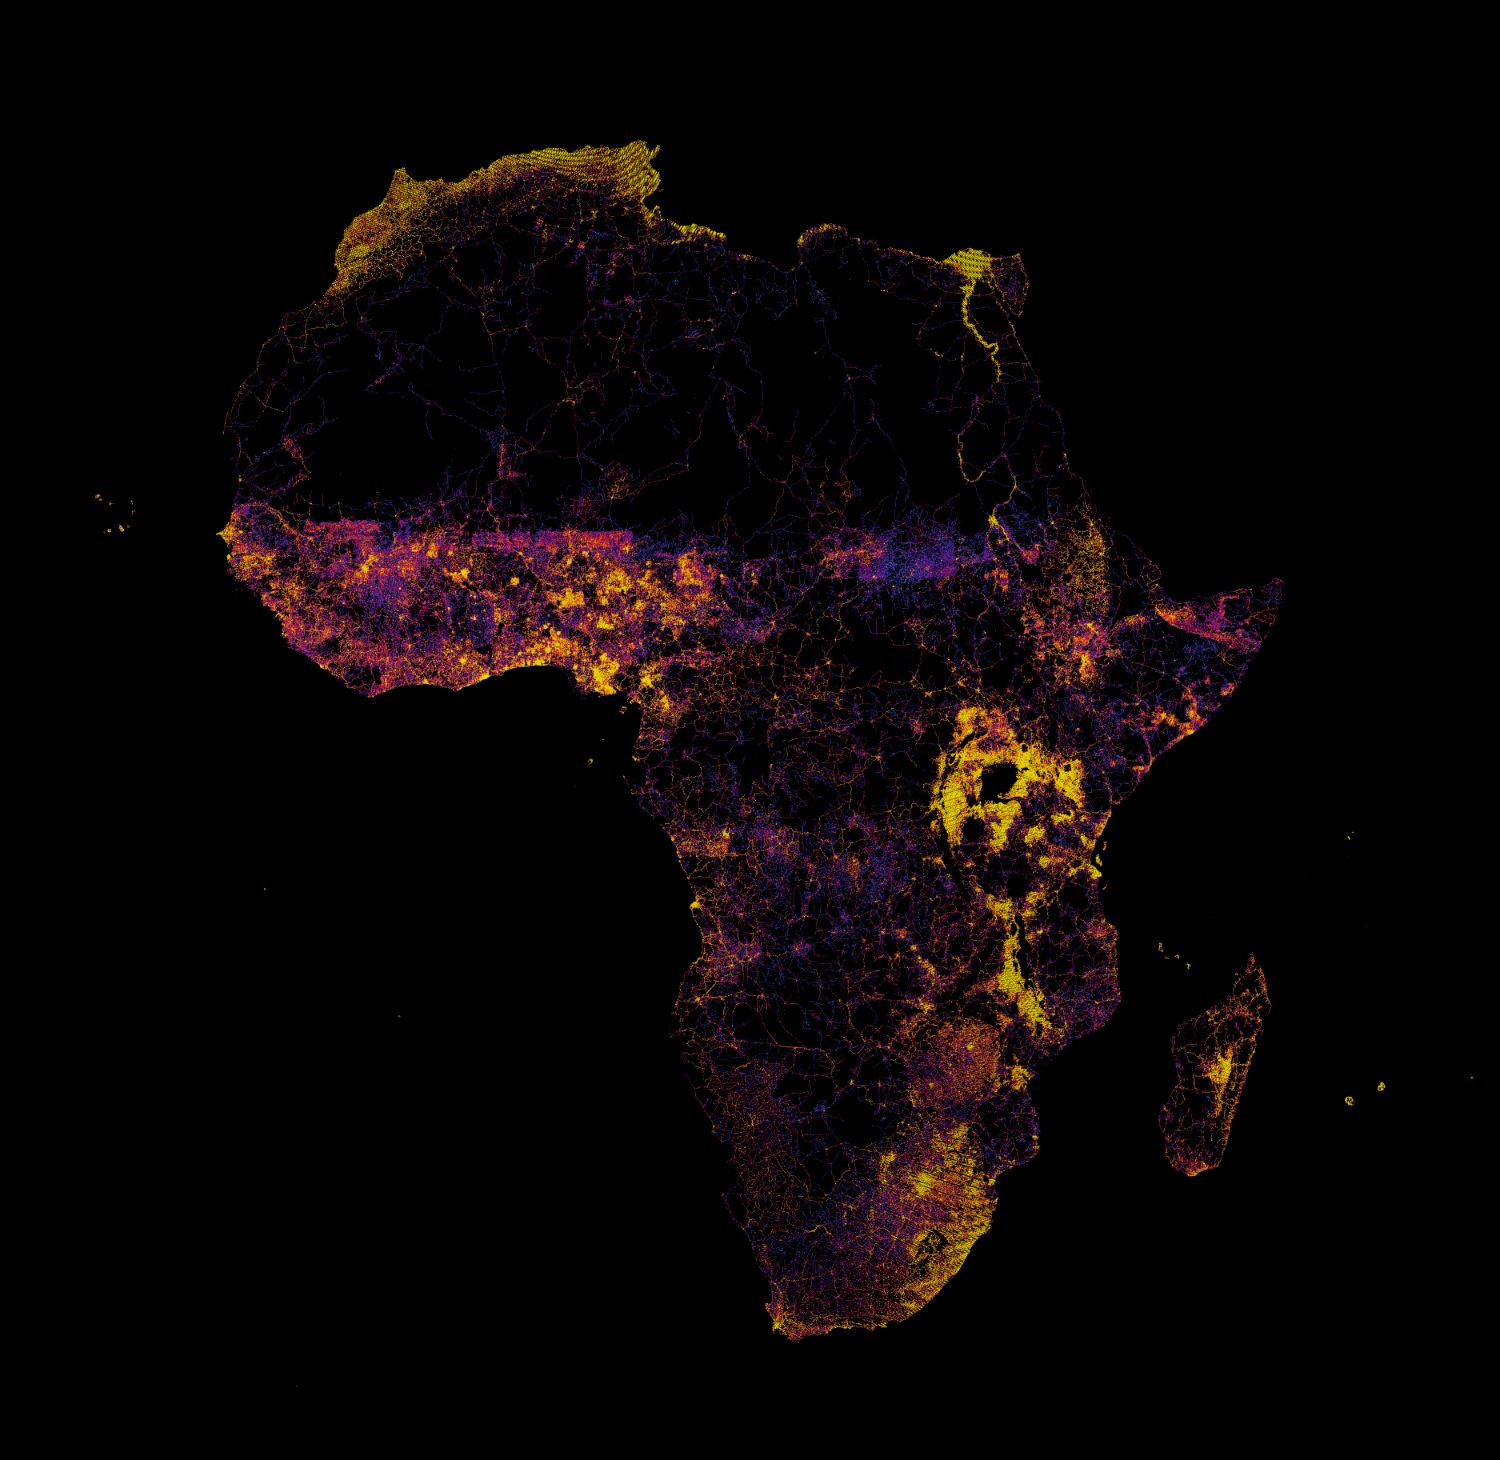
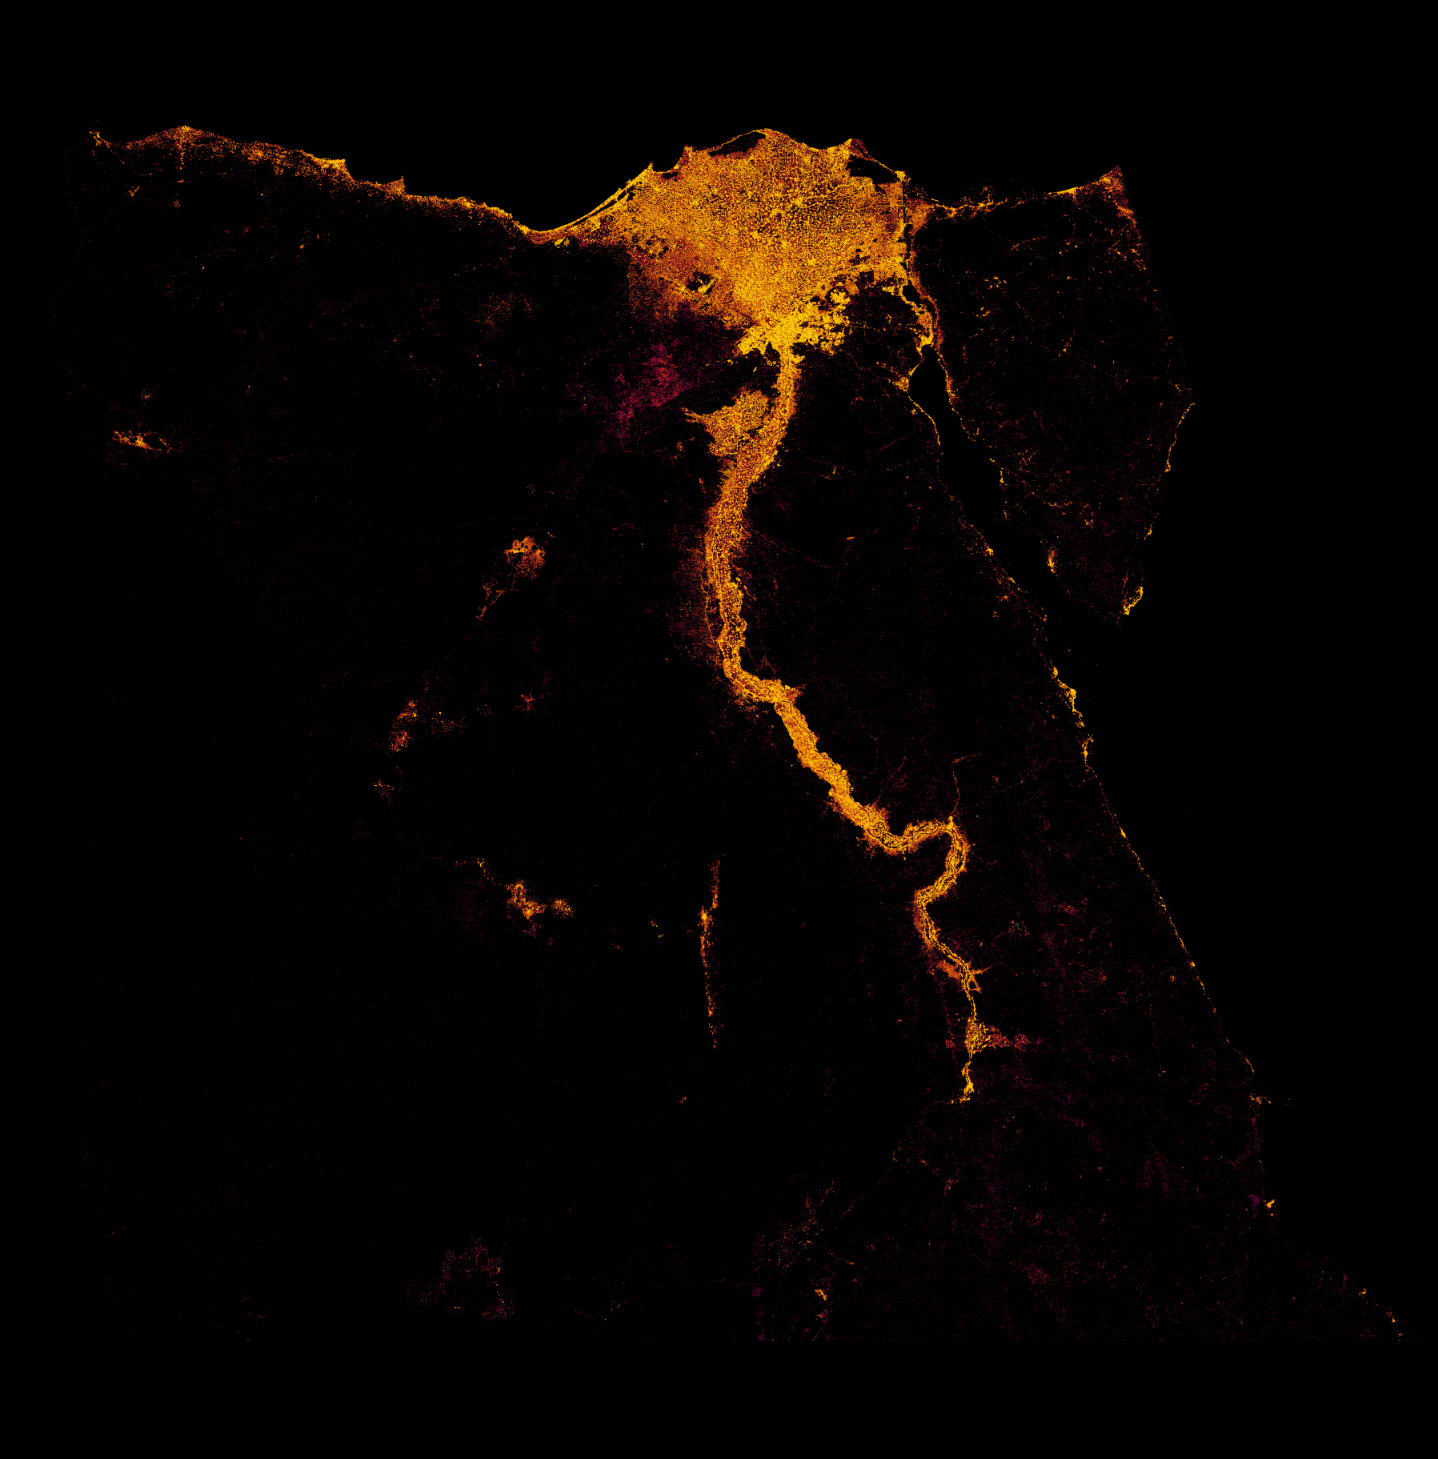
Remember from the previous post how we transformed one data point per county into <strong>20,000</strong> by taking only SIF measurements for corn? Let's visualize that for the first collection in May (we get two collections per month -a and b):</p>
<!-- -->
<div style="text-align:center"><img src="https://docs-staging.fused.io/pr/532/assets/images/kr1-90b6c6c3bbd7cc606cb96f57971263ef.png" alt="File"></div>
<p>
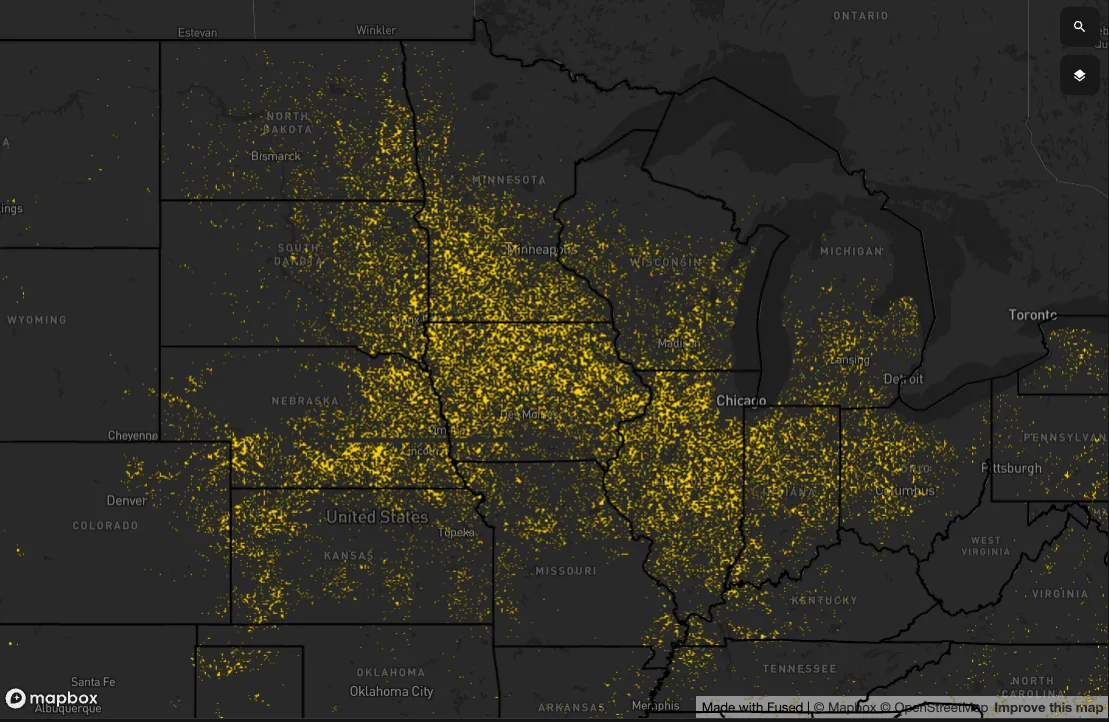
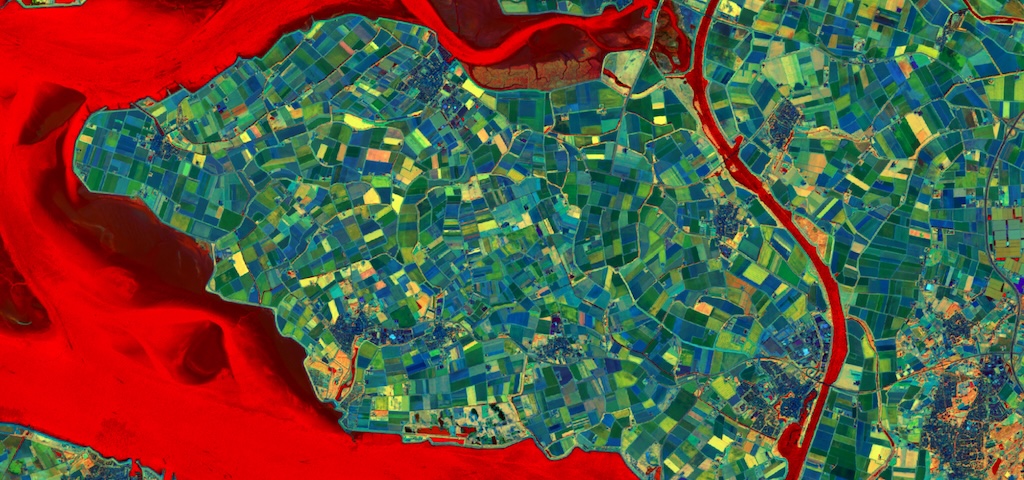
Now, suppose we want to do this where corn is grown in the midwest US. Here is what the states that grew corn in 2018:</p>
<!-- -->
<div style="text-align:center"><img src="https://docs-staging.fused.io/pr/532/assets/images/kr2-f7385209cf64062c4442d11e645dd6eb.png" alt="File"></div>
<p>Within these states, we have <strong>1,333 counties</strong>. Assuming each is similar in size to my home county of Lyon County, we can calculate:</p>
<p>1,333 counties × 20,000 data points = <strong>26 million data points</strong></p>
<p>That's <strong>20,000 times</strong> the statistical power! 🎉</p>
<p>Let me say that louder for the people in the back: <strong>26,000,000 vs. 1,333 data points</strong></p>
<p>And that's just for one time period. If we run a model on 2–4 time periods, we're looking at nearly <strong>100 million data points</strong>. Now, building a model on 100 million data points isn't trivial, but at Fused, this process becomes a breeze.</p>
<h2 class="anchor anchorWithStickyNavbar_LWe7" id="building-the-training-dataset">Building the Training Dataset<a href="https://docs-staging.fused.io/pr/532/blog/the-strength-in-weak-data-part-3-prepping-the-model-dataset/#building-the-training-dataset" class="hash-link" aria-label="Direct link to Building the Training Dataset" title="Direct link to Building the Training Dataset">​</a></h2>
<p>I'm aiming to predict corn yield based on my SIF readings from early May, late May, early June, and late June. So, we need to build out a table with this structure:</p>
<table><thead><tr><th>County</th><th>Year</th><th>Yield (bushels per acre)</th><th>Area of Corn (acres)</th><th>Area of County (acres)</th><th>SIF Value-201605a (early May)</th><th>SIF Value-201605a (late May)</th></tr></thead><tbody><tr><td>17015</td><td>2016</td><td>205</td><td>124,145</td><td>3,032,0383</td><td>.15</td><td>.65</td></tr><tr><td></td><td></td><td></td><td></td><td></td><td></td><td></td></tr></tbody></table>
<p>
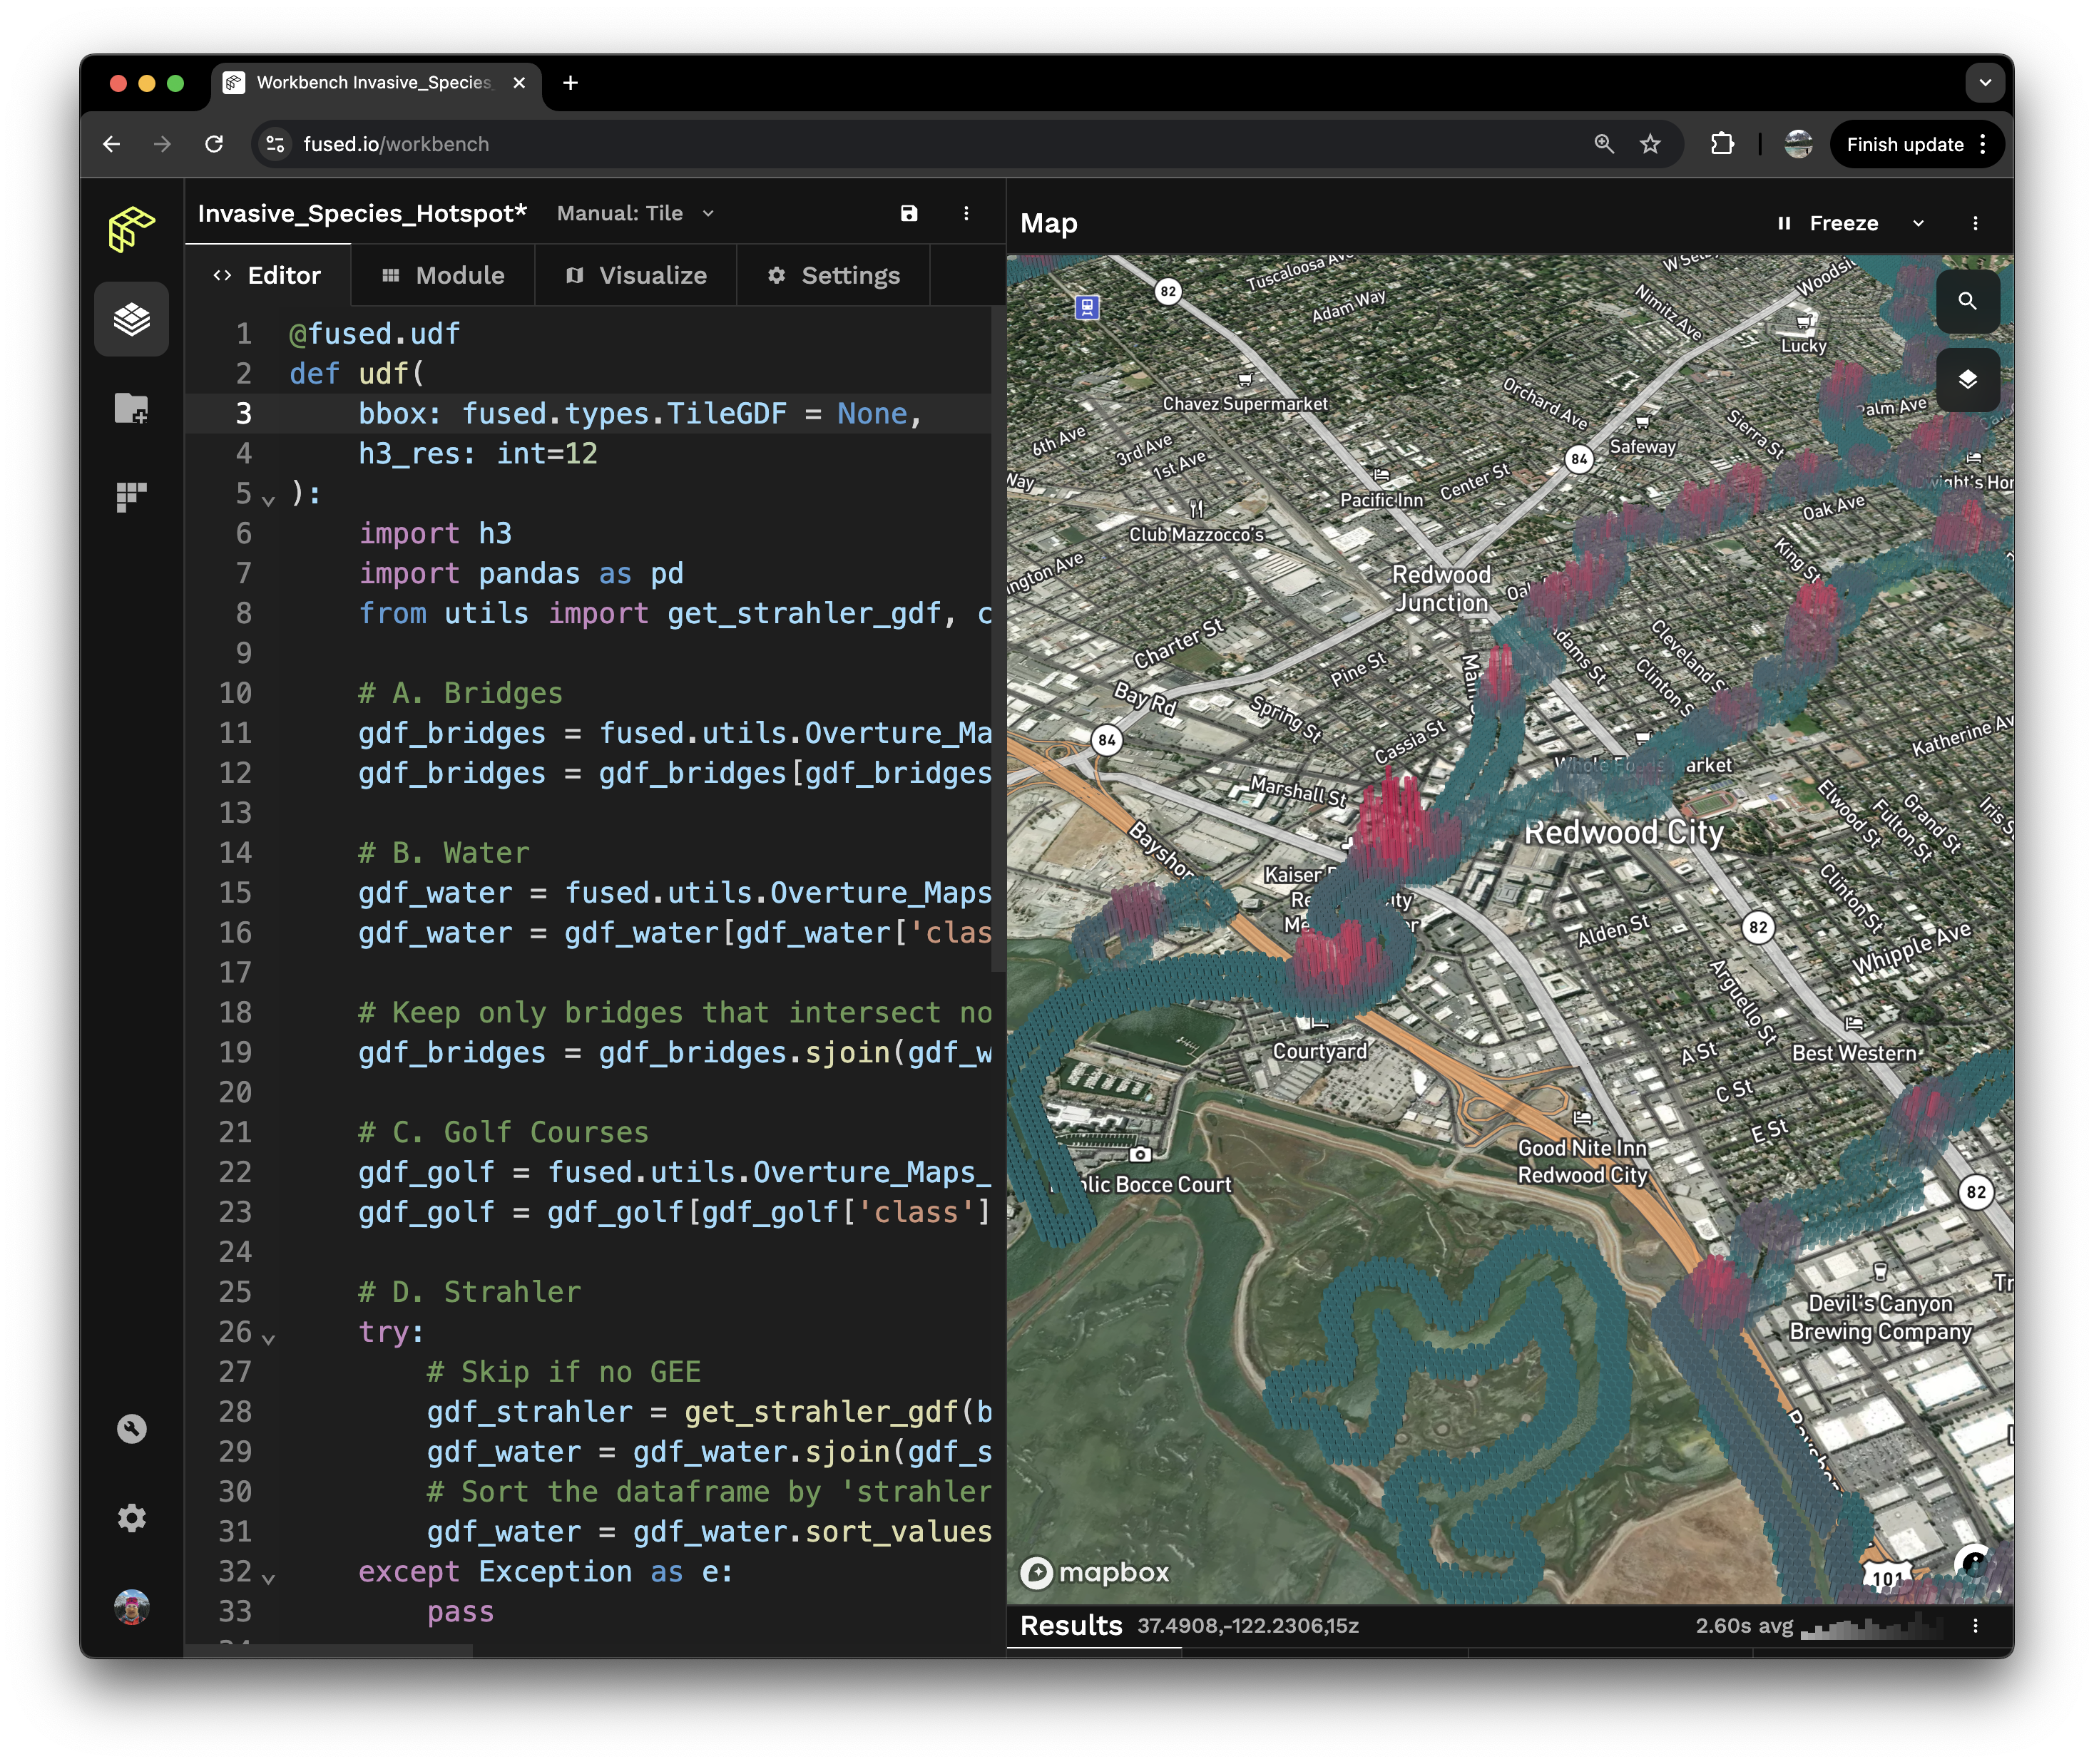
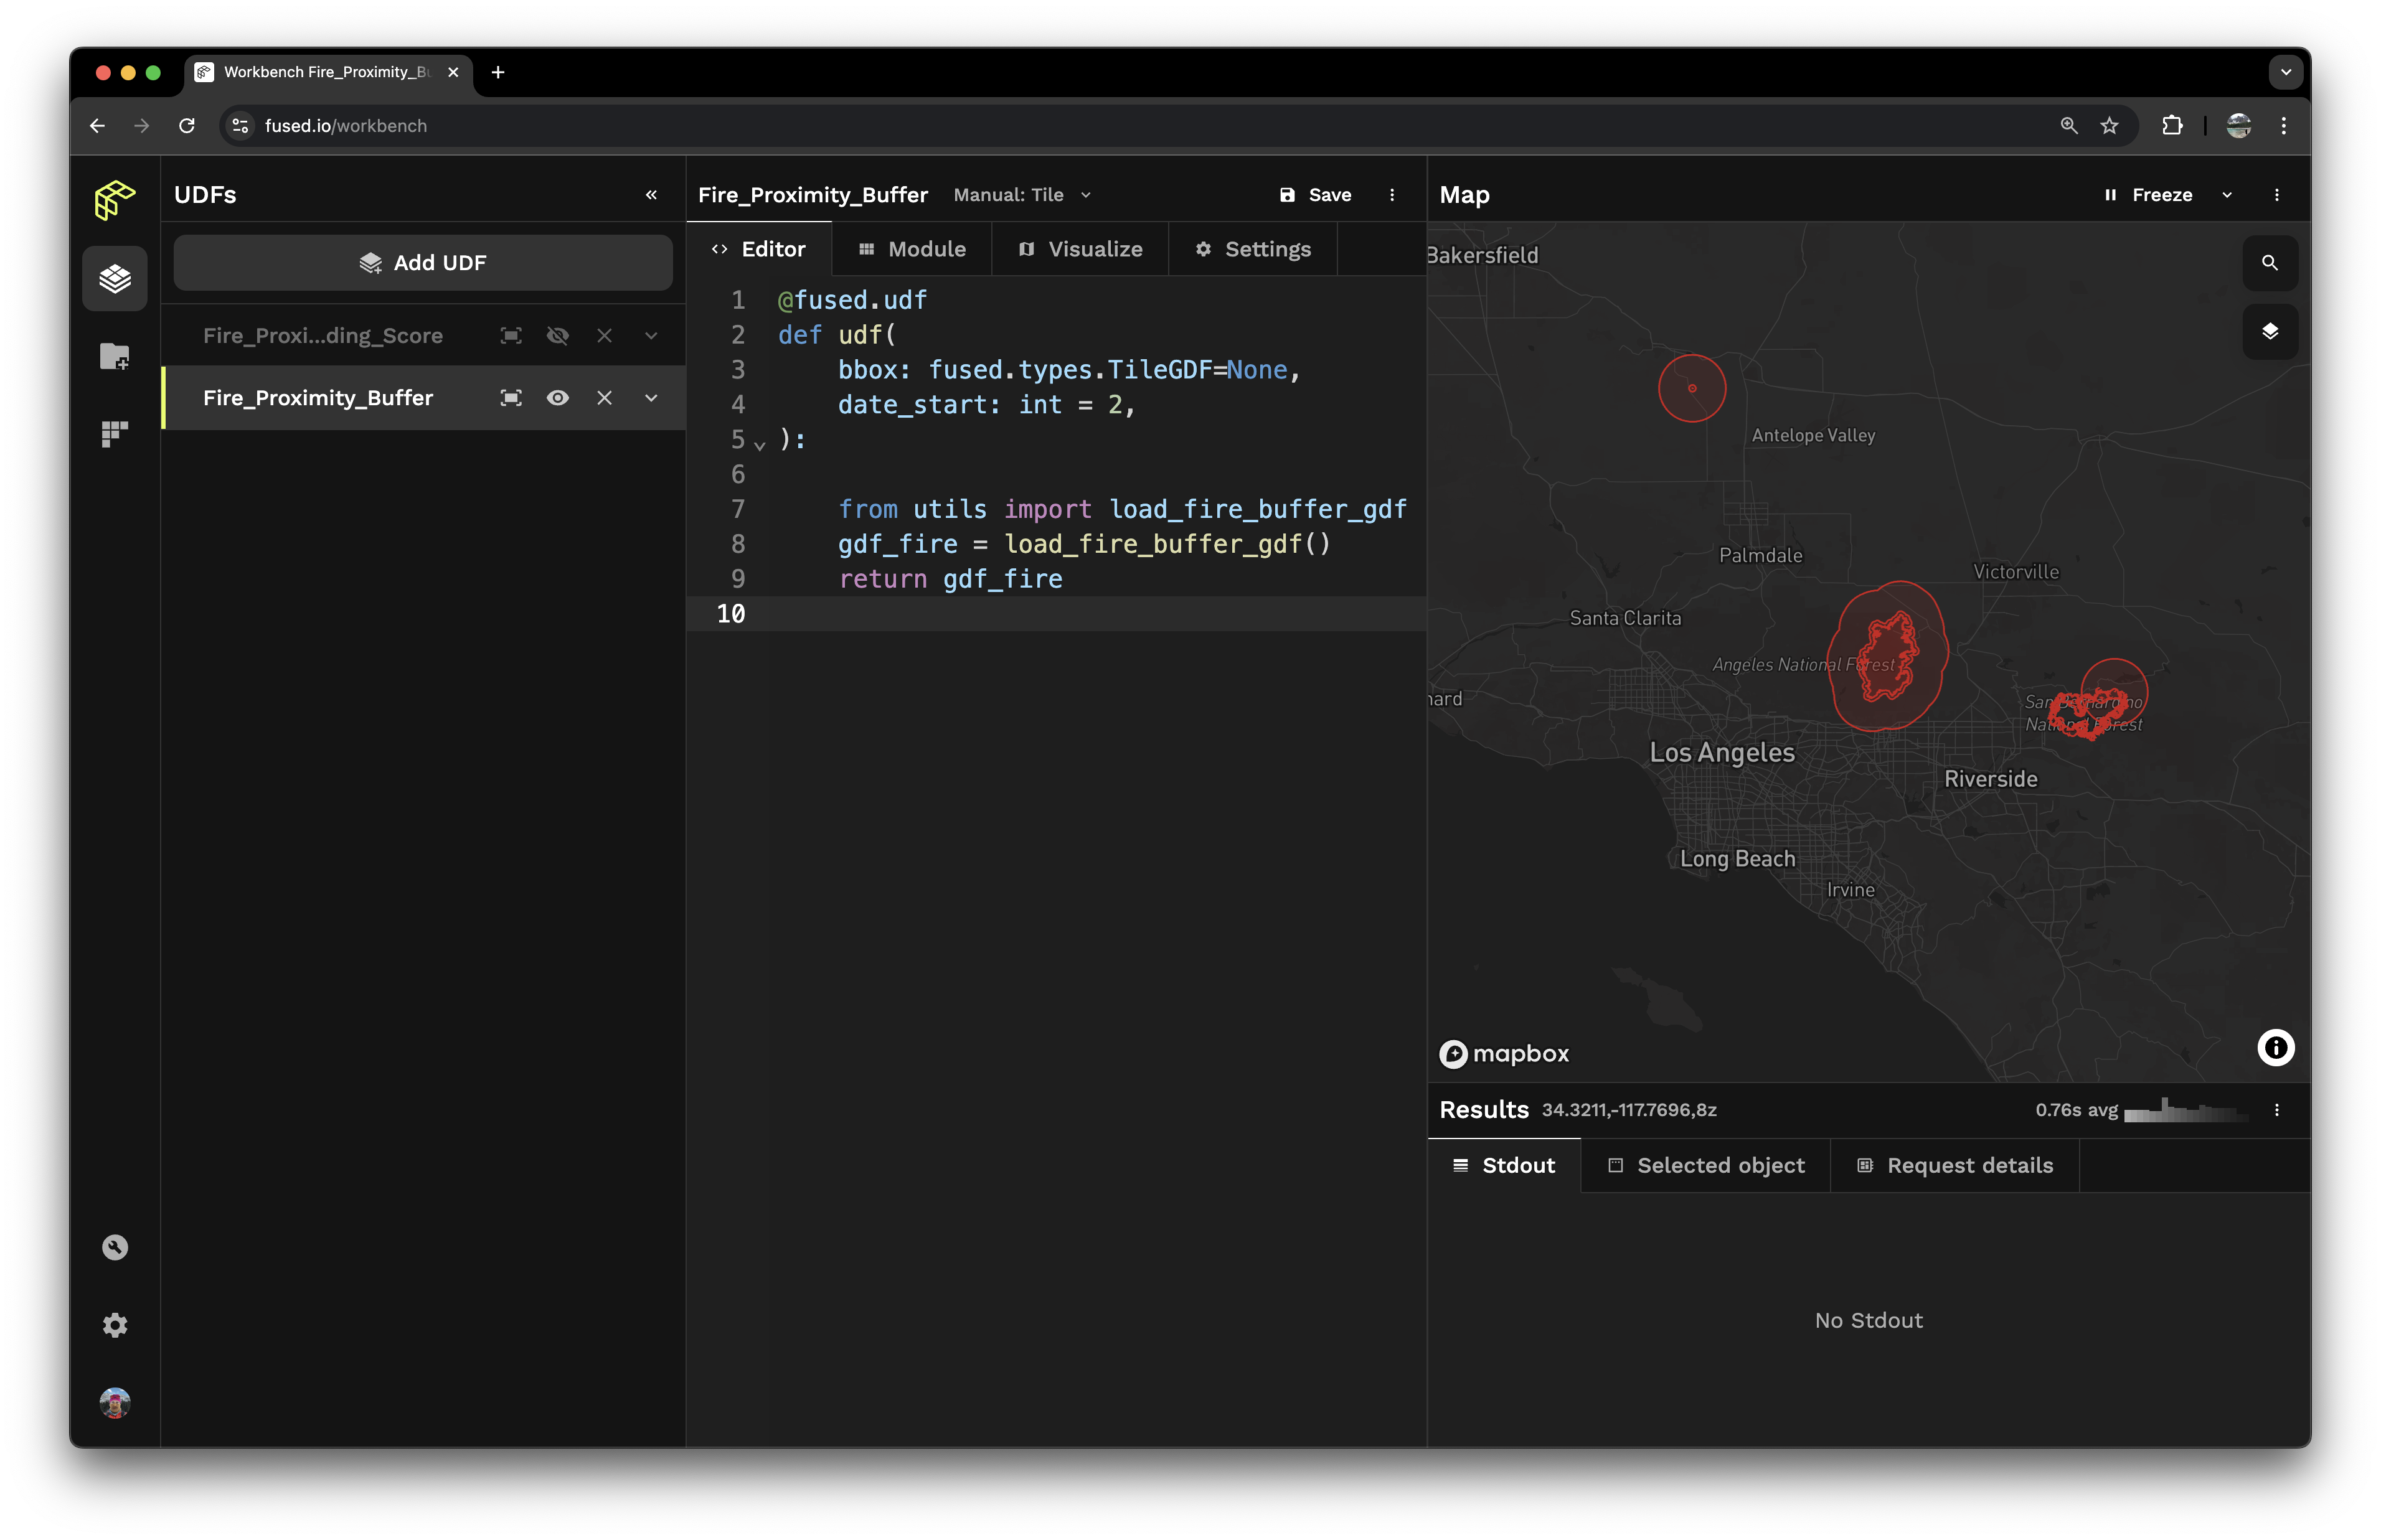
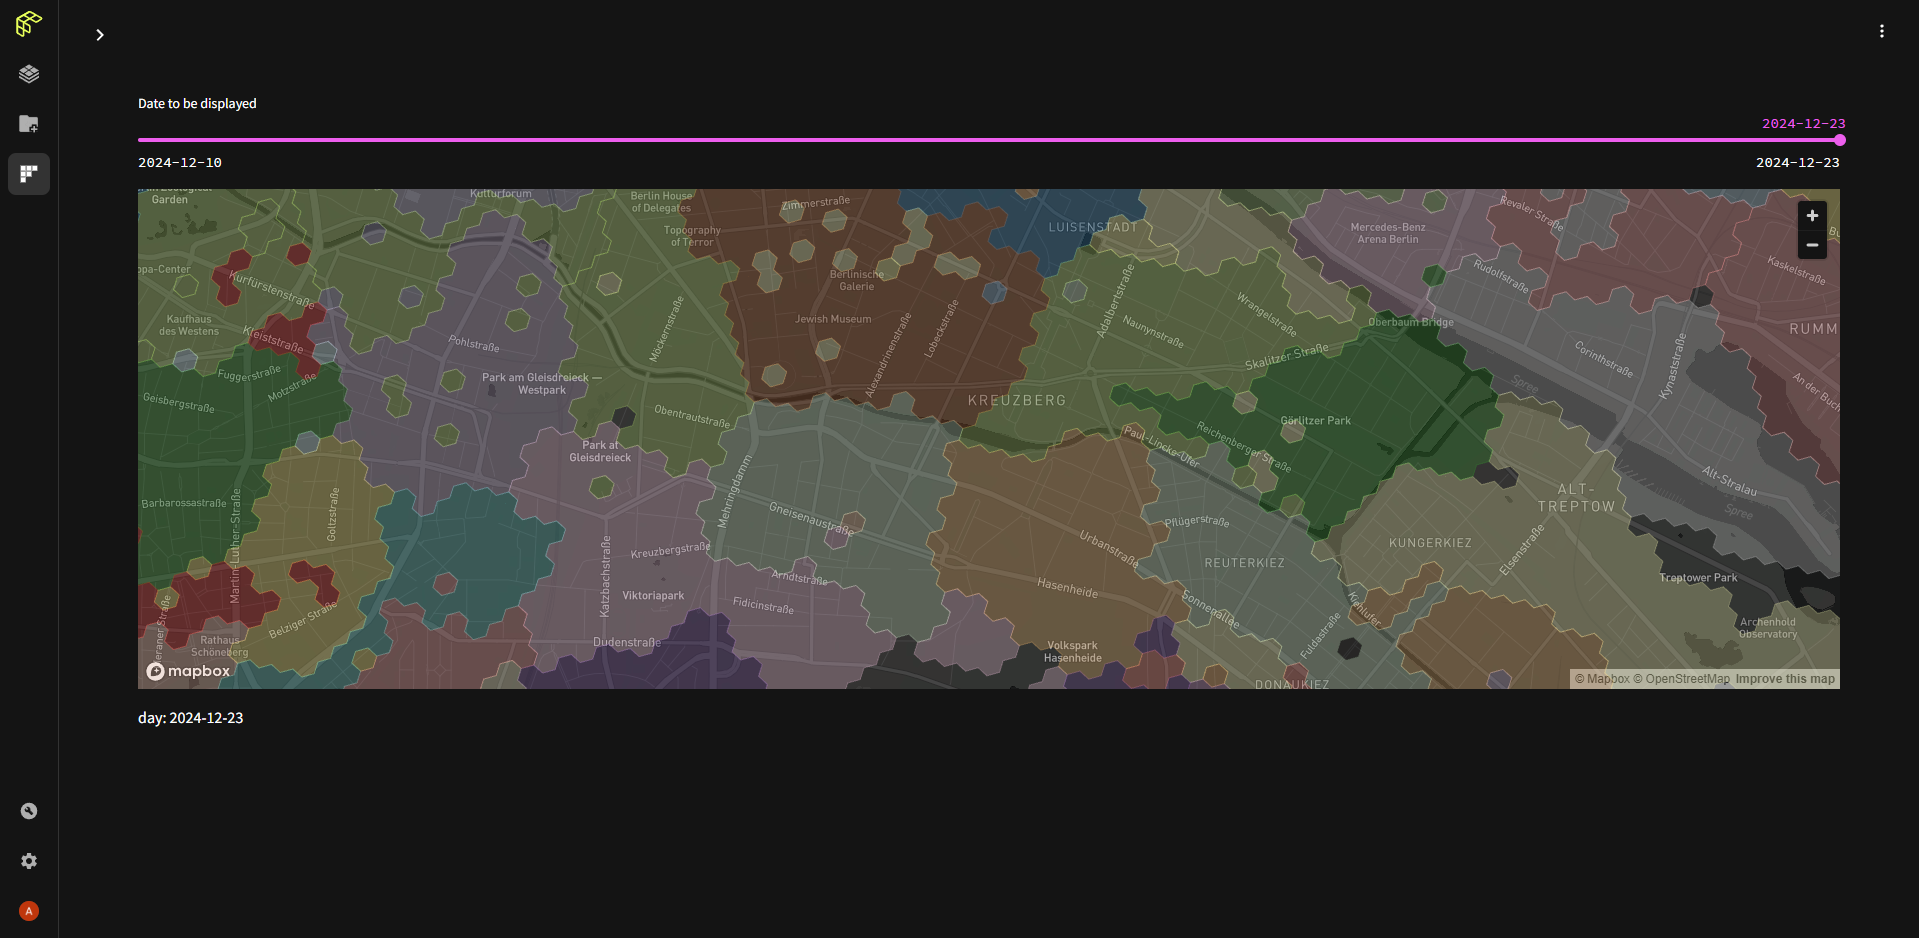
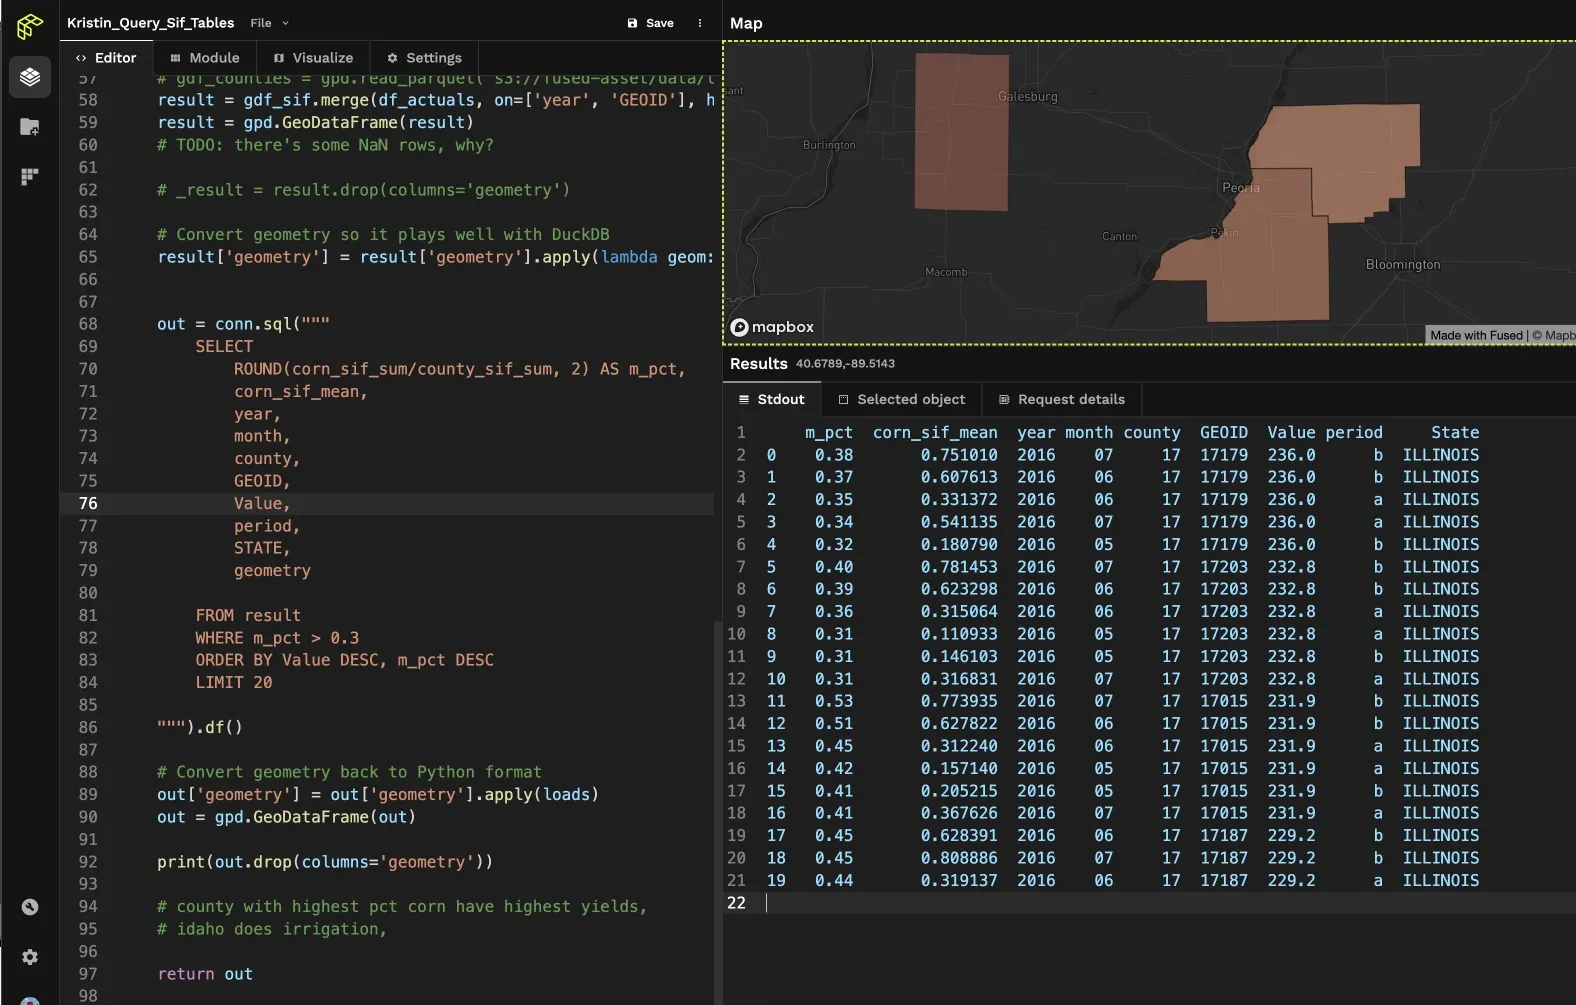
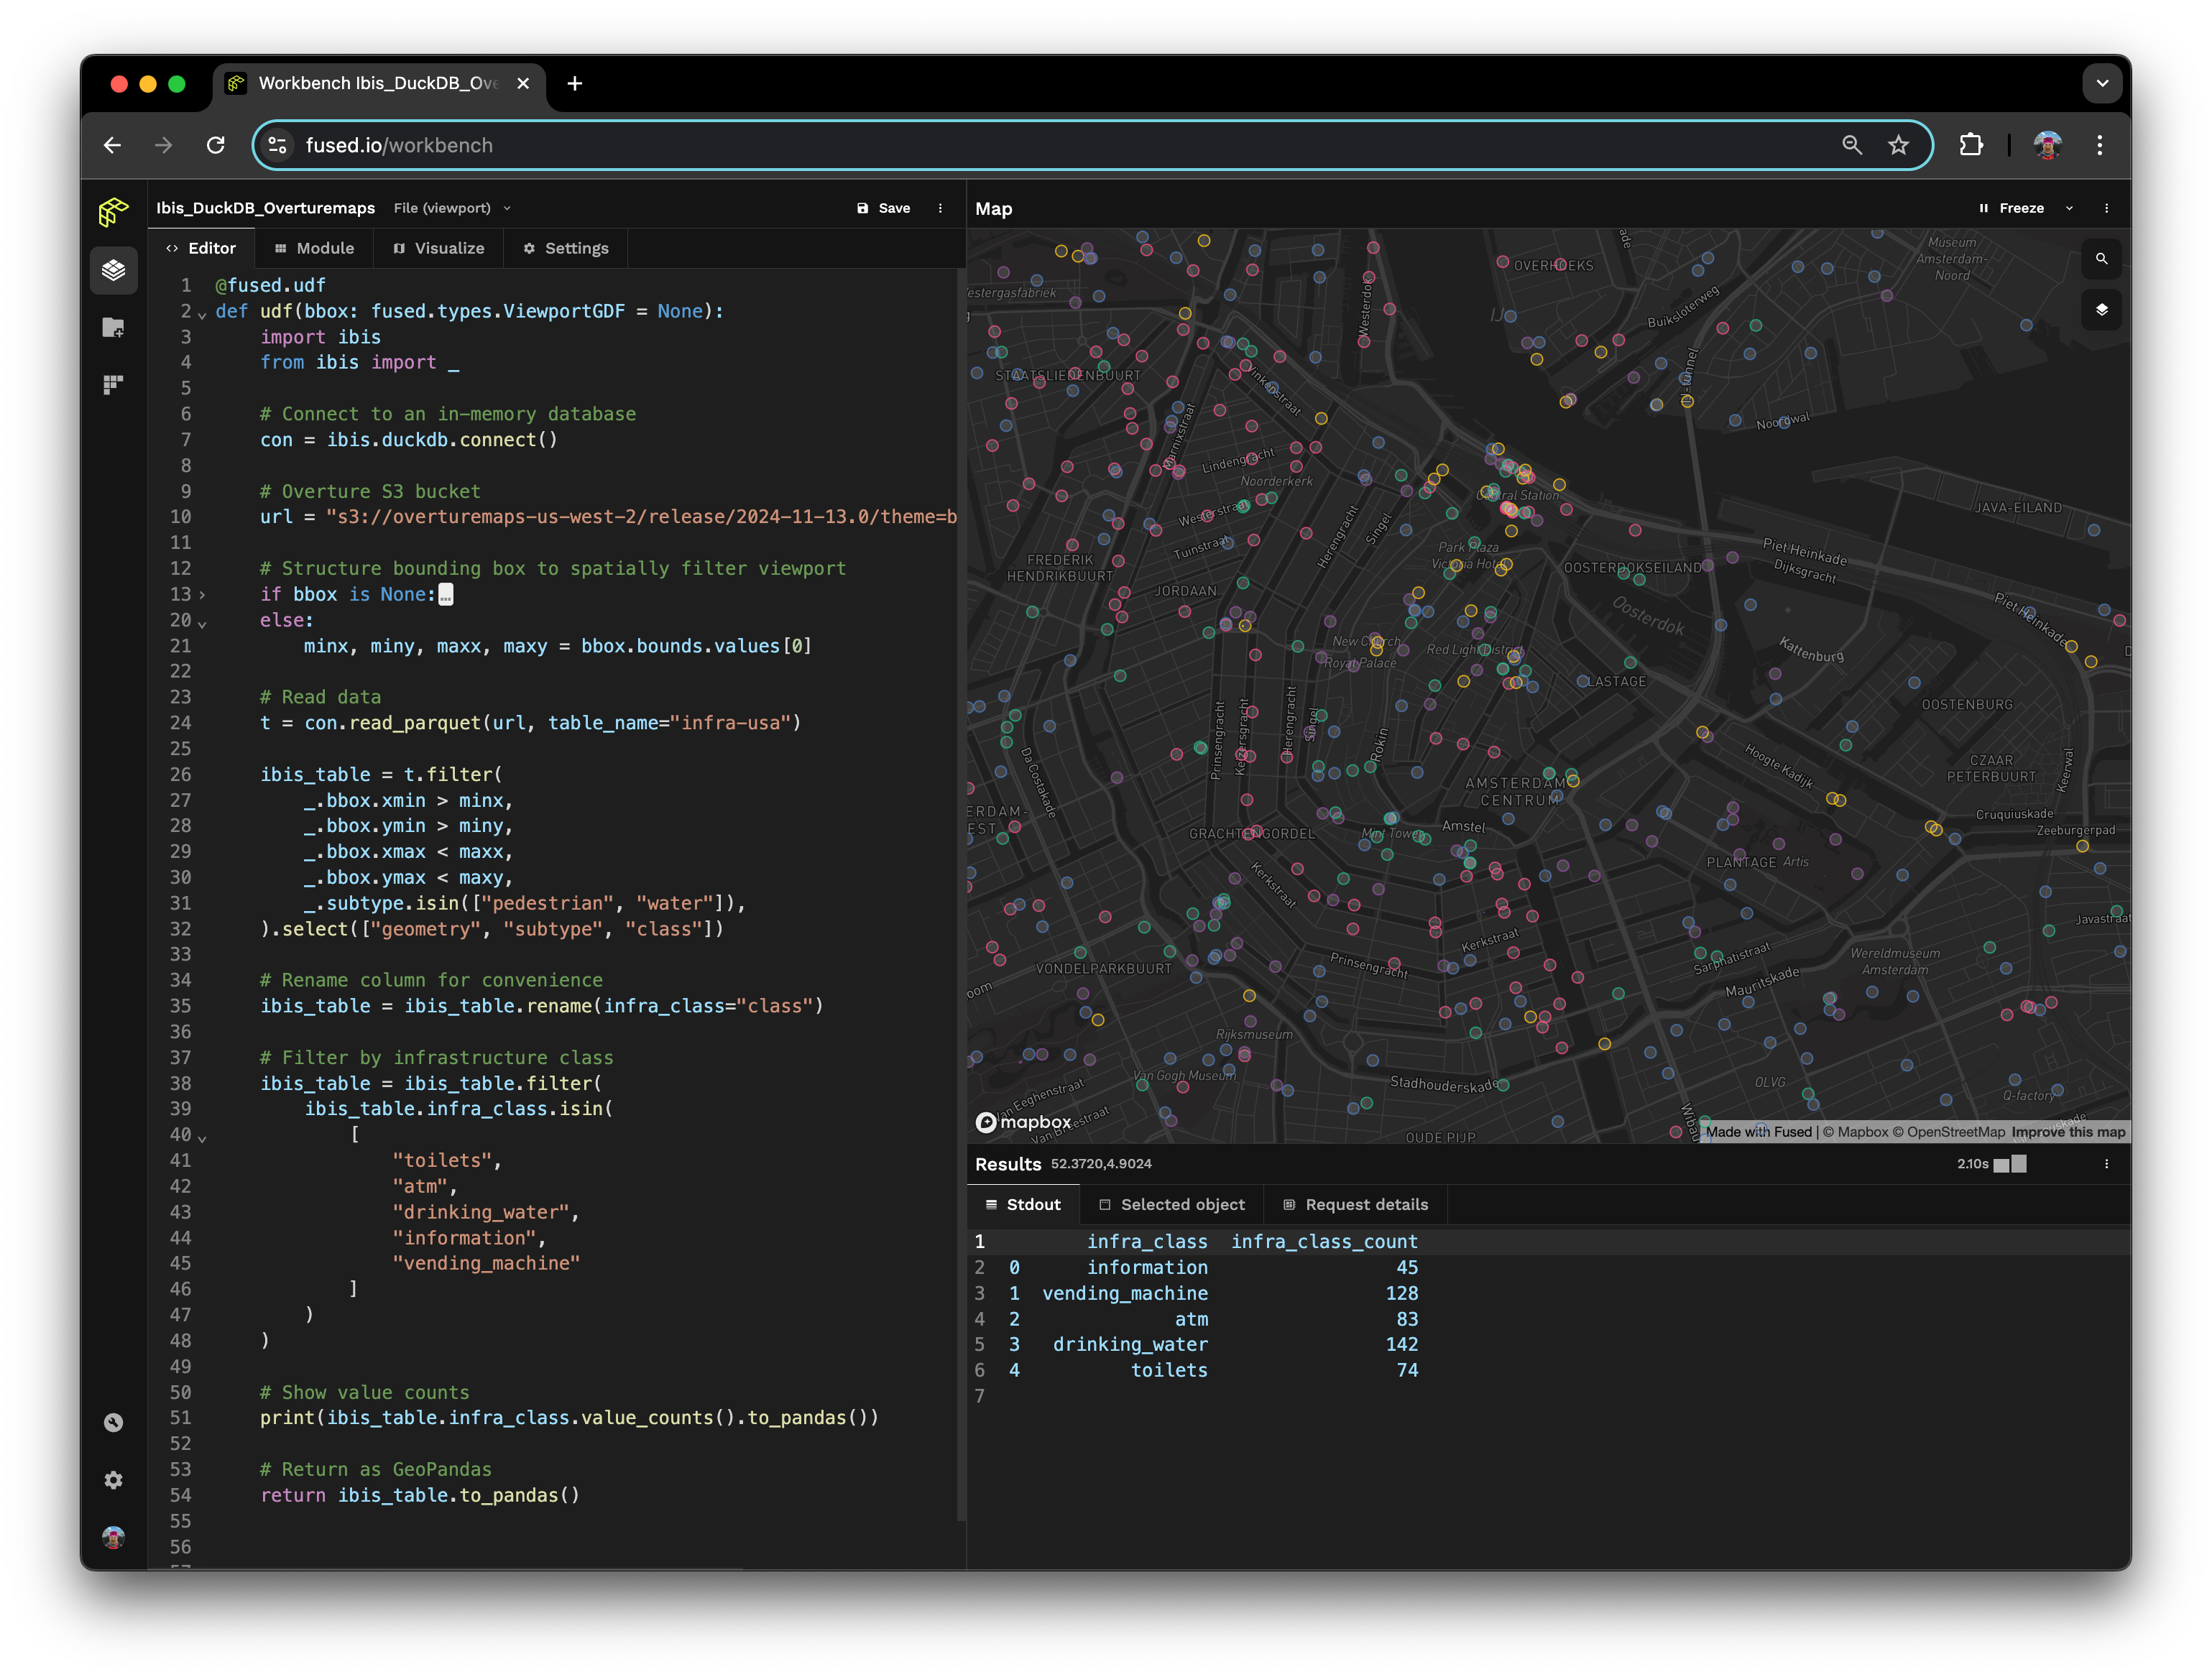
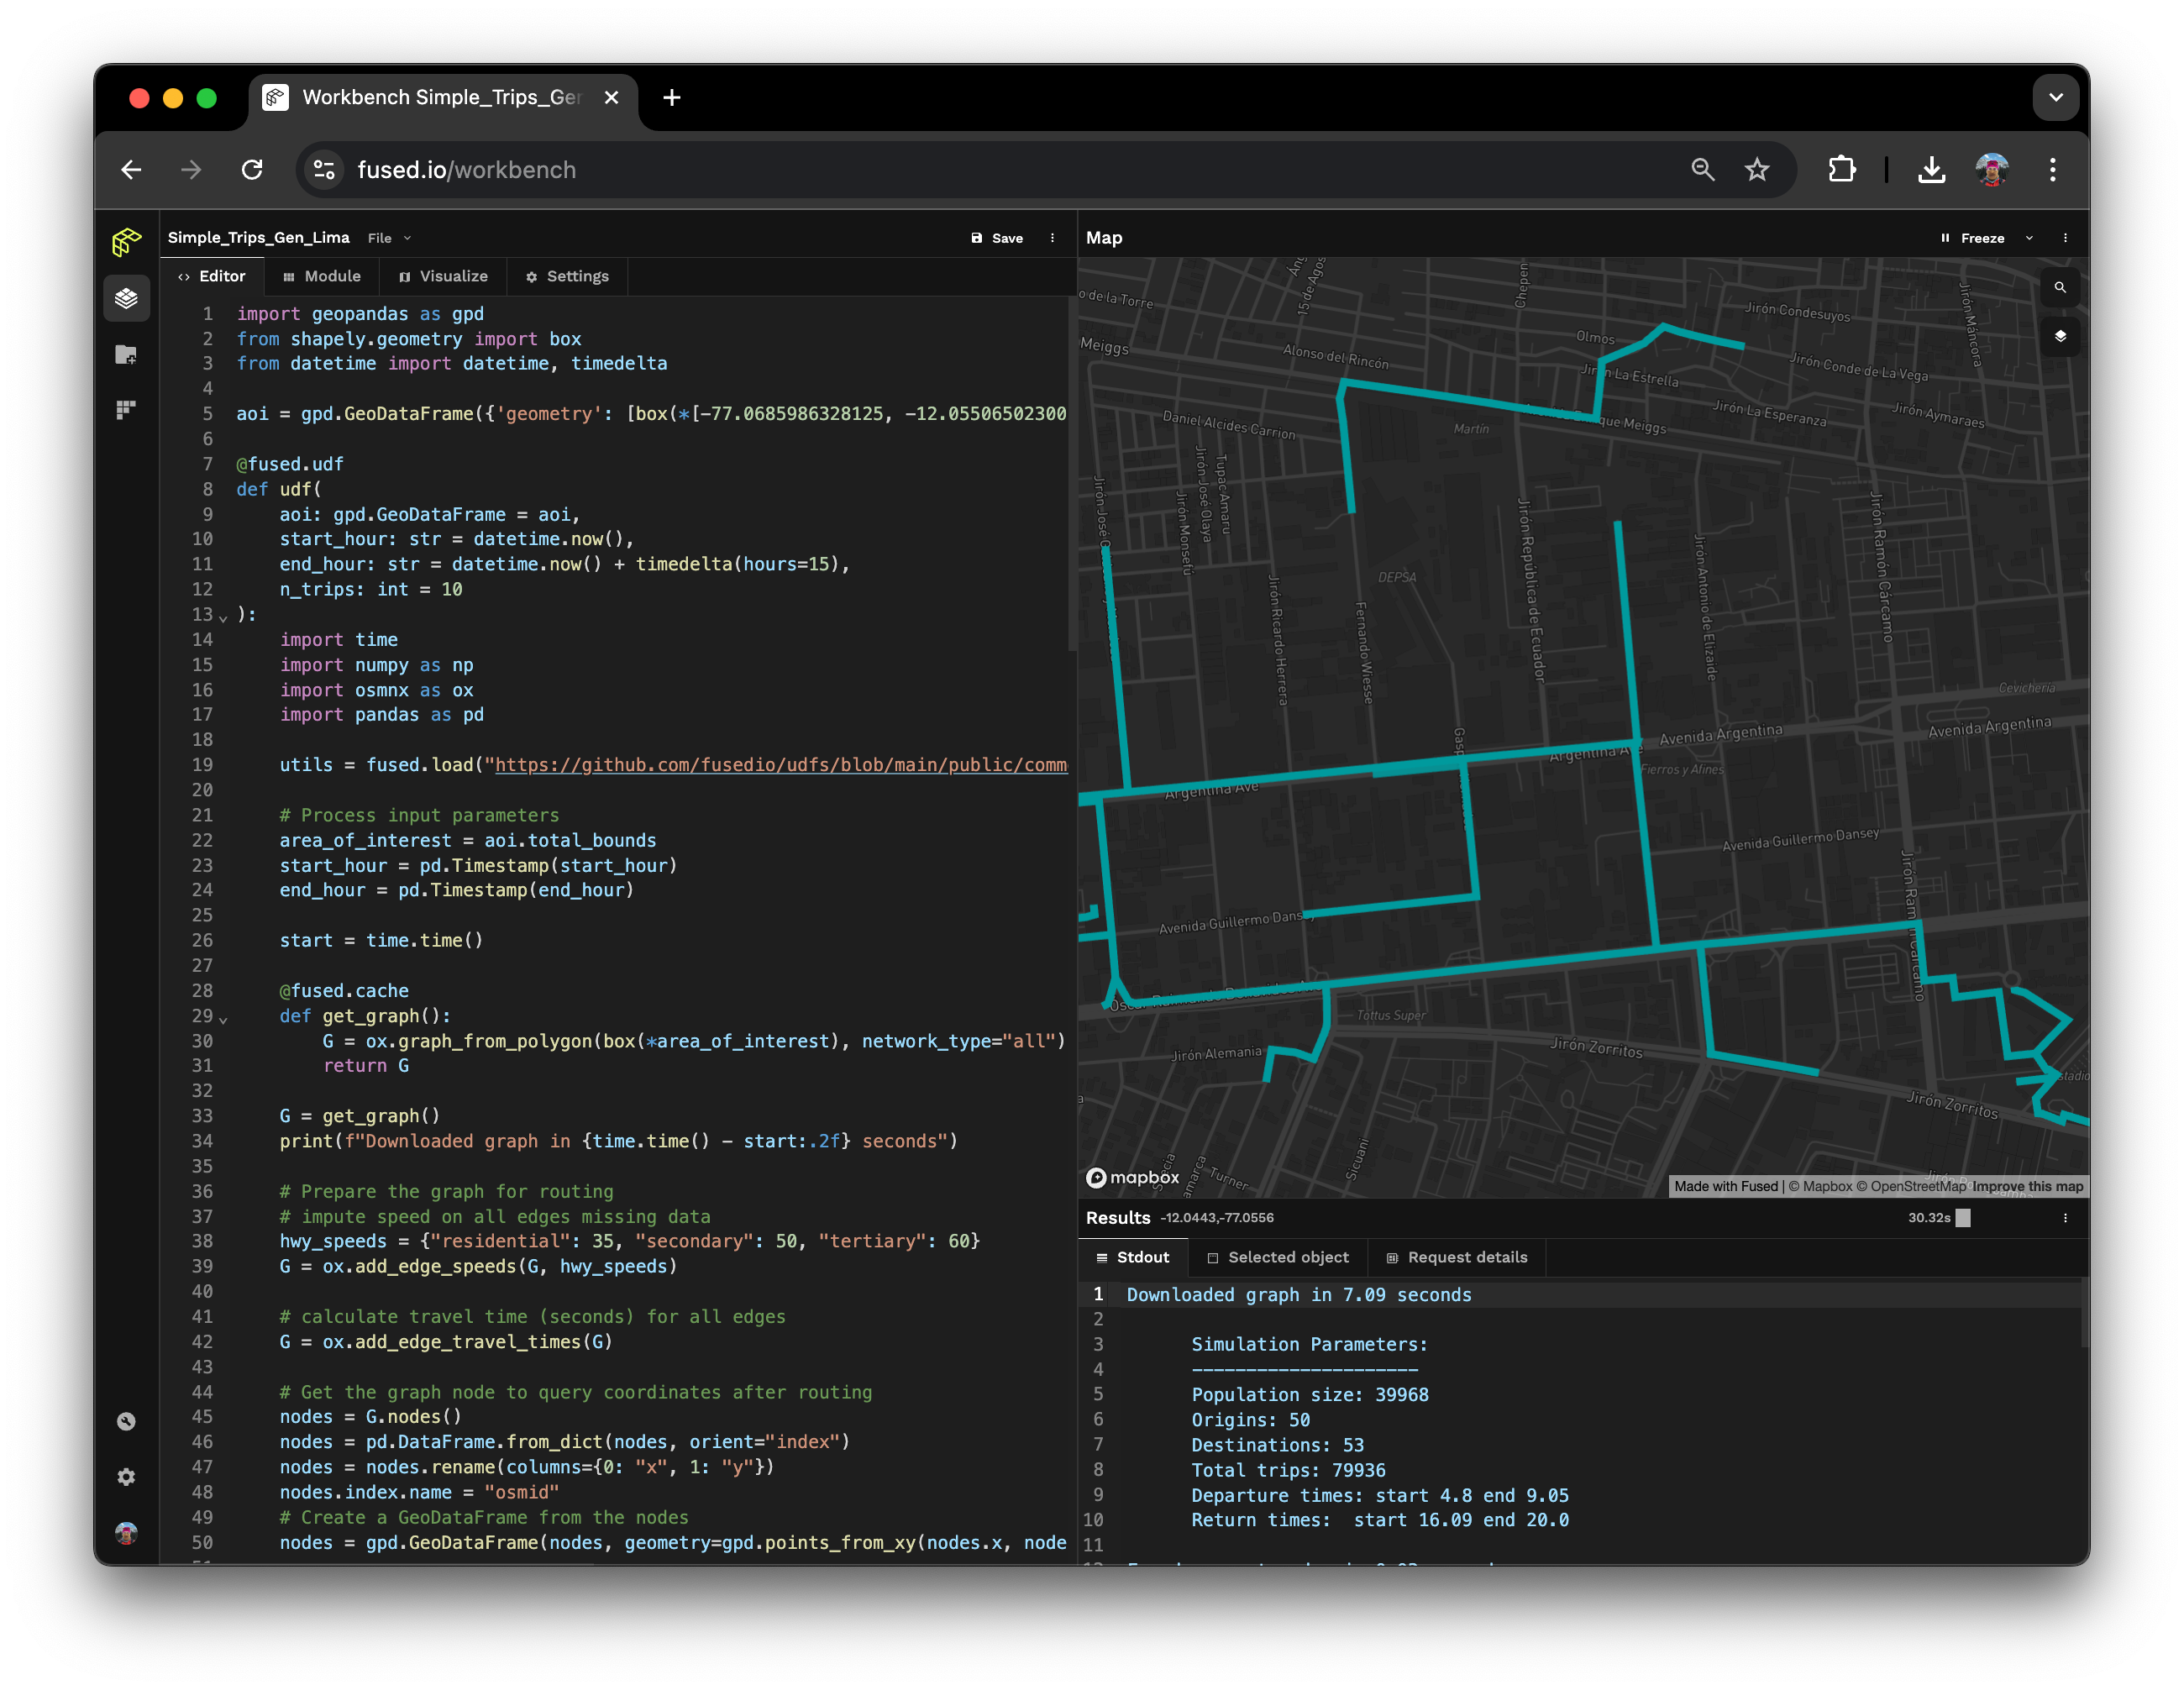
To quickly validate this table against a map, I'll build out my workflow in Fused using Python and query the table with SQL. In the past, working with these two languages would have required complex tooling, storing data in a warehouse, and roughly <strong>five hours</strong> to run. With Fused, I can simply reference the a GeoDataFrame object and query in SQL with DuckDB all within the same UDF—taking just <strong>five seconds</strong>!</p>
<p>Here's what it looks like:</p>
<!-- -->
<div style="text-align:center"><img src="https://docs-staging.fused.io/pr/532/assets/images/kr3-4b6dd1f9d6fae9747b1bcb5ff1c3158e.png" alt="File"></div>
<h2 class="anchor anchorWithStickyNavbar_LWe7" id="splitting-the-data">Splitting the Data<a href="https://docs-staging.fused.io/pr/532/blog/the-strength-in-weak-data-part-3-prepping-the-model-dataset/#splitting-the-data" class="hash-link" aria-label="Direct link to Splitting the Data" title="Direct link to Splitting the Data">​</a></h2>
<p>But we're not stopping there! To ensure our model is both robust and unbiased, we need to carefully split our data. Enter <a href="https://www.kaggle.com/code/justozner/time-series-using-walk-forward-validation" target="_blank" rel="noopener noreferrer">Walk-Forward Cross-Validation</a> — a game-changer for time series data. Think of it like planting seeds each season and harvesting them before the next planting. By always training on past data and testing on future data, we respect the natural flow of time. This method is perfect for corn yields because, just like how last year's harvest influences this year's, our model benefits from understanding those temporal dependencies. Plus, it prevents any sneaky data leakage, ensuring our predictions are based solely on what's known up to that point.</p>
<div style="width:100%;height:100%" class="video__player"></div>
<h2 class="anchor anchorWithStickyNavbar_LWe7" id="conclusion-and-next-steps">Conclusion and Next Steps<a href="https://docs-staging.fused.io/pr/532/blog/the-strength-in-weak-data-part-3-prepping-the-model-dataset/#conclusion-and-next-steps" class="hash-link" aria-label="Direct link to Conclusion and Next Steps" title="Direct link to Conclusion and Next Steps">​</a></h2>
<p>Keep going or end here?</p>
<p>By progressively expanding our training set, each fold builds on the last, capturing more nuanced patterns and trends. To bring this to life, I'm leveraging <a href="https://scikit-learn.org/stable/modules/generated/sklearn.model_selection.TimeSeriesSplit.html" target="_blank" rel="noopener noreferrer">TimeSeriesSplit</a> from <strong>sklearn</strong>, seamlessly integrating it into our workflow. This tool simplifies the process, allowing us to focus on what truly matters—unlocking the full potential of our 100 million data points for actionable predictions.</p>
<p>And there you have it! We've taken weak, infrequent data and transformed it into a powerhouse dataset ready to drive smarter decisions in the $21 billion corn commodities market. Stay tuned for the next part of our journey, where we'll dive into building and fine-tuning our predictive models. Until then, keep cultivating those insights! 🌽</p>]]></content>
        <author>
            <name>Kristin Scholten</name>
            <uri>https://www.linkedin.com/in/kristinscholten/</uri>
        </author>
        <category label="crop" term="crop"/>
        <category label="yield" term="yield"/>
        <category label="corn" term="corn"/>
        <category label="prediction" term="prediction"/>
        <category label="model" term="model"/>
    </entry>
    <entry>
        <title type="html"><![CDATA[Streamlining Infrastructure Risk Analysis with Fused]]></title>
        <id>https://docs-staging.fused.io/pr/532/blog/streamlining-infrastructure-risk-analysis-with-fused/</id>
        <link href="https://docs-staging.fused.io/pr/532/blog/streamlining-infrastructure-risk-analysis-with-fused/"/>
        <updated>2024-12-11T00:00:00.000Z</updated>
        <summary type="html"><![CDATA[TL;DR Jacob at VIDA uses Fused to streamline processing and rendering of CMIP6 climate risk models, improving data sharing and sanity checks.]]></summary>
        <content type="html"><![CDATA[<p><strong>TL;DR Jacob at VIDA uses Fused to streamline processing and rendering of CMIP6 climate risk models, improving data sharing and sanity checks.</strong></p>
<!-- -->
<div style="height:360px;width:100%" class="video__player"></div>
<p><a href="https://vida.place/" target="_blank" rel="noopener noreferrer">VIDA</a> uses dozens of the latest generation of climate models to have the most up-to-date climate information, collectively part of the <a href="https://pcmdi.llnl.gov/CMIP6/" target="_blank" rel="noopener noreferrer">Coupled Model Intercomparison Project 6</a> (CMIP6). These models provide a range of possible futures, under different emission scenarios, as well as differences in how each model does its forecast. Using this information, we can create ensembles from the models, and have higher confidence in the risks and hazards we derive from the models, and which we present to our customers.</p>
<p>In this blog post, I show how I created a UDF to pre-process and visually inspect the Zarrs we generate as the output from our climate risk models.</p>
<!-- -->
<div class="theme-admonition theme-admonition-info admonition_xJq3 alert alert--info"><div class="admonitionHeading_Gvgb"><span class="admonitionIcon_Rf37"><svg viewBox="0 0 14 16"><path fill-rule="evenodd" d="M7 2.3c3.14 0 5.7 2.56 5.7 5.7s-2.56 5.7-5.7 5.7A5.71 5.71 0 0 1 1.3 8c0-3.14 2.56-5.7 5.7-5.7zM7 1C3.14 1 0 4.14 0 8s3.14 7 7 7 7-3.14 7-7-3.14-7-7-7zm1 3H6v5h2V4zm0 6H6v2h2v-2z"></path></svg></span>info</div><div class="admonitionContent_BuS1"><p>Find Jacob's UDF code <a href="https://www.fused.io/workbench/catalog/NEX_GDDP_Cmip6_VIDA-b51e5f0f-15bf-4a7b-a6d6-e16fe1ba20e1" target="_blank" rel="noopener noreferrer">here</a>.</p></div></div>
<p>As the Senior Machine Learning Engineer at VIDA, I work daily with large, multidimensional geospatial datasets to determine the future risks to infrastructure from climate change globally. These risks and hazards help organizations that invest in infrastructure to accurately assess investments, plan for climate resilient adaption where needed, and comply with new climate regulations such as the EU Taxonomy.</p>
<h2 class="anchor anchorWithStickyNavbar_LWe7" id="the-engineering-challenge-to-create-climate-models">The engineering challenge to create climate models<a href="https://docs-staging.fused.io/pr/532/blog/streamlining-infrastructure-risk-analysis-with-fused/#the-engineering-challenge-to-create-climate-models" class="hash-link" aria-label="Direct link to The engineering challenge to create climate models" title="Direct link to The engineering challenge to create climate models">​</a></h2>
<p>At VIDA, we derive dozens of risk metrics from CMIP6 and derive possible hazards from their outputs such as from flooding risk, drought, tornados, and many more. We write datasets to either Zarr or Cloud-Optimized GeoTiff so that we can efficiently load the data that we need. One of the best ways to sanity-check our outputs and the data we give our customers is through visualizing it.</p>
<p>Prior to using Fused, much of this visualization was ad-hoc, using tools such as matplotlib or xarray to generate plots locally and then sharing them as image files for each client site. While this does work, it builds a lot of friction into the feedback cycle, and to focus on a single site or area, we'd have to rerun our visualization pipeline.</p>
<h2 class="anchor anchorWithStickyNavbar_LWe7" id="creating-the-udf">Creating the UDF<a href="https://docs-staging.fused.io/pr/532/blog/streamlining-infrastructure-risk-analysis-with-fused/#creating-the-udf" class="hash-link" aria-label="Direct link to Creating the UDF" title="Direct link to Creating the UDF">​</a></h2>
<p>With Fused, we've been able to easily interactively pre-process and visually inspect the Zarrs that we generate as the output from our models. Being able to just share a link to a UDF to view the data in an interactive map has greatly sped up exploring the model outputs, and sanity check the data that we are using.</p>
<div style="width:100%;height:100%" class="video__player"></div>
<h2 class="anchor anchorWithStickyNavbar_LWe7" id="conclusion">Conclusion<a href="https://docs-staging.fused.io/pr/532/blog/streamlining-infrastructure-risk-analysis-with-fused/#conclusion" class="hash-link" aria-label="Direct link to Conclusion" title="Direct link to Conclusion">​</a></h2>
<p>Fused made it a lot easier for me to load, preprocess, and visualize the large datasets I work with and share those across my team. We create a lot of Zarrs which we put on the cloud, so our internal workflow of creating datasets, saving them as Zarrs, and sharing the outputs among the team significantly improved.</p>
<p>We now save engineering hours and maintain more simple workflows because Fused makes it easier to work with data and collaborate compared to sharing static PNGs with colleagues. Fused streamlines our internal workflows by enabling us to create Zarr datasets, upload them to Google Cloud, and efficiently build, run, and share climate models along with their outputs.</p>
<!-- -->
<div style="margin-top:2rem"><div display="block" style="width:100%;height:600px"><iframe src="https://www.fused.io/workbench/apps#app/s/aH4sIAAAAAAAAA3VUjWrbMBB%2BFaHBljLHzk%2FTQcGM0bRj0I3SnzGoglDtSyKQJU2S66QhbzD2CnvFPcJOsZt2ozPEsk7n7%2B777nM2tDAl0GMqK2tcIJUsnLHSMt0FfHAgKiUDER43TDMtGiGfMlOpfRBK9W4Z3Sf350bJumJ0drBH6kJ67kz1BMvbMNmX4495DHHTIIOCHqO%2Ff%2F34SU5XVhkn9YJ8%2FTT98MaTL6ff%2Bh%2Bn04v%2BnfBQkkLJSgQgFVJSjB5EDKZfkStQUGADsbCSPhAzJ6UI%2BE4gSqzBeabbleTklmmCF0NhsBG94CUsHAAvxdozmjyelm7NvQWlngdhhbQq4EsQgVtwBeggFbyQYd3L59hjlCAW9CC80c%2FOIur%2FG7Lu2Qa5%2Fb2rxOqfgGyhZx11ZI5y%2B51Sd2aFkneqtafBEL80Db7SKXbQSnuCY4yKC3RMhRjt8NLPwvbaYsoU2LXR%2Be3kMJ2MjgYJGY7S0WQynCXoIc0fjKnyUULiytFJLuTjhERZfM7oCe5NeUcujJfBRTmY7kpfBVcXoXZAbi7PY4MFupDY%2Bk7JgtxMz5iuneJO%2BLBj19vLGIL1x1nWNE06r9E3qTSZB3cPLrsfZkhIBVlB3y%2BFgzJDJI4%2B49Fn%2FKSS9ohH92Wu1tmuy2zzsM02K%2Fytt%2B%2FLsLbATR26wrnVi9hzLP2WzBl9vZMv3%2ByW7TM6nZJdvxG5VRo%2FmFbTawydx0ivFeeJXUJECA7VOot00PipKEseTK%2FqsC9Blwi6m9L%2BC%2BtVCWlkGZb5eIBTWYJcLEM%2Bic8Iwwujg5AaHG%2BTrl0NCEcT6uB7LaOLdfD0%2BJZmdi2cM83j2h%2B%2BSwfpoF%2FY8XDU3e3alLIEPhqMDvmAN2jA8ShtlgrxHv9J8LFL69darvpxCg9Gg6ezhEp%2FVit1VaDzNT3G0cP2D32W2we8BAAA" height="600px" width="100%" scrolling="no"></iframe></div></div>]]></content>
        <author>
            <name>Jacob Prince-Bieker</name>
            <uri>https://www.linkedin.com/in/jacobbieker/</uri>
        </author>
        <category label="vida" term="vida"/>
        <category label="climate" term="climate"/>
        <category label="risk" term="risk"/>
    </entry>
    <entry>
        <title type="html"><![CDATA[Map Overture Buildings and Foursquare Places with Leafmap]]></title>
        <id>https://docs-staging.fused.io/pr/532/blog/map-overture-buildings-and-foursquare-places-with-leafmap/</id>
        <link href="https://docs-staging.fused.io/pr/532/blog/map-overture-buildings-and-foursquare-places-with-leafmap/"/>
        <updated>2024-12-10T00:00:00.000Z</updated>
        <summary type="html"><![CDATA[TL;DR Dr. Qiusheng walks through how you can call Fused UDFs to load data into leafmap maps using Jupyter Notebooks.]]></summary>
        <content type="html"><![CDATA[<p><strong>TL;DR Dr. Qiusheng walks through how you can call Fused UDFs to load data into leafmap maps using Jupyter Notebooks.</strong></p>
<!-- -->
<div style="height:360px;width:100%" class="video__player"></div>
<br>
<p>Dr. Qiusheng Wu is an Associate Professor of Geography and Sustainability at the <a href="https://faculty.utk.edu/Qiusheng.Wu" target="_blank" rel="noopener noreferrer">University of Tennessee</a> and a Founding Editorial Board Member at the <a href="https://cloudnativegeo.org/" target="_blank" rel="noopener noreferrer">Cloud-Native Geospatial Forum (CNG)</a>. As part of his commitment to making open-source geospatial analysis and visualization more accessible, he has developed several widely used open-source packages, including <a href="https://geemap.org/" target="_blank" rel="noopener noreferrer">geemap</a>, <a href="https://leafmap.org/" target="_blank" rel="noopener noreferrer">leafmap</a>, and <a href="https://samgeo.gishub.org/" target="_blank" rel="noopener noreferrer">segment-geospatial</a>.</p>
<p>In <a href="https://colab.research.google.com/drive/1JUupA0f5xJ_2QMqI6xrsEnLqIGXhB6le?usp=sharing" target="_blank" rel="noopener noreferrer">this Notebook</a> Qiusheng shows a few examples of how Cloud Native Geospatial datasets help you easily load data into a Jupyter Notebook environment using leafmap. His practical examples showcase how you can call the <a href="https://www.fused.io/workbench/catalog/Overture_Maps_Example-64071fb8-2c96-4015-adb9-596c3bac6787" target="_blank" rel="noopener noreferrer">Overture Maps UDF</a> and <a href="https://www.fused.io/workbench/catalog/Foursquare_Open_Source_Places-5cd75ead-e319-4279-8efc-04276de145bc" target="_blank" rel="noopener noreferrer">Foursquare Places UDF</a> to load data into a custom area of interest and render it in a leaflet map.</p>
<br>
<!-- -->
<div class="theme-admonition theme-admonition-info admonition_xJq3 alert alert--info"><div class="admonitionHeading_Gvgb"><span class="admonitionIcon_Rf37"><svg viewBox="0 0 14 16"><path fill-rule="evenodd" d="M7 2.3c3.14 0 5.7 2.56 5.7 5.7s-2.56 5.7-5.7 5.7A5.71 5.71 0 0 1 1.3 8c0-3.14 2.56-5.7 5.7-5.7zM7 1C3.14 1 0 4.14 0 8s3.14 7 7 7 7-3.14 7-7-3.14-7-7-7zm1 3H6v5h2V4zm0 6H6v2h2v-2z"></path></svg></span>info</div><div class="admonitionContent_BuS1"><ul>
<li><a href="https://colab.research.google.com/drive/1Ud1HzNnEuXCBMGJJntM7MZJpKAnpYhns?usp=sharing" target="_blank" rel="noopener noreferrer">Google Colab Notebook Walkthrough</a></li>
<li><a href="https://leafmap.org/notebooks/102_fused/" target="_blank" rel="noopener noreferrer">Leafmap Docs</a></li>
</ul></div></div>
<h2 class="anchor anchorWithStickyNavbar_LWe7" id="calling-fused-udfs-to-load-data">Calling Fused UDFs to load data<a href="https://docs-staging.fused.io/pr/532/blog/map-overture-buildings-and-foursquare-places-with-leafmap/#calling-fused-udfs-to-load-data" class="hash-link" aria-label="Direct link to Calling Fused UDFs to load data" title="Direct link to Calling Fused UDFs to load data">​</a></h2>
<p>You first use leafmap to create a bounding box over an area of interest (AOI) <code>user_aoi</code> and create a GeoDataFrame <code>gdf_aoi</code> with it. Then, you can <a href="https://docs.fused.io/core-concepts/run-udfs/" target="_blank" rel="noopener noreferrer">run</a> the <a href="https://www.fused.io/workbench/catalog/Overture_Maps_Example-64071fb8-2c96-4015-adb9-596c3bac6787" target="_blank" rel="noopener noreferrer">Overture Maps UDF</a>, passing the AOI as a parameter to define the area to fetch data for.</p>
<div style="width:100%;height:100%" class="video__player"></div>
<p>Behind the scenes, the the Overture UDF reads data directly from the Overture Maps dataset hosted in <a href="https://source.coop/repositories/fused/overture/description" target="_blank" rel="noopener noreferrer">Source Cooperative</a>.</p>
<div class="language-python codeBlockContainer_Ckt0 theme-code-block" style="--prism-background-color:hsl(220, 13%, 18%);--prism-color:hsl(220, 14%, 71%)"><div class="codeBlockContent_biex"><pre tabindex="0" class="prism-code language-python codeBlock_bY9V thin-scrollbar" style="background-color:hsl(220, 13%, 18%);color:hsl(220, 14%, 71%);text-shadow:0 1px rgba(0, 0, 0, 0.3)"><code class="codeBlockLines_e6Vv codeBlockLinesWithNumbering_o6Pm"><span class="token-line codeLine_lJS_" style="color:hsl(220, 14%, 71%);text-shadow:0 1px rgba(0, 0, 0, 0.3)"><span class="codeLineNumber_Tfdd"></span><span class="codeLineContent_feaV"><span class="token keyword" style="color:hsl(286, 60%, 67%)">import</span><span class="token plain"> fused</span></span><br></span><span class="token-line codeLine_lJS_" style="color:hsl(220, 14%, 71%);text-shadow:0 1px rgba(0, 0, 0, 0.3)"><span class="codeLineNumber_Tfdd"></span><span class="codeLineContent_feaV"><span class="token plain"></span><span class="token keyword" style="color:hsl(286, 60%, 67%)">import</span><span class="token plain"> geopandas </span><span class="token keyword" style="color:hsl(286, 60%, 67%)">as</span><span class="token plain"> gpd</span></span><br></span><span class="token-line codeLine_lJS_" style="color:hsl(220, 14%, 71%);text-shadow:0 1px rgba(0, 0, 0, 0.3)"><span class="codeLineNumber_Tfdd"></span><span class="codeLineContent_feaV"><span class="token plain"></span><span class="token keyword" style="color:hsl(286, 60%, 67%)">from</span><span class="token plain"> shapely</span><span class="token punctuation" style="color:hsl(220, 14%, 71%)">.</span><span class="token plain">geometry </span><span class="token keyword" style="color:hsl(286, 60%, 67%)">import</span><span class="token plain"> shape</span></span><br></span><span class="token-line codeLine_lJS_" style="color:hsl(220, 14%, 71%);text-shadow:0 1px rgba(0, 0, 0, 0.3)"><span class="codeLineNumber_Tfdd"></span><span class="codeLineContent_feaV"><span class="token plain" style="display:inline-block"></span></span><br></span><span class="token-line codeLine_lJS_" style="color:hsl(220, 14%, 71%);text-shadow:0 1px rgba(0, 0, 0, 0.3)"><span class="codeLineNumber_Tfdd"></span><span class="codeLineContent_feaV"><span class="token plain"></span><span class="token comment" style="color:hsl(220, 10%, 40%)"># Define AOI, which can be done with leafmap drawing tools</span><span class="token plain"></span></span><br></span><span class="token-line codeLine_lJS_" style="color:hsl(220, 14%, 71%);text-shadow:0 1px rgba(0, 0, 0, 0.3)"><span class="codeLineNumber_Tfdd"></span><span class="codeLineContent_feaV"><span class="token plain">user_aoi </span><span class="token operator" style="color:hsl(207, 82%, 66%)">=</span><span class="token plain"> </span><span class="token punctuation" style="color:hsl(220, 14%, 71%)">{</span><span class="token string" style="color:hsl(95, 38%, 62%)">'type'</span><span class="token punctuation" style="color:hsl(220, 14%, 71%)">:</span><span class="token plain"> </span><span class="token string" style="color:hsl(95, 38%, 62%)">'Feature'</span><span class="token punctuation" style="color:hsl(220, 14%, 71%)">,</span><span class="token string" style="color:hsl(95, 38%, 62%)">'properties'</span><span class="token punctuation" style="color:hsl(220, 14%, 71%)">:</span><span class="token plain"> </span><span class="token punctuation" style="color:hsl(220, 14%, 71%)">{</span><span class="token punctuation" style="color:hsl(220, 14%, 71%)">}</span><span class="token punctuation" style="color:hsl(220, 14%, 71%)">,</span><span class="token string" style="color:hsl(95, 38%, 62%)">'geometry'</span><span class="token punctuation" style="color:hsl(220, 14%, 71%)">:</span><span class="token plain"> </span><span class="token punctuation" style="color:hsl(220, 14%, 71%)">{</span><span class="token string" style="color:hsl(95, 38%, 62%)">'type'</span><span class="token punctuation" style="color:hsl(220, 14%, 71%)">:</span><span class="token plain"> </span><span class="token string" style="color:hsl(95, 38%, 62%)">'Polygon'</span><span class="token punctuation" style="color:hsl(220, 14%, 71%)">,</span><span class="token string" style="color:hsl(95, 38%, 62%)">'coordinates'</span><span class="token punctuation" style="color:hsl(220, 14%, 71%)">:</span><span class="token plain"> </span><span class="token punctuation" style="color:hsl(220, 14%, 71%)">[</span><span class="token punctuation" style="color:hsl(220, 14%, 71%)">[</span><span class="token punctuation" style="color:hsl(220, 14%, 71%)">[</span><span class="token operator" style="color:hsl(207, 82%, 66%)">-</span><span class="token number" style="color:hsl(29, 54%, 61%)">74.025621</span><span class="token punctuation" style="color:hsl(220, 14%, 71%)">,</span><span class="token plain"> </span><span class="token number" style="color:hsl(29, 54%, 61%)">40.699967</span><span class="token punctuation" style="color:hsl(220, 14%, 71%)">]</span><span class="token punctuation" style="color:hsl(220, 14%, 71%)">,</span><span class="token punctuation" style="color:hsl(220, 14%, 71%)">[</span><span class="token operator" style="color:hsl(207, 82%, 66%)">-</span><span class="token number" style="color:hsl(29, 54%, 61%)">74.025621</span><span class="token punctuation" style="color:hsl(220, 14%, 71%)">,</span><span class="token plain"> </span><span class="token number" style="color:hsl(29, 54%, 61%)">40.730283</span><span class="token punctuation" style="color:hsl(220, 14%, 71%)">]</span><span class="token punctuation" style="color:hsl(220, 14%, 71%)">,</span><span class="token punctuation" style="color:hsl(220, 14%, 71%)">[</span><span class="token operator" style="color:hsl(207, 82%, 66%)">-</span><span class="token number" style="color:hsl(29, 54%, 61%)">73.966055</span><span class="token punctuation" style="color:hsl(220, 14%, 71%)">,</span><span class="token plain"> </span><span class="token number" style="color:hsl(29, 54%, 61%)">40.730283</span><span class="token punctuation" style="color:hsl(220, 14%, 71%)">]</span><span class="token punctuation" style="color:hsl(220, 14%, 71%)">,</span><span class="token punctuation" style="color:hsl(220, 14%, 71%)">[</span><span class="token operator" style="color:hsl(207, 82%, 66%)">-</span><span class="token number" style="color:hsl(29, 54%, 61%)">73.966055</span><span class="token punctuation" style="color:hsl(220, 14%, 71%)">,</span><span class="token plain"> </span><span class="token number" style="color:hsl(29, 54%, 61%)">40.699967</span><span class="token punctuation" style="color:hsl(220, 14%, 71%)">]</span><span class="token punctuation" style="color:hsl(220, 14%, 71%)">,</span><span class="token punctuation" style="color:hsl(220, 14%, 71%)">[</span><span class="token operator" style="color:hsl(207, 82%, 66%)">-</span><span class="token number" style="color:hsl(29, 54%, 61%)">74.025621</span><span class="token punctuation" style="color:hsl(220, 14%, 71%)">,</span><span class="token plain"> </span><span class="token number" style="color:hsl(29, 54%, 61%)">40.699967</span><span class="token punctuation" style="color:hsl(220, 14%, 71%)">]</span><span class="token punctuation" style="color:hsl(220, 14%, 71%)">]</span><span class="token punctuation" style="color:hsl(220, 14%, 71%)">]</span><span class="token punctuation" style="color:hsl(220, 14%, 71%)">}</span><span class="token punctuation" style="color:hsl(220, 14%, 71%)">}</span><span class="token plain"></span></span><br></span><span class="token-line codeLine_lJS_" style="color:hsl(220, 14%, 71%);text-shadow:0 1px rgba(0, 0, 0, 0.3)"><span class="codeLineNumber_Tfdd"></span><span class="codeLineContent_feaV"><span class="token plain" style="display:inline-block"></span></span><br></span><span class="token-line codeLine_lJS_" style="color:hsl(220, 14%, 71%);text-shadow:0 1px rgba(0, 0, 0, 0.3)"><span class="codeLineNumber_Tfdd"></span><span class="codeLineContent_feaV"><span class="token plain"></span><span class="token comment" style="color:hsl(220, 10%, 40%)"># Convert drawing to GeoDataFrame</span><span class="token plain"></span></span><br></span><span class="token-line codeLine_lJS_" style="color:hsl(220, 14%, 71%);text-shadow:0 1px rgba(0, 0, 0, 0.3)"><span class="codeLineNumber_Tfdd"></span><span class="codeLineContent_feaV"><span class="token plain">gdf_aoi </span><span class="token operator" style="color:hsl(207, 82%, 66%)">=</span><span class="token plain"> gpd</span><span class="token punctuation" style="color:hsl(220, 14%, 71%)">.</span><span class="token plain">GeoDataFrame</span><span class="token punctuation" style="color:hsl(220, 14%, 71%)">(</span><span class="token punctuation" style="color:hsl(220, 14%, 71%)">[</span><span class="token plain">user_aoi</span><span class="token punctuation" style="color:hsl(220, 14%, 71%)">[</span><span class="token string" style="color:hsl(95, 38%, 62%)">'properties'</span><span class="token punctuation" style="color:hsl(220, 14%, 71%)">]</span><span class="token punctuation" style="color:hsl(220, 14%, 71%)">]</span><span class="token punctuation" style="color:hsl(220, 14%, 71%)">,</span><span class="token plain"> geometry</span><span class="token operator" style="color:hsl(207, 82%, 66%)">=</span><span class="token punctuation" style="color:hsl(220, 14%, 71%)">[</span><span class="token plain">shape</span><span class="token punctuation" style="color:hsl(220, 14%, 71%)">(</span><span class="token plain">user_aoi</span><span class="token punctuation" style="color:hsl(220, 14%, 71%)">[</span><span class="token string" style="color:hsl(95, 38%, 62%)">'geometry'</span><span class="token punctuation" style="color:hsl(220, 14%, 71%)">]</span><span class="token punctuation" style="color:hsl(220, 14%, 71%)">)</span><span class="token punctuation" style="color:hsl(220, 14%, 71%)">]</span><span class="token punctuation" style="color:hsl(220, 14%, 71%)">)</span><span class="token plain"></span></span><br></span><span class="token-line codeLine_lJS_" style="color:hsl(220, 14%, 71%);text-shadow:0 1px rgba(0, 0, 0, 0.3)"><span class="codeLineNumber_Tfdd"></span><span class="codeLineContent_feaV"><span class="token plain" style="display:inline-block"></span></span><br></span><span class="token-line codeLine_lJS_" style="color:hsl(220, 14%, 71%);text-shadow:0 1px rgba(0, 0, 0, 0.3)"><span class="codeLineNumber_Tfdd"></span><span class="codeLineContent_feaV"><span class="token plain"></span><span class="token comment" style="color:hsl(220, 10%, 40%)"># Fetch Overture Bulidings GDF with Fused UDF</span><span class="token plain"></span></span><br></span><span class="token-line codeLine_lJS_" style="color:hsl(220, 14%, 71%);text-shadow:0 1px rgba(0, 0, 0, 0.3)"><span class="codeLineNumber_Tfdd"></span><span class="codeLineContent_feaV"><span class="token plain">gdf </span><span class="token operator" style="color:hsl(207, 82%, 66%)">=</span><span class="token plain"> fused</span><span class="token punctuation" style="color:hsl(220, 14%, 71%)">.</span><span class="token plain">run</span><span class="token punctuation" style="color:hsl(220, 14%, 71%)">(</span><span class="token string" style="color:hsl(95, 38%, 62%)">"UDF_Overture_Maps_Example"</span><span class="token punctuation" style="color:hsl(220, 14%, 71%)">,</span><span class="token plain"> bbox</span><span class="token operator" style="color:hsl(207, 82%, 66%)">=</span><span class="token plain">aoi</span><span class="token punctuation" style="color:hsl(220, 14%, 71%)">)</span></span><br></span></code></pre><div class="buttonGroup__atx"><button type="button" aria-label="Copy code to clipboard" title="Copy" class="clean-btn"><span class="copyButtonIcons_eSgA" aria-hidden="true"><svg viewBox="0 0 24 24" class="copyButtonIcon_y97N"><path fill="currentColor" d="M19,21H8V7H19M19,5H8A2,2 0 0,0 6,7V21A2,2 0 0,0 8,23H19A2,2 0 0,0 21,21V7A2,2 0 0,0 19,5M16,1H4A2,2 0 0,0 2,3V17H4V3H16V1Z"></path></svg><svg viewBox="0 0 24 24" class="copyButtonSuccessIcon_LjdS"><path fill="currentColor" d="M21,7L9,19L3.5,13.5L4.91,12.09L9,16.17L19.59,5.59L21,7Z"></path></svg></span></button></div></div></div>
<br>]]></content>
        <author>
            <name>Qiusheng Wu</name>
            <uri>https://www.linkedin.com/in/giswqs/</uri>
        </author>
        <author>
            <name>Plinio Guzman</name>
            <uri>https://www.linkedin.com/in/plinioguzman/</uri>
        </author>
        <category label="qiusheng" term="qiusheng"/>
        <category label="leafmap" term="leafmap"/>
        <category label="foursquare" term="foursquare"/>
        <category label="overture" term="overture"/>
    </entry>
    <entry>
        <title type="html"><![CDATA[From query to map: Exploring GeoParquet Overture Maps with Ibis, DuckDB, and Fused]]></title>
        <id>https://docs-staging.fused.io/pr/532/blog/from-query-to-map-exploring-geoparquet-overture-maps-with-ibis-duckdb-and-fused/</id>
        <link href="https://docs-staging.fused.io/pr/532/blog/from-query-to-map-exploring-geoparquet-overture-maps-with-ibis-duckdb-and-fused/"/>
        <updated>2024-12-06T00:00:00.000Z</updated>
        <summary type="html"><![CDATA[TL;DR Naty shares a UDF to use Ibis with DuckDB's spatial extension to query and explore Overture Maps data.]]></summary>
        <content type="html"><![CDATA[<p><strong>TL;DR Naty shares a UDF to use Ibis with DuckDB's spatial extension to query and explore Overture Maps data.</strong></p>
<p>Naty is a Senior Software Engineer and a contributor to Ibis, the portable Python dataframe library. One of her main contributions was enabling the DuckDB spatial extension for Ibis in 2023.</p>
<p>In this blog post, she shows us how to leverage the spatial extension in DuckDB with Ibis to query Overture data. Ibis works by compiling Python expressions into SQL, you write Python dataframe-like code, and Ibis takes care of the SQL. Thanks to Ibis integration with <a href="https://pandas.pydata.org/" target="_blank" rel="noopener noreferrer">Pandas</a> and <a href="https://geopandas.org/en/stable/" target="_blank" rel="noopener noreferrer">GeoPandas</a>, you only need to do <code>to_pandas()</code> to get your expression as a GeoDataFrame.</p>
<!-- -->
<div style="width:100%;height:100%" class="video__player"></div>
<br>
<!-- -->
<div class="theme-admonition theme-admonition-info admonition_xJq3 alert alert--info"><div class="admonitionHeading_Gvgb"><span class="admonitionIcon_Rf37"><svg viewBox="0 0 14 16"><path fill-rule="evenodd" d="M7 2.3c3.14 0 5.7 2.56 5.7 5.7s-2.56 5.7-5.7 5.7A5.71 5.71 0 0 1 1.3 8c0-3.14 2.56-5.7 5.7-5.7zM7 1C3.14 1 0 4.14 0 8s3.14 7 7 7 7-3.14 7-7-3.14-7-7-7zm1 3H6v5h2V4zm0 6H6v2h2v-2z"></path></svg></span>info</div><div class="admonitionContent_BuS1"><p>Find Naty's UDF code here:</p><ul>
<li><a href="https://www.fused.io/workbench/catalog/Ibis_DuckDB_Overturemaps-ca8e306b-a05a-4d48-ab40-537edd2586dc" target="_blank" rel="noopener noreferrer">IBIS DuckDB Overture UDF</a></li>
</ul></div></div>
<h3 class="anchor anchorWithStickyNavbar_LWe7" id="motivations">Motivations<a href="https://docs-staging.fused.io/pr/532/blog/from-query-to-map-exploring-geoparquet-overture-maps-with-ibis-duckdb-and-fused/#motivations" class="hash-link" aria-label="Direct link to Motivations" title="Direct link to Motivations">​</a></h3>
<p>Overture Maps is emerging as a global backbone for linked spatial data. The Overture Maps Foundation, founded in 2022, is an open data initiative aiming to introduce the foundation for next-generation map services and applications. Overture offers reliable, easy-to-use, and interoperable open map data. Its structured schema enables consistent data access and seamless integration with other spatial data using unique identifiers.</p>
<p>Overture Maps has multiple datasets you can explore and query. Check their <a href="https://docs.overturemaps.org/getting-data/fused/" target="_blank" rel="noopener noreferrer">documentation</a> to find out more about them. In this blog, we will explore the <a href="https://docs.overturemaps.org/guides/base/" target="_blank" rel="noopener noreferrer">base theme</a> and some of its <a href="https://docs.overturemaps.org/schema/reference/base/infrastructure/" target="_blank" rel="noopener noreferrer">infrastructure features</a>.</p>
<p>Have you ever been on a walk as a tourist and wondered where you could get public drinking water or a bench to sit, or maybe you need to make a restroom stop, but you don't know where to find any of these?</p>
<p>We will find out how you can easily get this information from Overture data and visualize it, using Ibis and Fused. You'll be able to insert an address and see this key information.</p>
<h2 class="anchor anchorWithStickyNavbar_LWe7" id="getting-the-data">Getting the data<a href="https://docs-staging.fused.io/pr/532/blog/from-query-to-map-exploring-geoparquet-overture-maps-with-ibis-duckdb-and-fused/#getting-the-data" class="hash-link" aria-label="Direct link to Getting the data" title="Direct link to Getting the data">​</a></h2>
<p>Overture distributes its datasets as GeoParquet, an optimized cloud-native format that enables you to easily get chunks of data from the official S3 bucket where the Overture dataset is published. The release of DuckDB 1.1.1 marked a significant milestone by adding support for GeoParquet files. This update enables users to query rich geospatial datasets like Overture Maps. Thanks to the support for DuckDB geospatial operations in Ibis, we can query the datasets from Overture Maps using Python with the performance of DuckDB without having to write SQL. Together, these tools offer an accessible and powerful solution for unlocking insights from global geospatial data.</p>
<h3 class="anchor anchorWithStickyNavbar_LWe7" id="exploring-overture-maps">Exploring Overture Maps<a href="https://docs-staging.fused.io/pr/532/blog/from-query-to-map-exploring-geoparquet-overture-maps-with-ibis-duckdb-and-fused/#exploring-overture-maps" class="hash-link" aria-label="Direct link to Exploring Overture Maps" title="Direct link to Exploring Overture Maps">​</a></h3>
<p>Using Ibis with DuckDB as the backend, we can access the Overture Maps data directly from the cloud. These queries will only fetch the attributes and rows that meet specified conditions, minimizing how much data is processed locally. You can learn more about it in this DuckDB <a href="https://duckdb.org/2021/06/25/querying-parquet.html" target="_blank" rel="noopener noreferrer">blog</a>.</p>
<h3 class="anchor anchorWithStickyNavbar_LWe7" id="creating-a-custom-udf">Creating a custom UDF<a href="https://docs-staging.fused.io/pr/532/blog/from-query-to-map-exploring-geoparquet-overture-maps-with-ibis-duckdb-and-fused/#creating-a-custom-udf" class="hash-link" aria-label="Direct link to Creating a custom UDF" title="Direct link to Creating a custom UDF">​</a></h3>
<p>I created a UDF to read an Overture maps GeoParquet file stored on S3 and filter it based on a given bounding box and column values using Ibis. You can access and run it <a href="https://www.fused.io/workbench/catalog/Ibis_DuckDB_Overturemaps-ca8e306b-a05a-4d48-ab40-537edd2586dc" target="_blank" rel="noopener noreferrer">here</a>.</p>
<!-- -->
<div style="text-align:center"><img src="https://docs-staging.fused.io/pr/532/assets/images/ibis_udf-2ce6d4aa7b50cabaa0b1fdf393ae730e.png" alt="File"></div>
<!-- -->
<p>We first establish a connection to a DuckDB database, in this particular case we have an in-memory connection. Then, we do <code>read_parquet</code> and we receive a table expression. Since our result, <code>t</code>, is a table expression, we can now run queries against the file using Ibis expressions. In this example, to start, we filter by some infrastructure subtypes (pedestrian, and water), select only a few columns, and limit our “search” to a bounding box <code>bbox</code>. Notice that this <code>bbox</code> is the Fused bounding box, not the overture maps one.</p>
<p>We then rename the column <code>class</code> to avoid conflicts with the <a href="https://ibis-project.org/reference/expression-generic#ibis.expr.api.deferred" target="_blank" rel="noopener noreferrer">deferred operator</a>, and finally filter the expression by specific infrastructure classes like toilets, ATMs, drinking water, and other useful information. Up to this point, we only have a table expression, Ibis has a deferred execution model. It builds up expressions based on what you ask it to do and then executes those expressions on request.</p>
<p>To show an example of an aggregate, we executed and printed the <code>value_counts()</code> as a Pandas DataFrame. Ibis can execute the table against the DuckDB backend, and return it as a Pandas DataFrame or a GeoPandas GeoDataFrame (if <code>geometry</code> column is present), by only doing <code>to_pandas()</code>.</p>
<h3 class="anchor anchorWithStickyNavbar_LWe7" id="conclusion">Conclusion<a href="https://docs-staging.fused.io/pr/532/blog/from-query-to-map-exploring-geoparquet-overture-maps-with-ibis-duckdb-and-fused/#conclusion" class="hash-link" aria-label="Direct link to Conclusion" title="Direct link to Conclusion">​</a></h3>
<p>The synergy between Ibis, DuckDB, and Fused has redefined the ease of querying and visualizing geospatial data. These frameworks provide an intuitive and powerful toolkit, enabling users to express geospatial queries, perform efficient transformations, and access high-performance analytics with minimal setup.</p>
<p>By leveraging this stack, interacting with vast geospatial datasets like Overture Maps becomes straightforward, efficient, and accessible.</p>
<h3 class="anchor anchorWithStickyNavbar_LWe7" id="resources">Resources<a href="https://docs-staging.fused.io/pr/532/blog/from-query-to-map-exploring-geoparquet-overture-maps-with-ibis-duckdb-and-fused/#resources" class="hash-link" aria-label="Direct link to Resources" title="Direct link to Resources">​</a></h3>
<p>If you want to learn more about Ibis geospatial capabilities, check some of the geospatial blog posts <a href="https://ibis-project.org/posts#category=geospatial" target="_blank" rel="noopener noreferrer">here</a>.</p>
<p>You might also find these resources useful as you dive into Ibis, DuckDB, and Overture:</p>
<ul>
<li><a href="https://github.com/OvertureMaps/data" target="_blank" rel="noopener noreferrer">Overture Maps Data Repo</a></li>
<li><a href="https://ibis-project.org/" target="_blank" rel="noopener noreferrer">Ibis Docs</a></li>
<li><a href="https://duckdb.org/docs/extensions/spatial.html" target="_blank" rel="noopener noreferrer">DuckDB spatial extension</a></li>
<li><a href="https://github.com/DuckDB/DuckDB_spatial/blob/main/docs/functions.md" target="_blank" rel="noopener noreferrer">DuckDB spatial functions docs</a></li>
<li><a href="https://ibis-project.org/posts/ibis-overturemaps/" target="_blank" rel="noopener noreferrer">Ibis Zulip Chat</a></li>
</ul>]]></content>
        <author>
            <name>Naty Clementi</name>
            <uri>https://www.linkedin.com/in/ncclementi/</uri>
        </author>
        <category label="ibis" term="ibis"/>
    </entry>
    <entry>
        <title type="html"><![CDATA[Creating an app to model road mobility networks in Lima, Peru]]></title>
        <id>https://docs-staging.fused.io/pr/532/blog/creating-an-app-to-model-road-mobility-networks-in-lima-peru/</id>
        <link href="https://docs-staging.fused.io/pr/532/blog/creating-an-app-to-model-road-mobility-networks-in-lima-peru/"/>
        <updated>2024-12-05T00:00:00.000Z</updated>
        <summary type="html"><![CDATA[TL;DR Claudio used Fused to create an app to model road mobility networks in Lima, Peru, using GeoPandas, and OSMnx.]]></summary>
        <content type="html"><![CDATA[<p><strong>TL;DR Claudio used Fused to create an app to model road mobility networks in Lima, Peru, using GeoPandas, and OSMnx.</strong></p>
<p>On December 2023, I visited the <a href="https://portal.imp.gob.pe/" target="_blank" rel="noopener noreferrer">Institute for Metropolitan Planning</a> (IMP) in Lima. The director had invited me to share some of my geospatial analysis projects from my master's studies and explore potential collaborations. Around that time, Lima's mayor had announced a bold infrastructure initiative: building 60 flyover bridges to ease traffic congestion in one of the most gridlocked cities in Latin America.</p>
<!-- -->
<div style="height:360px;width:100%" class="video__player"></div>
<br>
<p>When I asked how the city was simulating the impact of new network designs on urban mobility, the answer was: "We are not simulating anything, our budget is constrained, and there is no political will to solve this problem." I couldn't think of anything else after this meeting. I started thinking about how I could create an easy-to-use tool to simulate urban mobility using open-source data, tools with no subscriptions or licenses, and without data privacy concerns.</p>
<p>My first attempt with FastAPI and React came to an unfortunate halt. Fused allowed me to revisit the idea and easily create an API endpoint and lightweight app I could easily share with anyone.</p>
<!-- -->
<div class="theme-admonition theme-admonition-info admonition_xJq3 alert alert--info"><div class="admonitionHeading_Gvgb"><span class="admonitionIcon_Rf37"><svg viewBox="0 0 14 16"><path fill-rule="evenodd" d="M7 2.3c3.14 0 5.7 2.56 5.7 5.7s-2.56 5.7-5.7 5.7A5.71 5.71 0 0 1 1.3 8c0-3.14 2.56-5.7 5.7-5.7zM7 1C3.14 1 0 4.14 0 8s3.14 7 7 7 7-3.14 7-7-3.14-7-7-7zm1 3H6v5h2V4zm0 6H6v2h2v-2z"></path></svg></span>info</div><div class="admonitionContent_BuS1"><p>Find Claudio's UDF code and App associated with the blog post here:</p><ul>
<li><a href="https://www.fused.io/workbench/catalog/Simple_Trips_Gen_Lima-bee0d668-9c1a-4c56-8657-2119e3c01edf" target="_blank" rel="noopener noreferrer">Simple Trips Generation UDF</a></li>
<li><a href="https://www.fused.io/workbench/apps#app/s/i/fa_4IuAi7YDQtqb8Nn2Zw1gHs" target="_blank" rel="noopener noreferrer">Trip Simulation App</a>.</li>
</ul></div></div>
<h2 class="anchor anchorWithStickyNavbar_LWe7" id="challenges-building-with-fastapi--react">Challenges Building With FastAPI &amp; React<a href="https://docs-staging.fused.io/pr/532/blog/creating-an-app-to-model-road-mobility-networks-in-lima-peru/#challenges-building-with-fastapi--react" class="hash-link" aria-label="Direct link to Challenges Building With FastAPI &amp; React" title="Direct link to Challenges Building With FastAPI &amp; React">​</a></h2>
<p>I took on IMP's challenge and, with references like Eclipse's <a href="https://eclipse.dev/sumo/" target="_blank" rel="noopener noreferrer">Simulation of Urban MObility</a> (SUMO) app as my guide, I rolled up my sleeves and started building a simulation tool. The synergy between GeoPandas and <a href="https://osmnx.readthedocs.io/en/stable/" target="_blank" rel="noopener noreferrer">OSMnx</a> allowed me to create a simple trip simulation based on real-world data and mobility behavior assumptions within days.</p>
<p>However, building the simulation was one thing. I also wanted to share the results interactively in a user-friendly format.</p>
<p>Before learning about Fused, I had set up a backend server with FastAPI and hosted a single generate_trips endpoint that would return GeoJSON data. The problem arose when trying to visualize the output. Downloading GeoJSON files and manually uploading them into tools like <a href="https://kepler.gl/" target="_blank" rel="noopener noreferrer">Kepler.gl</a> was time-consuming and clunky. To address this I built a React application with <a href="https://deck.gl/" target="_blank" rel="noopener noreferrer">Deck.gl</a>, leveraging its TripsLayer to fetch and display streaming data from my API. It worked beautifully on localhost, but deployment costs were a blocker as neither I, as a student, nor the IMP had the budget to host the app. After two months of effort, I ended up with a half-finished tool that I couldn't effectively share. It was time to move on. Or so I thought…</p>
<h2 class="anchor anchorWithStickyNavbar_LWe7" id="how-a-fused-udf-simplified-everything">How a Fused UDF Simplified Everything<a href="https://docs-staging.fused.io/pr/532/blog/creating-an-app-to-model-road-mobility-networks-in-lima-peru/#how-a-fused-udf-simplified-everything" class="hash-link" aria-label="Direct link to How a Fused UDF Simplified Everything" title="Direct link to How a Fused UDF Simplified Everything">​</a></h2>
<p>With Fused, all I had to do was write a Python function and my parallelized streaming service was ready to integrate with a Streamlit application via the App Builder. Here's how I redesigned the workflow as a <a href="https://docs-staging.fused.io/pr/532/core-concepts/write/">User Defined Function</a> (UDF) using lessons from my previous project:</p>
<div style="width:100%;height:100%" class="video__player"></div>
<br>
<ol>
<li>Extracting the Road Network: Using OSMnx, I extracted road networks within a defined Area of Interest (AOI).</li>
<li>Enriching Data: Each road segment was assigned speed and travel time values.</li>
<li>Defining Population Data: A 1km² grid with population density and zoning data was loaded into a GeoPandas GeoDataFrame.</li>
<li>Setting Simulation Parameters:<!-- -->
<ul>
<li>Population size: Derived from density data.</li>
<li>Trips per person: Assumed at 2 trips/day (commute to and from work).</li>
<li>Origins and Destinations: Residential zones were assigned as homes and commercial zones as workplaces.</li>
<li>Trip Schedules: Normal probability distributions were used for departure (6-8 AM) and return times (5-7 PM).</li>
</ul>
</li>
</ol>
<!-- -->
<div style="text-align:center"><img src="https://docs-staging.fused.io/pr/532/assets/images/udf_lima-d179bffbd65a1723187b70beb3795534.png" alt="File"></div>
<p>With these parameters, the simulation sampled "home" and "work" nodes, calculated start times, and determined the shortest paths between origins and destinations. <a href="https://docs-staging.fused.io/pr/532/core-concepts/async/">Async UDF calls</a> made the process parallelized and efficient. The final output was a GeoDataFrame with:</p>
<ul>
<li>Start Time (Unix timestamp)</li>
<li>Trip Type ("home" or "work")</li>
<li>Path (list of coordinates)</li>
<li>Timestamps (for each coordinate)</li>
</ul>
<h2 class="anchor anchorWithStickyNavbar_LWe7" id="future-plans">Future Plans<a href="https://docs-staging.fused.io/pr/532/blog/creating-an-app-to-model-road-mobility-networks-in-lima-peru/#future-plans" class="hash-link" aria-label="Direct link to Future Plans" title="Direct link to Future Plans">​</a></h2>
<p>This project is far from over. Here are the features I aim to add to make it a valuable tool for urban planners, especially in resource-constrained settings like Lima:</p>
<ol>
<li>Larger AOI Support: Handle bigger datasets and simulate more trips.</li>
<li>Multimodal Routing: Incorporate walking, biking, driving, and public transit options, akin to OSRM profiles.</li>
<li>Custom Infrastructure: Allow users to model new transit infrastructure within the OSM road network.</li>
<li>Mobility Metrics: Provide detailed metrics (e.g., travel times, congestion levels) for each simulation.</li>
</ol>
<p>With these enhancements, this tool could empower city stakeholders to make data-driven decisions on critical urban interventions—whether it's building flyovers or optimizing public transit routes. The ultimate goal? Improving mobility for over 11 million residents in Lima and beyond.</p>
<!-- -->
<div style="margin-top:2rem"><div display="block" style="width:100%;height:600px"><iframe src="https://www.fused.io/workbench/apps#app/s/aH4sIAAAAAAAAA%2B1a%2FXLbNhJ%2FFVQ5j6hUpCjZThzFyjWJ4yYdu%2Bmd3WYay6NCJCjCIgkWAC07rp%2BjM%2FfPveI9wi3AT1GU7GR8vZlO4UQSgd3F7uK3iwXJm5bDXNIatmgYMy5RSB3OYhqPo6xDSE5wGFCJsICL1X7LYdATkUgK67KvqMqOcTSO8ALTUq5FIyFxEBhn49aMsBhHLhbjVheNW14iiDtunXfGkcdZiFwsiaQhQdmM%2BXUXqU%2BXBBIr%2Bdloyg3Xj9AplQFBHuNI%2BgThGIwR0pKq1xi3%2FvPvf%2F2OTjmN0QkNkwBLyqIhmhywRSThPzqiIZ6MW51U1gHxaES0INAb5mEekszF1%2BNIf6FRoZcVsYXRUXMB3UT1VgYNTW1dE8y7qQArZJH08wv4n814ElCXgOoMCRIQB%2Fyu7UVuwmk0yydPJ%2FFZwmESsE4A0xRzS2huYxwhaOPWSS6iv2uGNEpAJyVMBEyC01Mq6J9c4iAho1LzfAhfrQyhr0v%2FG0oBMRrsdJBZ6U1nEqP%2BbicTdA8hezktLFyI5Wjcevt2GIaFmkKSeLRujsx3h5pVr5Y2U3kxxkJ%2FH6YAIZFbuq3w4dfN2lf9PAHELzFZ0OHptR23tn42t0Jzy0Vbb4dbx8OtEw2gfK6MNb%2B8m1Ejj4o4AICVxihEOyzyqDISUKthnS98iPncBfxmS%2B%2BNW48fn2ZLPXz8GN00Kd7Ws7Y7t8pBN6v6FePjVubjmeuBJTrYLJ7AbK0fDw4nEElxQCYqqsTkWxJNVBCpqC4nHZU%2Fu4UnRvkPLZt6gNgYS3%2FcQjRCMBXkliAJIzFMjYKes5ziHNRYurawkNcxMUB5LS1KwinhE%2BZNAohgAeQBiQxgSe0g7EKwKBViSTZRV4Ye8mUYTMDPEjKYshVsV3%2FR%2FlcH71%2Bf%2FvzDG6QoXkBH8U2w%2ByJVcT8kEiPHx1wQheFEeubeuJWP6iT04oAEPkXHRHKGjnG830u7MxpQd458Tjxg96WMxbDXwzGFFY6n7Eql217605wF5oXoXW5bTy277LMcARkVcRKAAPBJQIRPiCyVEA6sE2Rw7nzpDBcwwYv9Xipoo9gkiuczLfEbmXCvpz6%2BeaK%2FLAi0NZKU0tmFalPmXqObG0hHfEYhWdvPIapdF9Kh%2Fn17W5I%2BAiUVacwETTM7ngoAkSTPAeOxpp8yKVmofy6oK%2F0h6tv21rKcdLsASWWXag1ilwn0HAM7vqr1B8STjQNT7MxnnCWRO0R8NsWG3UXZP2uvUyMurO7vrgpiHDK%2FybFLEzFEeysEEEuMD9HCpytae4B208MhDa6HqP2SUxy0IXhxJExBOPVq5J9MGrnkCtRY0eHKFD6GPATehT9lb2rVYHe3i8oP2xpUbcs9D0DIln6%2FlwXVvlr8HBguvUTUBXjBKmvcQEd1zAkg2cOwXrwC8HrYHyAtWzPnMAKSR7oWAIfd1BLGLagwyIVXJ1rCqmppXEBYYMchQpyyOVGJpR3PLXL9Xf%2FdBaPTD4HAH3bnzuBZgk%2FeiXfhG%2FqefncxPfjnhTP4eIVPZ4vjD7v%2B8farX6dhMMfbPy3Ih5%2Fm7yLbenls%2F%2BOTN%2F32048fHXvn8uMTNkjwov1c5apybWEvUIrAvBFZlCpBejHqIFa5DYOJAIY2ELa7y8PaTekQyIAYTnNIFv49FzYa87Lfr7M5kC6VyDPz6VOrD%2Fg1%2BwPLHjwZ7O4Mzmu0n5iKv36%2F1h1T6UA07uzW%2BqdQNWnYm%2F2n1pMqbDpLXgANLYiQ12AfZ4Gx5Ijv8SWd6W0zH%2B50Glyog0RtFnWntReMz9vglkeHhza0uvltn4VEj9u2omhX1VyayEsiR%2BmBHKigJfmB0Ui%2Bj45gQQwFvC5yKeyVkUM6K0pwAokzQjp74oBFM0P%2FVGwnUrlIS%2BhURNSCbNlXsOO1A4ZdiHWjg0YvVubr9dBL19UlSKh3q3QrFbBjO2SZNPP9iR4y2prc1OQgvS5XNbVZg7uyjbjuTtWgUMQQlxnF7TJBfe0r6kLB7FNnDkV0mVy15rqCmhIJOEWXVNAphfPLdaMdR%2FgayugmvdvUVctcMdAsp2kyo60sVSyKuJEg9WdNaiNlDHErgbBJMU2gWE0NYo1FT7cmUSW13gOBuh51y1RwVHPAWUAHuXuV8PZ%2By%2FMKCzhIMTik6AV5CNeLZp%2F%2B35x%2B1kykCaFud%2Fx1q6HaGcSDhIBpf48hm9TTZrVZlvV%2BegGHOwvyLqdEGGnq6lgenGlVJdvEtU7iMhK2742EvS9GwvtEReEsYIvipP4wiFAi%2F0LEAyPiyUaqaZDwz4LNzhfDRuV3F8OBJsvo7JJwdUpWGFLFsdpYcaCyewJfVJUkRN21qor5ElSpOf9C1QOjanBvwGzGn1oczDlWtGeDLto5%2FzJ8pSWgB1VZwvUdg6L2sPLO%2BsEp67YAf2%2Bw4xtG1tOFc8pVY01VThRzps4LqvKDucCvcIKjEZSEoqvB%2Fc69UuV8EgRrBZXCqHuSeB5VHDnvV6OUG%2F0d%2FWL%2B7eYm67%2B9%2FQUBGtvPN4krS0oQWC8yK5rWT6irUo5INJN%2BIUVfGaWwuwW8VngD%2FhR3Z5mDLfBeTLgERFpQekkyUZF4jn77TZfoqrVXFjhvkEhe6%2BIbDvQQc40Fbd6WC9tfNIPyJlWe1N%2Bp48GtzYVu3opUsaHkLWhV7Qu0q0eEJZTYa8KvCdwV24%2FgAAxZUe%2B%2BG41enyILRXWqzLyi5JmBEr7OQRsEFXlys4vv4V%2BHcidoTMYF6V2ptiBMZWV3VVTKsjeIrXLkabpA8D35qlmvv64krzNlG3B%2FPXU9%2FZX9G5FyTMDu8H8DlFDL%2FtMipf9HImVd6VXnyYBiW7sPDpXXjGfp9CGR4oDUPy1Edj4TIcXG9tkIeeDMUNzCwhGFWpMY%2BgGVxGG8es%2Bq2tJN3U24vhEHe%2FqebdtrCoCSHnb6GdRYqiArJ0JbhZwO6hW%2F7xSW3xkDYYXcx5VCZa3NFX10zTC6a3NuugdXbyoooBK%2FT3HRsQSRB1AWGJpq%2FeKoxsmvCfjppV4ecMshhzrfyFZrnULLNwirLV9mu4m1dnszb9RDeTEMJjJ1%2BLm2VFShEdSl7eMkkPSoKAPb64GzIqTi5bLuTm%2BdZiXuxnpZtUrpXeNc65tm0xEJxOpjoqZpNpnRLPt%2BB%2BJEMlPdT9dvDPhskb6roJ%2F7Z4dkQ9TKxBTGU3XDUtQfGBxFsyMsX%2Bkxo67XynEn61jn7j8WA%2FqGwB0Lr2gKBi1EcaSusMiVJJGbdnceFgn3MuCz9WnGSLVHJRiP5uuZyu3qB6T5o8Rdu8ZWXlWey%2B73sudw%2B73sqXf%2BWFy%2FhVB7%2ByAf00LqT3MtyEtxjGqOKu%2Bhm9mDykc2Vn9VzSpCHCHM%2Fh7Zlv6zuqjMNDN73ruB391%2B1p%2FPNvL3OQlXRZQPKlNTsw05iQT2yAQHUN9OlJ9Gpzwh%2BfsplRel1JhRfdGgi3xCZ74cwY4IxK1uS6VwCpMr%2BtbwrNWLrzHnbJF%2Fq2dhtmWbTrzdH2Sf8TVzqUsmA3uwM7EnCyzC7YG18AOQl7%2BBBT8zMjOJ6JWpdtRPoJZonXdbVBwmQXACOxuJWkMJyt%2F%2BF9f17YMiJgAA" height="600px" width="100%" scrolling="no"></iframe></div></div>]]></content>
        <author>
            <name>Claudio Ortega</name>
            <uri>https://www.linkedin.com/in/claudioortega27/</uri>
        </author>
        <category label="osmnx" term="osmnx"/>
        <category label="urban" term="urban"/>
        <category label="mobility" term="mobility"/>
        <category label="network" term="network"/>
    </entry>
    <entry>
        <title type="html"><![CDATA[Beyond RGB: Interactive Exploration of NEON's Hyperspectral Data]]></title>
        <id>https://docs-staging.fused.io/pr/532/blog/beyond-rgb-interactive-exploration-of-neons-hyperspectral-data/</id>
        <link href="https://docs-staging.fused.io/pr/532/blog/beyond-rgb-interactive-exploration-of-neons-hyperspectral-data/"/>
        <updated>2024-12-03T00:00:00.000Z</updated>
        <summary type="html"><![CDATA[TL;DR Guillermo used Fused to build an interactive tool for exploring NEON hyperspectral data, making large-scale geospatial analysis more accessible and actionable for researchers.]]></summary>
        <content type="html"><![CDATA[<p><strong>TL;DR Guillermo used Fused to build an interactive tool for exploring NEON hyperspectral data, making large-scale geospatial analysis more accessible and actionable for researchers.</strong></p>
<!-- -->
<div style="height:360px;width:100%" class="video__player"></div>
<br>
<p>As a research specialist focused on remote sensing applications in semi-arid rangelands, I'm constantly seeking tools that can enhance our ability to process and analyze large-scale geospatial data. The excitement of discovering new platforms that streamline complex workflows never gets old, especially when dealing with the massive datasets typical in remote sensing research.</p>
<p>My journey with Fused began unexpectedly through the "Minds Behind Maps" podcast, where host Maxime Lenormand interviewed Sina Kashuk, Co-Founder and CEO of Fused (see <a href="https://www.mindsbehindmaps.com/episode/the-ex-uber-data-scientist-who-wants-to-simplify-data-science-with-serverless-computing-sina-kashuk" target="_blank" rel="noopener noreferrer">episode</a>). The conversation sparked my curiosity, leading me to explore Fused's community <a href="https://github.com/fusedio/udfs/tree/main" target="_blank" rel="noopener noreferrer">examples</a> and <a href="https://docs-staging.fused.io/pr/532/">documentation</a>. After joining their <a href="https://docs.google.com/forms/d/e/1FAIpQLSf9X-Tg-hDRW2ngMtewP--ZLjZx3gcVfEcfg2NdY3B_v2nnUQ/viewform" target="_blank" rel="noopener noreferrer">waitlist</a> and receiving access, I knew exactly how I wanted to test it: an interactive tool for exploring NEON's <a href="https://www.neonscience.org/data-collection/airborne-remote-sensing" target="_blank" rel="noopener noreferrer">Airborne Observation Platform</a> (AOP) data.</p>
<!-- -->
<div class="theme-admonition theme-admonition-info admonition_xJq3 alert alert--info"><div class="admonitionHeading_Gvgb"><span class="admonitionIcon_Rf37"><svg viewBox="0 0 14 16"><path fill-rule="evenodd" d="M7 2.3c3.14 0 5.7 2.56 5.7 5.7s-2.56 5.7-5.7 5.7A5.71 5.71 0 0 1 1.3 8c0-3.14 2.56-5.7 5.7-5.7zM7 1C3.14 1 0 4.14 0 8s3.14 7 7 7 7-3.14 7-7-3.14-7-7-7zm1 3H6v5h2V4zm0 6H6v2h2v-2z"></path></svg></span>info</div><div class="admonitionContent_BuS1"><p>Find Guillermo's UDF code and App associated with the blog post here:</p><ul>
<li><a href="https://www.fused.io/workbench/catalog/NEON_Hyperspectral_GEE-cae9acdb-4c1f-4653-b574-b0d4973a092a" target="_blank" rel="noopener noreferrer">NEON Hyperspectral GEE UDF</a></li>
<li><a href="https://bit.ly/neon_fused" target="_blank" rel="noopener noreferrer">NEON Dataset Explorer App</a></li>
</ul></div></div>
<h2 class="anchor anchorWithStickyNavbar_LWe7" id="making-hyperspectral-data-accessible">Making Hyperspectral Data Accessible<a href="https://docs-staging.fused.io/pr/532/blog/beyond-rgb-interactive-exploration-of-neons-hyperspectral-data/#making-hyperspectral-data-accessible" class="hash-link" aria-label="Direct link to Making Hyperspectral Data Accessible" title="Direct link to Making Hyperspectral Data Accessible">​</a></h2>
<p>For those unfamiliar with NEON AOP, it's an NSF-funded initiative revolutionizing ecological observation. Using advanced imaging spectrometers, NEON collects hyperspectral data across 426 distinct wavelength bands at 1-meter resolution. Imagine having 426 different perspectives of the same landscape, each revealing unique insights about vegetation, soil composition, and ecosystem health.</p>
<!-- -->
<div style="text-align:center"><img src="https://docs-staging.fused.io/pr/532/assets/images/drone-9d8ec752a131d59ec3eabeffafe8f1db.png" alt="File"></div>
<p><em>Source: <a href="https://www.neonscience.org/data-collection/imaging-spectrometer" target="_blank" rel="noopener noreferrer">NEON Imaging Spectrometer</a>.</em></p>
<p>The real challenge, however, isn't collecting this rich data - it's making it accessible and actionable for researchers. This is where Fused enters the picture. Diving into their documentation and <a href="https://demo.fused.io/" target="_blank" rel="noopener noreferrer">gallery</a> of click-and-run examples, I found myself inspired by the platform's potential. By combining elements from various examples, I began building my first <a href="https://docs-staging.fused.io/pr/532/core-concepts/write/">User Defined Function</a> (UDF), eventually discovering the <a href="https://docs-staging.fused.io/pr/532/workbench/app-builder/app-overview/">App Builder</a> - a feature that would prove crucial in creating an interactive interface for hyperspectral data exploration. Having worked extensively with Google Earth Engine (GEE) and NEON data, the recent <a href="https://www.neonscience.org/impact/observatory-blog/neon-remote-sensing-data-available-google-earth-engine" target="_blank" rel="noopener noreferrer">announcement</a> of NEON AOP's availability through GEE presented the perfect opportunity to test Fused's capabilities. My goal was simple yet powerful: create a user-friendly application that could tap into this wealth of hyperspectral data and make it instantly accessible to researchers.</p>
<h2 class="anchor anchorWithStickyNavbar_LWe7" id="building-the-fused-app">Building the Fused App<a href="https://docs-staging.fused.io/pr/532/blog/beyond-rgb-interactive-exploration-of-neons-hyperspectral-data/#building-the-fused-app" class="hash-link" aria-label="Direct link to Building the Fused App" title="Direct link to Building the Fused App">​</a></h2>
<p>The resulting application streamlines what traditionally would be a complex data acquisition process into a few simple clicks. Users can select any NEON site and survey year from a dynamically populated list - a feature that automatically stays current with GEE's data catalog, as NEON sites are surveyed at different frequencies. Once a site is selected, users can click anywhere within the highlighted area to instantly view all 426 bands of spectral data in an interactive plot.</p>
<!-- -->
<div style="margin-top:2rem"><div display="block" style="width:100%;height:600px"><iframe src="https://www.fused.io/workbench/apps#app/s/aH4sIAAAAAAAAA81a65bbthF%2BFYR7eiy1unttp%2FJqz7Edr%2BNcnLRKL8lqDw9EQhIc3gpAK2n37Bu0fYU8Ql8tj9AZALxT1Dp%2FWspekcTMYDiY%2BWYw1L3jxT5zpg4Pk1goEnJPxAlPFtEiojvK8zsDHklFg6BzvXCkEoyGAVf9VRzwbbhwemThrLaS%2BeY0CWIVHMy53NCE4cVNdxHZaT7KOMIp7KWVkl1qQemVkTVYC5ps3Hj5kXlKEirJOs5IMn3wvlSLaCXikNiJB2sWh0yJA7HUy3ifUqR8rtGAZPLcVKVFdEbmDLSga0a8OFrxNagryI77TJCAHuItzBr5xKfiZ6I2LGQLMNRAMuUij2t4OoZytnCQEQ3DI644DVwJ10sqXDCuYjDuxUFAE23Jrpn%2BzVYqUPbNfE5UTHxGA5hdbaxh9JeeMgQN%2FHgXdRYRgWPh6A%2BcX0h1CNglngIRj8gl8fktuYeH8n0eradkIlj4kjxoCqm%2B14LfbCiY4t4IIzntGGnTu0vq%2FbwW8Tbyp0Ssl7Qz6ulPN6eIBViqL6jPt3JKRoNnKX86XZ%2BFseJx1Peot2H98eE8%2BTyhj5%2B5DyaLxZScjd6Ox%2BMXrbKfc18eJEng4VOuq1f4SZ8%2BYHQVMNUHd1si0VZIpPLZim4DRT4zHkIj1cSwBDU%2FiYlHignqKX7LPokPnErBQjLRKyvQq%2BvTa5ytcDehESO%2Fz83dokVm2Yth7lLGz3qGfRtJumIu4ES8czcqDGY%2FiC2DQevL743X8ztGJJMSVoZoxy97NsS%2FIBJOvQ1a1MQqByoMtAOjQg4g9lcwNSgrWKRcHF04JIoVBBbR8aelm7CaGuWqtwdFbjIjH%2BKIVeTiZL9dLnKX5QYUsMULuPczBvinyi1yN%2BvrU0V%2Fu77IncnF5XoHyIfGkbnliZ4i0nddc2dmEHsgtjn2rOTGffb1i%2Fm7eCz%2BLsY%2FfP3TX5V%2Fq25fLxH8zAxdQgDdwFfIX764Qg9I4mQboDfM08X%2BES0YcAmQ70MaQngjIYu20moAc4OzKuZ3CgpdF88XDoA%2FRaVddUjASW7IbIZpCWngCghuabDFgYGKcapOt5s%2FvYVp436dV69f%2F9jVFtBJIB0MYo8q7cs88hhmgdRqgmntYblgOWiQbOiSKe4Bj4ZFWL0sDSiW2r%2FZmpOPO%2FHV27vRuxfh99sRC%2BmK%2Fum5QmuCyWYj%2BIrW%2BIWSII%2BgqjiIVphNRpNxFoM%2FxXEIWIAGR02rD5HrBIkTEzVoVNPy2hgQSdBwHJivRzfaGbnUlQIYolMR1MOE27VOWJ8EvwZBTH1ZZdSKLxHrtbPp1Dx4x%2BKvYKxGC%2FleuYa4080fJlujGbk2GnQMEegN%2F8gfiL0c42WXDMmkV6Mbl%2BnGGd0NaghxpbgKWGfh%2FPrLP%2F9FPrz97gP5EpxOyASqFgFGnvN1RNUW3OLtHhK3ABfANF%2FK3s7FUlzi0jWDqTYGJK9xD1PYBCNADeBsG0aycz3pkfMbu9DlKJqzAJTQC6xBFkXkgFCY%2FuzMsuYcqKMm1HeYnyKmRhK8BTVVJ00g6LCG1VhgrrHZOKZEb12ywL0FN1lyKL0O5ZrHCNEPoL1kVZnzs1k7jE9zLU7BfUlwzmbi3iAbBnlKRspk2v1TaCkH7Qnw0wFamrybi6W3lIOFApZhq8W3nASP6%2FKlCSjVQZ5ufQgfQ%2BcizAlFva%2FLV8ewUquisbIm2iy3RdD6cI6p5bGb%2FLLbsmJ1a1TupH6SL5xeXL0m6PnbxMd8EtKksnJHoDZ%2FpFbILRMj%2FlZhBtCiSgXwXKMaV6nqzlEh0HhesUJ5sjaDpqBtIfcknqeCyrjeKraE8o9VpID9raRtz9ZYHR2lbqx5CtQAzeAVGRDVIbICqilE6nKs6qVOSzWmpacLbivGI7hqPNNi64%2B6NK26z4kIqnluGxY3%2B1QRkrW6bZCMBKdcoVItl4TXWAvLcka%2BpQl5A1t4k9XCvDaAAWu2NNJqoWcf7g6KIdRDqNk4TfiKB0yCKTZKJXI6HMJu5JaJARXemoMPBrDxgoQbDl8J7937%2BVAwqTQN95gc%2Fi0Wge%2B%2BD2HvLw5DUGSuuYcodHh%2F9zC8P8D%2F%2FUNmXqqUgMneSsH1Pftsr3yTcUy5QbF9scrRT1daGyqRuRYxPZJHs%2B60OGk46rsBPTBRr6MeiRq9Ih3sAd3VNtIRMAtouPQp2U%2FzvWTqsiseBG9wv71wpnB5Nhq9fnp1VfNe7X2niXaMrzcKqSa1MZzpu4R64MxIMBoUSR7seXdAfd9VcSe0fh0OVjwrGit2acejUrVZWDoEC7AyrBLU2II9gb0AQYAiKUAVyu2GjWEDXOh81gp6dpEhHZGGkCxSXuOEYEGL8JCaHsMRrTOOLM7wKQuucw1i9U6kmJBwW5fMVgvnG6rAOYBkOjhfPfTIN9jVuQdqfV1aaRXHgeIJBMachkmAbYDMYkU67oHnWW3ew3lHexCwCdOL1OPgVyKWckM5YnGPJIKt%2BB5ur2Cz3G1yClzGL7hMIFZM8ZCWzJOjJfP7Qi8Hwj6vmWudOeOpaXdOHxfYkNPxNKuUUfU%2Bl%2B2zjV%2F8sTd59qw3GozzbpthMS23gK3A3OfJHkrIgPvEBlSZNmuumcZcucemD1B%2BzaP%2BMlYqDqcNBLUO36REsnAuS%2BS%2F%2FvLv%2F5A36FW62YMbUdiFbiCkAwxrCA3YNVPcnd5ytjOb6XT7JLPtE%2Fj4Id4WqvMkhgI4t%2BcQDGrmLfWn8Djao9JeYAGBJmllkDWDO2EP275qM8NioUc2GoZmk2cj6zBfQoQGzEQ4YbeQ06SO7kwYRnB6gcDRqcZ9itMR25mbMH%2FKcF0lvklrkzPyXRQc0loXSzWl8QakWGWg%2Fl%2BB71v0yQqVkj8%2BrjWVc4DMXM2mGqAk0Bi3bXdWKd8y2TmLAbZsoAJimkIDWYnCgla5fmndGTbibEtBY%2FYdm9I%2B3zTJilSQqVv2G2YJPmHPYe0xQ7xtGIG9BvxvGDH7i7bnb2DSe45Wk1SYukWDGxvNVSxMa0yHArpWqQGMe1TBwDyPrBZtdIJZ22vEFMXxNQmJMU7AAXaMQPjZVcoDoa2gKndYLUy0uop5TqkjyTY8p1nJ15RvS1NoQp11dHvH9vs7lRCq5KAjzaZMXzya%2FL%2BhimicpN5ZWDgXiU1cT9I3Ks%2F18fLJ5Tc2Y0OSby8unoAbP7mxVcFJ2mhtaS%2BGyWVjZLRCfKOT4nu9GVnHgyu%2BBosV%2BxUwZEoDyO6sYgNgmMMzqlIRlB77GYwABu3oLWSpaK02AEVN4WXpoCrBZIZb7GbCMPaxPsANiGx87oiGSPDnoqAmeAABM597KquW8mLbprhJt4EPi2sgVvEdE%2FGhUTSSZCVYvVCp8RTsXF2PgUlornl1WrGvYlAVmjem5j2oiy9ga%2BITCgHhLtcVlcw7yjo1SHo0sU3%2F56NRZcAUTMa%2BwWwy6hGh%2F6rZU%2Fi7hPOqbfd0z6VhaEDsTbxbC%2B43uTAeOGbWbHxkNFvkp%2FpoXDfduAaa1wBpxwmgEoqUUVTyOzYbn%2FdIKn230X3eJr9RELk55wmG6vXh%2F8c4p%2BLqf2aj6pSTk1Oi4QK2ZpE%2Fu6KBrNpuE98yYeFmD3DKV7zeEWqMVo2SstMgrhCyF8tLdLSL4fJySn53v3%2FAVx5ws2DgdOwwHUwA6dkeBF9eDM13cY9UUgRSh4UDD3%2B%2B0AHFevg62c0yqGvcIXuTknJihQLJSsI6yGMp9uSLmWY2%2FUJlG4bYxClM4pQYqJKueauTnVfe7UxK%2BvpsRTz9yxDs3wvudXQzr0d0L76h%2F9qexUu70fQ4vitNj4ZfYYzf4udlI3nzTznKEo%2F%2BXqR2GKDNtq6jOlV175k9WJI9VqVoyYW%2B1FHVx4DCKT7XajiX99rMpvR4pGi77z4iemye0Nwyra0pWCHw9Wx6NU0INM1Y2OeWn7uy502PTy%2BMbAmaumfFr8oeuHC%2BZTQiZZgkTcXNIARC3TBrlUb3jxNG9yVZZZ0np3Tmj1SZR7bFV0eFk8jg9EDcP7Yclhr7As702hkmBypEvEu%2F%2B%2BMXg9Fg1PeSp%2BOJ%2FZscYp%2F7zJ2MJufuyN1RGT6dDHabAOSlv8yDU0vWB6De9xUP2R3sNyTUkA6XV9sgmHuCsciZKlDm4b%2BzKUmS9CcAAA%3D%3D" height="600px" width="100%" scrolling="no"></iframe></div></div>
<br>
<p>Under the hood, each click triggers a carefully crafted UDF that connects to GEE's data catalog, extracts the hyperspectral values for that specific location, and transforms them into a clear, interactive visualization. What makes this particularly exciting is how Fused handles all the infrastructure complexity, letting me focus solely on the analytical workflow and user experience.</p>
<h2 class="anchor anchorWithStickyNavbar_LWe7" id="looking-ahead">Looking Ahead<a href="https://docs-staging.fused.io/pr/532/blog/beyond-rgb-interactive-exploration-of-neons-hyperspectral-data/#looking-ahead" class="hash-link" aria-label="Direct link to Looking Ahead" title="Direct link to Looking Ahead">​</a></h2>
<p>Looking ahead, I'm already planning the next phase of this app. I just want to add functionality that tracks sampling locations and allows users to export their collected data as CSV files, complete with all 426 bands and additional metadata. This will enable data users to easily build training datasets for Machine Learning applications, develop new spectral indices, or conduct detailed statistical analyses.</p>
<p>The experience of building this demo app has reinforced my belief in the importance of platforms like Fused in the geospatial community. They serve as crucial bridges between massive datasets and practical applications, eliminating infrastructure headaches and letting researchers focus on what matters most - the science.</p>
<p>For those interested in exploring NEON's hyperspectral data or learning more about this application, feel free to connect with me or try the app for yourself <a href="https://bit.ly/neon_fused" target="_blank" rel="noopener noreferrer">here</a>.</p>
<p>The future of remote sensing analysis lies in making powerful data more accessible, and I'm excited to be working in this field.</p>]]></content>
        <author>
            <name>Guillermo Ponce</name>
            <uri>https://www.linkedin.com/in/geponce/</uri>
        </author>
        <category label="neon" term="neon"/>
        <category label="hyperspectral" term="hyperspectral"/>
        <category label="gee" term="gee"/>
    </entry>
    <entry>
        <title type="html"><![CDATA[How DigitalTwinSim Models Wireless Networks with DuckDB, Ibis, and Fused]]></title>
        <id>https://docs-staging.fused.io/pr/532/blog/how-digitaltwinsim-models-wireless-networks-with-duckdb-ibis-and-fused/</id>
        <link href="https://docs-staging.fused.io/pr/532/blog/how-digitaltwinsim-models-wireless-networks-with-duckdb-ibis-and-fused/"/>
        <updated>2024-11-26T00:00:00.000Z</updated>
        <summary type="html"><![CDATA[TL;DR DigitalTwinSim uses Fused with Ibis and DuckDB to model high-resolution wireless networks.]]></summary>
        <content type="html"><![CDATA[<p><strong>TL;DR DigitalTwinSim uses Fused with Ibis and DuckDB to model high-resolution wireless networks.</strong></p>
<p>Sameer, co-founder of DigitalTwinSim, leads the development of advanced geospatial analysis tools to support the telecom industry in strategic network planning. <a href="http://www.digitaltwinsim.com/" target="_blank" rel="noopener noreferrer">DigitalTwinSim</a> specializes in using high-resolution data to optimize the placement of network towers ensuring reliable, high-speed connectivity.</p>
<p>In this blog post, Sameer shares how he leverages <a href="https://ibis-project.org/" target="_blank" rel="noopener noreferrer">Ibis</a> with a <a href="https://duckdb.org/" target="_blank" rel="noopener noreferrer">DuckDB</a> backend, and <a href="https://www.fused.io/" target="_blank" rel="noopener noreferrer">Fused</a> to model wireless networks at high resolution. This approach enables him to quickly generate network coverage models for his clients. He explains and shares a Fused UDF that processes data in an H3 grid to evaluate optimal locations for network towers.</p>
<!-- -->
<div style="width:100%;height:100%" class="video__player"></div>
<!-- -->
<br>
<div class="theme-admonition theme-admonition-info admonition_xJq3 alert alert--info"><div class="admonitionHeading_Gvgb"><span class="admonitionIcon_Rf37"><svg viewBox="0 0 14 16"><path fill-rule="evenodd" d="M7 2.3c3.14 0 5.7 2.56 5.7 5.7s-2.56 5.7-5.7 5.7A5.71 5.71 0 0 1 1.3 8c0-3.14 2.56-5.7 5.7-5.7zM7 1C3.14 1 0 4.14 0 8s3.14 7 7 7 7-3.14 7-7-3.14-7-7-7zm1 3H6v5h2V4zm0 6H6v2h2v-2z"></path></svg></span>info</div><div class="admonitionContent_BuS1"><p>Check out Sameer's UDF on Workbench here:</p><ul>
<li><a href="https://www.fused.io/workbench/catalog/Coverage_model_ibis-a5d96749-bda3-41b6-a549-95ea4fada856" target="_blank" rel="noopener noreferrer">Coverage Model Ibis UDF</a>.</li>
</ul></div></div>
<h3 class="anchor anchorWithStickyNavbar_LWe7" id="introduction">Introduction<a href="https://docs-staging.fused.io/pr/532/blog/how-digitaltwinsim-models-wireless-networks-with-duckdb-ibis-and-fused/#introduction" class="hash-link" aria-label="Direct link to Introduction" title="Direct link to Introduction">​</a></h3>
<p><a href="https://broadbandusa.ntia.doc.gov/funding-programs/broadband-equity-access-and-deployment-bead-program" target="_blank" rel="noopener noreferrer">Broadband Equity Access and Deployment Program</a> provides funding to expand high-speed internet access by funding planning, infrastructure deployment and adoption programs across US. BEAD prioritizes <strong>unserved</strong> and <strong>underserved</strong> locations, with a mandate to guarantee <strong>100/20 Mbps</strong> service.</p>
<p>Terrestrial fixed wireless technology, utilizing a hybrid of licensed and unlicensed spectrum, is one of the approved technologies for regions where fiber deployment is cost-prohibitive. The <a href="https://www.taranawireless.com/product/#g1-platform" target="_blank" rel="noopener noreferrer">Tarana Wireless G1 Platform</a> exemplifies an FWA technology that meets program requirements at a significantly lower cost than fiber.</p>
<p>Since BEAD <strong>requires 100/20Mbps</strong> service with <strong>coverage guarantees</strong>, it is critical to model networks accurately to ensure compliance with program standards. We use 7.5 cm resolution data from the <a href="https://vexceldata.com/" target="_blank" rel="noopener noreferrer">Vexcel Data Program</a> to model networks and help our clients meet these requirements.</p>
<p>Modeling networks across large, sparsely populated geographies targeting every building generates massive datasets. Traditional tools like QGIS struggled with interactive filtering of such large datasets. In contrast, Fused allows us to filter, visualize, and share data interactively with clients.</p>
<h2 class="anchor anchorWithStickyNavbar_LWe7" id="modeling-methodology">Modeling Methodology<a href="https://docs-staging.fused.io/pr/532/blog/how-digitaltwinsim-models-wireless-networks-with-duckdb-ibis-and-fused/#modeling-methodology" class="hash-link" aria-label="Direct link to Modeling Methodology" title="Direct link to Modeling Methodology">​</a></h2>
<p>We model wireless networks using an H3 grid at resolution 15, which translates to approximately 0.895m² per cell. This results in about 111 Million H3 cells per 10 km² city area.</p>
<p>Identifying the optimal serving site for each H3 index requires processing 11 million groups, each containing 5-10 rows. Previously, this was done with Pandas and Dask, facing limitations in CPU and memory capacity.</p>
<p>Integrating DuckDB into our workflow has significantly eased these constraints, enabling complex group_by operations on large datasets effortlessly. For example, the following command operates on a parquet folder with hundreds of files representing candidate site locations, helping us identify the best serving site for each H3 cell.</p>
<div class="language-python codeBlockContainer_Ckt0 theme-code-block" style="--prism-background-color:hsl(220, 13%, 18%);--prism-color:hsl(220, 14%, 71%)"><div class="codeBlockContent_biex"><pre tabindex="0" class="prism-code language-python codeBlock_bY9V thin-scrollbar" style="background-color:hsl(220, 13%, 18%);color:hsl(220, 14%, 71%);text-shadow:0 1px rgba(0, 0, 0, 0.3)"><code class="codeBlockLines_e6Vv"><span class="token-line" style="color:hsl(220, 14%, 71%);text-shadow:0 1px rgba(0, 0, 0, 0.3)"><span class="token plain">ibis</span><span class="token punctuation" style="color:hsl(220, 14%, 71%)">.</span><span class="token plain">read_parquet</span><span class="token punctuation" style="color:hsl(220, 14%, 71%)">(</span><span class="token string" style="color:hsl(95, 38%, 62%)">'parquet_folder'</span><span class="token punctuation" style="color:hsl(220, 14%, 71%)">)</span><span class="token punctuation" style="color:hsl(220, 14%, 71%)">.</span><span class="token plain">agg</span><span class="token punctuation" style="color:hsl(220, 14%, 71%)">(</span><span class="token plain">by</span><span class="token operator" style="color:hsl(207, 82%, 66%)">=</span><span class="token punctuation" style="color:hsl(220, 14%, 71%)">[</span><span class="token string" style="color:hsl(95, 38%, 62%)">'h15'</span><span class="token punctuation" style="color:hsl(220, 14%, 71%)">]</span><span class="token punctuation" style="color:hsl(220, 14%, 71%)">,</span><span class="token plain"> Rx_dBm</span><span class="token operator" style="color:hsl(207, 82%, 66%)">=</span><span class="token plain">_</span><span class="token punctuation" style="color:hsl(220, 14%, 71%)">.</span><span class="token plain">Rx</span><span class="token punctuation" style="color:hsl(220, 14%, 71%)">.</span><span class="token plain">dBm</span><span class="token punctuation" style="color:hsl(220, 14%, 71%)">.</span><span class="token builtin" style="color:hsl(95, 38%, 62%)">max</span><span class="token punctuation" style="color:hsl(220, 14%, 71%)">(</span><span class="token punctuation" style="color:hsl(220, 14%, 71%)">)</span><span class="token punctuation" style="color:hsl(220, 14%, 71%)">)</span><br></span></code></pre><div class="buttonGroup__atx"><button type="button" aria-label="Copy code to clipboard" title="Copy" class="clean-btn"><span class="copyButtonIcons_eSgA" aria-hidden="true"><svg viewBox="0 0 24 24" class="copyButtonIcon_y97N"><path fill="currentColor" d="M19,21H8V7H19M19,5H8A2,2 0 0,0 6,7V21A2,2 0 0,0 8,23H19A2,2 0 0,0 21,21V7A2,2 0 0,0 19,5M16,1H4A2,2 0 0,0 2,3V17H4V3H16V1Z"></path></svg><svg viewBox="0 0 24 24" class="copyButtonSuccessIcon_LjdS"><path fill="currentColor" d="M21,7L9,19L3.5,13.5L4.91,12.09L9,16.17L19.59,5.59L21,7Z"></path></svg></span></button></div></div></div>
<p>This efficiency is maintained regardless of dataset size or available memory.</p>
<p>Laurens Kuiper's blog post <a href="https://duckdb.org/2024/03/29/external-aggregation" target="_blank" rel="noopener noreferrer">"No Memory? No Problem. External Aggregation in DuckDB"</a>, explains DuckDB's approach to scaling up grouped aggregations—an approach that directly supports our work in high-resolution wireless network modeling. By utilizing Fused with DuckDB, we at DigitalTwinSim have harnessed its capabilities to efficiently manage extensive data aggregations, enabling us to scale up projects in both resolution and candidate site counts.</p>
<h1>Easy Integrations</h1>
<p>Traditionally, we've used QGIS with GeoParquet as our file storage for visualizations. However, the sheer amount of data generated from each site at H3 resolution 15 has made it difficult to filter outputs interactively in QGIS. Fortunately, Fused <a href="https://docs-staging.fused.io/pr/532/core-concepts/run-udfs/run-small-udfs/#http-requests">HTTP endpoints</a> make it easy to dynamically <a href="https://docs-staging.fused.io/pr/532/user-guide/out/qgis/">integrate UDFs with QGIS</a>.</p>
<p>This image shows the output of the UDF for five network nodes rendered in QGIS.</p>
<!-- -->
<div style="text-align:center"><img src="https://docs-staging.fused.io/pr/532/assets/images/QGIS_5_site-17e710aa3b3c30360c0eaf02d9182f30.jpeg" alt="File"></div>
<h1>Fused for Interactive Processing With Instant Visualization</h1>
<p>Here, tools like Fused have become essential. Fused allows us to filter and visualize raw output data in a more interactive way, which we can also share with clients to illustrate network design and coverage areas.</p>
<p>To set up the UDF in Fused, we uploaded our data as a Hive-partitioned Parquet folder and created a UDF in Ibis to generate visualizations on demand based on zoom level and area of interest. At higher zoom levels, we compute the parent H3 index and aggregate data to show broader coverage areas; at lower zoom levels, we display individual H3 indices. The H3 polygons are generated and colored dynamically based on the data in the Parquet folder, allowing us to interactively filter data and share visualizations with clients.</p>
<p>Click <a href="https://www.fused.io/workbench/catalog/Coverage_model_ibis-a5d96749-bda3-41b6-a549-95ea4fada856" target="_blank" rel="noopener noreferrer">here</a> to launch the UDF in Fused Workbench.</p>
<!-- -->
<div style="text-align:center"><img src="https://docs-staging.fused.io/pr/532/assets/images/sameer1-f87934477ed2a433bba80099196f8d8a.png" alt="File"></div>
<h1>Conclusion</h1>
<p>As network demands grow and requirements for high-speed internet access become more stringent, accurate, high-resolution modeling is essential for effective planning and deployment.</p>
<p>DigitalTwinSim's integration of tools like DuckDB and Fused, alongside Ibis and H3 grids, enables us to tackle the challenges of processing, analyzing, and visualizing massive datasets. By leveraging DuckDB's powerful data aggregation capabilities, we can manage and analyze high-resolution data efficiently, irrespective of memory constraints. Meanwhile, Fused empowers us to deliver interactive, client-ready visualizations, allowing stakeholders to better understand network coverage and performance.</p>]]></content>
        <author>
            <name>Sameer Lalwani</name>
            <uri>https://www.linkedin.com/in/lalwanisameer/</uri>
        </author>
        <category label="digitaltwinsim" term="digitaltwinsim"/>
    </entry>
    <entry>
        <title type="html"><![CDATA[The Fastest Way to Download Foursquare's new POI Dataset]]></title>
        <id>https://docs-staging.fused.io/pr/532/blog/fused-public-udf-for-foursquare-pois/</id>
        <link href="https://docs-staging.fused.io/pr/532/blog/fused-public-udf-for-foursquare-pois/"/>
        <updated>2024-11-21T00:00:00.000Z</updated>
        <summary type="html"><![CDATA[TL;DR The Fused Team made Foursquare's open dataset of 100M global places accessible via GeoParquet files which you can access via a UDF.]]></summary>
        <content type="html"><![CDATA[<p><strong>TL;DR The Fused Team made Foursquare's open dataset of 100M global places accessible via GeoParquet files which you can access via a UDF.</strong></p>
<p>Foursquare just released an <a href="https://opensource.foursquare.com/os-places/" target="_blank" rel="noopener noreferrer">open dataset</a> of over 100M global places of interest.</p>
<p>We at Fused have partitioned these points into easily accessible GeoParquet files, and hosted them on <a href="https://source.coop/repositories/fused/fsq-os-places/description" target="_blank" rel="noopener noreferrer">Source Cooperative</a></p>
<p>On top of that, we've build a <a href="https://www.fused.io/public/UDF_Foursquare_Open_Source_Places" target="_blank" rel="noopener noreferrer">publicly available User Defined Function (UDF)</a> that anyone can use to easily look at &amp; download to GeoJSON, all from the browser</p>
<div style="width:100%;height:30vh" class="video__player"></div>
<p><br>
<a href="https://www.fused.io/public/UDF_Foursquare_Open_Source_Places" target="_blank" rel="noopener noreferrer"><strong>Try it out for yourself!</strong></a></p>
<p>You don't need to login or create an account to easily access the Foursquare POI points</p>
<ul>
<li><a href="https://docs.google.com/forms/d/1NVzMjc2tXxlIgnFrxqQPM_NtG1B2AQ0En_pAbZHYSK0" target="_blank" rel="noopener noreferrer">Join our waitlist</a> to get full access to UDFs that you can edit in your browser</li>
<li>Get familiar with Fused by checkout out our <a href="https://docs-staging.fused.io/pr/532/quickstart/">Quickstart docs</a></li>
<li>Follow us on <a href="https://www.linkedin.com/company/fusedio/" target="_blank" rel="noopener noreferrer">LinkedIn</a> to keep up with updates</li>
<li>Read this more <a href="https://tech.marksblogg.com/foursquare-open-global-poi-dataset.html" target="_blank" rel="noopener noreferrer">in-depth look</a> at the whole dataset from our community member <a href="https://tech.marksblogg.com/" target="_blank" rel="noopener noreferrer">Mark Litwintschik</a></li>
</ul>]]></content>
        <author>
            <name>Max Lenormand</name>
            <uri>https://www.linkedin.com/in/maxime-lenormand-b94640107/</uri>
        </author>
        <author>
            <name>Sina Kashuk</name>
            <uri>https://www.linkedin.com/in/skashuk/</uri>
        </author>
        <category label="foursquare" term="foursquare"/>
        <category label="poi" term="poi"/>
    </entry>
    <entry>
        <title type="html"><![CDATA[How I Got Started Making Maps with Python and SQL]]></title>
        <id>https://docs-staging.fused.io/pr/532/blog/how-i-got-started-making-maps-with-python-and-sql/</id>
        <link href="https://docs-staging.fused.io/pr/532/blog/how-i-got-started-making-maps-with-python-and-sql/"/>
        <updated>2024-11-04T00:00:00.000Z</updated>
        <summary type="html"><![CDATA[TL;DR Stephen Kent shares his journey making maps with Fused using Python and SQL.]]></summary>
        <content type="html"><![CDATA[<p><strong>TL;DR Stephen Kent shares his journey making maps with Fused using Python and SQL.</strong></p>
<p>I am a self taught developer and data enthusiast. I first came across the spatial data community when I saw a <a href="https://www.linkedin.com/in/mbforr/" target="_blank" rel="noopener noreferrer">Matt Forrest</a> video on LinkedIn where he demonstrated how to visualize buildings from the <a href="https://beta.source.coop/repositories/vida/google-microsoft-open-buildings/description/" target="_blank" rel="noopener noreferrer">Vida Combined Building Footprints</a> dataset with DuckDB. Immediately I thought, what if you could see all the buildings in a country, say, Egypt? I set out to do just that and made this map with DuckDB and Datashader.</p>
<!-- -->
<div style="height:360px;width:100%" class="video__player"></div>
<br>
<!-- -->
<!-- -->
<div style="text-align:center"><img src="https://docs-staging.fused.io/pr/532/assets/images/kent1-57facc76d29ca75a9f0613c8b41713de.png" alt="File"></div>
<p><em>Buildings in Egypt.</em></p>
<div class="theme-admonition theme-admonition-info admonition_xJq3 alert alert--info"><div class="admonitionHeading_Gvgb"><span class="admonitionIcon_Rf37"><svg viewBox="0 0 14 16"><path fill-rule="evenodd" d="M7 2.3c3.14 0 5.7 2.56 5.7 5.7s-2.56 5.7-5.7 5.7A5.71 5.71 0 0 1 1.3 8c0-3.14 2.56-5.7 5.7-5.7zM7 1C3.14 1 0 4.14 0 8s3.14 7 7 7 7-3.14 7-7-3.14-7-7-7zm1 3H6v5h2V4zm0 6H6v2h2v-2z"></path></svg></span>info</div><div class="admonitionContent_BuS1"><p>Find Stephen's UDF code here:</p><ul>
<li><a href="https://www.fused.io/workbench/catalog/Five_Minutes_Away_in_Bushwick_Brooklyn-95da9a11-176f-49dd-af80-63c7bd4065cf" target="_blank" rel="noopener noreferrer">Five Minutes Away in Bushwick Brooklyn UDF</a></li>
</ul></div></div>
<h2 class="anchor anchorWithStickyNavbar_LWe7" id="starting-with-fused">Starting with Fused<a href="https://docs-staging.fused.io/pr/532/blog/how-i-got-started-making-maps-with-python-and-sql/#starting-with-fused" class="hash-link" aria-label="Direct link to Starting with Fused" title="Direct link to Starting with Fused">​</a></h2>
<p>The day after I posted that image on LinkedIn, in April, 2024, I had a call with <a href="https://www.linkedin.com/in/plinioguzman/" target="_blank" rel="noopener noreferrer">Plinio Guzman</a> of Fused. I told him what I had been up to, and he was enthusiastic and confident that Fused would fit my needs. One key feature he mentioned was the live development. While I was developing that Egypt map, I had to start the ETL to the final product over and over until I got it looking the way I wanted.</p>
<p>So I got started right away. I found Fused <a href="https://docs.fused.io/core-concepts/write/" target="_blank" rel="noopener noreferrer">User Defined Functions</a> (UDFs) like <a href="https://www.fused.io/workbench/catalog/Overture_Maps_Example-64071fb8-2c96-4015-adb9-596c3bac6787" target="_blank" rel="noopener noreferrer">Overture Maps</a> and the <a href="https://www.fused.io/workbench/catalog/S2_explorer-c7470a85-097c-406b-95ae-53f189cb9879" target="_blank" rel="noopener noreferrer">S2 Explorer</a> and traveled all over the world looking for stunning images. It was thrilling to fly from New York to Tokyo and see the results render instantly.</p>
<!-- -->
<div style="text-align:center"><img src="https://docs-staging.fused.io/pr/532/assets/images/kent2-8d4559844a3fabd32d103f4d0d160a3f.jpg" alt="File"></div>
<p><em>Exploring the world with Sentinel 2.</em></p>
<p>I then began to change the components of these UDFs to see different Overture types, but at this point I was hesitant to build my own UDF from scratch.</p>
<h2 class="anchor anchorWithStickyNavbar_LWe7" id="instant-udfs">Instant UDFs<a href="https://docs-staging.fused.io/pr/532/blog/how-i-got-started-making-maps-with-python-and-sql/#instant-udfs" class="hash-link" aria-label="Direct link to Instant UDFs" title="Direct link to Instant UDFs">​</a></h2>
<p>That was until Fused launched its <a href="https://docs-staging.fused.io/pr/532/workbench/file-explorer/">File Explorer</a>. With one click, it was now possible for me to create a UDF from providers like <a href="https://source.coop/" target="_blank" rel="noopener noreferrer">Source Cooperative</a> and visualize with numerous presets like DuckDB or GeoPandas. With this new feature, I recreated my Egypt map with the same Vida dataset, this time using DuckDB with the H3 extension. It was liberating, I came to realize the components were simpler than I thought.</p>
<h2 class="anchor anchorWithStickyNavbar_LWe7" id="local-tests">Local Tests<a href="https://docs-staging.fused.io/pr/532/blog/how-i-got-started-making-maps-with-python-and-sql/#local-tests" class="hash-link" aria-label="Direct link to Local Tests" title="Direct link to Local Tests">​</a></h2>
<p>I used DuckDB with the H3 extension without Fused to query Overture Maps for countries and continents all locally in a Jupyter notebook. The benefit with the H3 extension is that if you set up the query right you can aggregate larger than in memory datasets at ease from your notebook.</p>
<!-- -->
<div style="text-align:center"><img src="https://docs-staging.fused.io/pr/532/assets/images/africa_road_density-f45dbdddd5eeede033184ea4cf4d4695.jpg" alt="File"></div>
<p><em>Road Density in Africa.</em></p>
<p>And made this Egypt building map with H3, how does it compare with the Datashader version up top?</p>
<!-- -->
<div style="text-align:center"><img src="https://docs-staging.fused.io/pr/532/assets/images/egypt_buidling_density_h3-4d689d471610e869d7206f0a407b3582.png" alt="File"></div>
<p><em>Egypt Building Density with H3.</em></p>
<h2 class="anchor anchorWithStickyNavbar_LWe7" id="fused-and-overture-maps">Fused and Overture Maps<a href="https://docs-staging.fused.io/pr/532/blog/how-i-got-started-making-maps-with-python-and-sql/#fused-and-overture-maps" class="hash-link" aria-label="Direct link to Fused and Overture Maps" title="Direct link to Fused and Overture Maps">​</a></h2>
<p>In August, Fused announced a tighter partnership with <a href="https://docs.overturemaps.org/getting-data/fused/" target="_blank" rel="noopener noreferrer">Overture Maps Foundation</a> and that came with even more Overture features. Like with Source Cooperative I could now instantly generate UDF of buildings, places, land use, or roads, etc by joining parquet files (and more). I proceeded to use the framework of that UDF to join all kinds of data.</p>
<!-- -->
<div style="text-align:center"><img src="https://docs-staging.fused.io/pr/532/assets/images/kent3-e83041d0ec69326f00c9da9b427594d2.png" alt="File"></div>
<p><em>Proximity analysis between Road Networks and Hospitals in Paris.</em></p>
<h2 class="anchor anchorWithStickyNavbar_LWe7" id="joining-h3-with-geojson">Joining H3 with GeoJSON<a href="https://docs-staging.fused.io/pr/532/blog/how-i-got-started-making-maps-with-python-and-sql/#joining-h3-with-geojson" class="hash-link" aria-label="Direct link to Joining H3 with GeoJSON" title="Direct link to Joining H3 with GeoJSON">​</a></h2>
<p>One day I was looking at the <a href="https://github.com/fusedio/udfs/tree/main/public/DuckDB_H3_Example" target="_blank" rel="noopener noreferrer">DuckDB_H3_Example</a>, and I was struck — what if I joined those cells with Overture Buildings? I learned how to use the DuckDB H3 extension from all of the example UDFs on Fused. So I called that UDF in an Overture UDF and used GeoPandas to join the two. The result is the map below. The color of the buildings comes from the count of corresponding Yellow Cab pickups. There are millions of points in this TLC parquet file, and H3 helped me to aggregate to thousands for an easier spatial join.</p>
<!-- -->
<div style="text-align:center"><img src="https://docs-staging.fused.io/pr/532/assets/images/kent4-b4cdce317a7016e40bfcd13926e7457c.png" alt="File"></div>
<p><em>Overture Buildings joined with H3 Yellow Cab pickups in New York City.</em></p>
<p>I made this particular map with Kepler.gl, with two clicks from the Workbench. I could have also exported the data to tools like <a href="https://felt.com/" target="_blank" rel="noopener noreferrer">Felt</a> and <a href="https://www.mapbox.com/" target="_blank" rel="noopener noreferrer">Mapbox</a>. You can find the code I used to recreate this map <a href="https://github.com/kentstephen/duckdb_h3" target="_blank" rel="noopener noreferrer">here</a>.</p>
<h2 class="anchor anchorWithStickyNavbar_LWe7" id="app-builder">App Builder<a href="https://docs-staging.fused.io/pr/532/blog/how-i-got-started-making-maps-with-python-and-sql/#app-builder" class="hash-link" aria-label="Direct link to App Builder" title="Direct link to App Builder">​</a></h2>
<p>I just started working on the Fused <a href="https://docs-staging.fused.io/pr/532/workbench/app-builder/">App Builder</a>, and made a dashboard to view and interact with NYC’s 311 call data as a 3D H3 heatmap. Anyone using it can set the date range and resolution to change the display. Very fast and easy to use.</p>
<h2 class="anchor anchorWithStickyNavbar_LWe7" id="community">Community<a href="https://docs-staging.fused.io/pr/532/blog/how-i-got-started-making-maps-with-python-and-sql/#community" class="hash-link" aria-label="Direct link to Community" title="Direct link to Community">​</a></h2>
<p>There's so much exciting data science happening on Fused. Check out Kevin Lacaille's post on <a href="https://docs-staging.fused.io/pr/532/blog/global-vegetation-segmentation/">ML-less global vegetation segmentation at scale</a>. And Christopher Kyed's <a href="https://docs-staging.fused.io/pr/532/blog/analyzing-traffic-speeds/">Analyzing traffic speeds from 100 billion drive records</a>, that is the kind of project I would love to work on.</p>
<p>I continuously find inspiration as I browse community UDFs. Here's a join of H3 heatmaps with Overture types. This is a heatmap of connectors (intersections) joined with segments (roads) in London. The darker colors have more intersections. I am looking to incorporate traffic counts.</p>
<!-- -->
<div style="text-align:center"><img src="https://docs-staging.fused.io/pr/532/assets/images/kent5-89ae79a707f3282147b658641ed6300b.jpg" alt="File"></div>
<p><em>Road density in London.</em></p>
<h2 class="anchor anchorWithStickyNavbar_LWe7" id="conclusion">Conclusion<a href="https://docs-staging.fused.io/pr/532/blog/how-i-got-started-making-maps-with-python-and-sql/#conclusion" class="hash-link" aria-label="Direct link to Conclusion" title="Direct link to Conclusion">​</a></h2>
<p>I have been using Fused for several months but it feels like I am just getting started. It seems like the only real limit here is what I can dream up.</p>
<p><em>This is a cross-post of Stephen Kent's <a href="https://medium.com/@stephen.kent.data/how-i-got-started-making-maps-with-python-and-sql-5aaefcfb2b27" target="_blank" rel="noopener noreferrer">Medium Article</a> published October 14, 2024.</em></p>]]></content>
        <author>
            <name>Stephen Kent</name>
            <uri>https://www.linkedin.com/in/stephen-kent-37b97454/</uri>
        </author>
    </entry>
</feed>