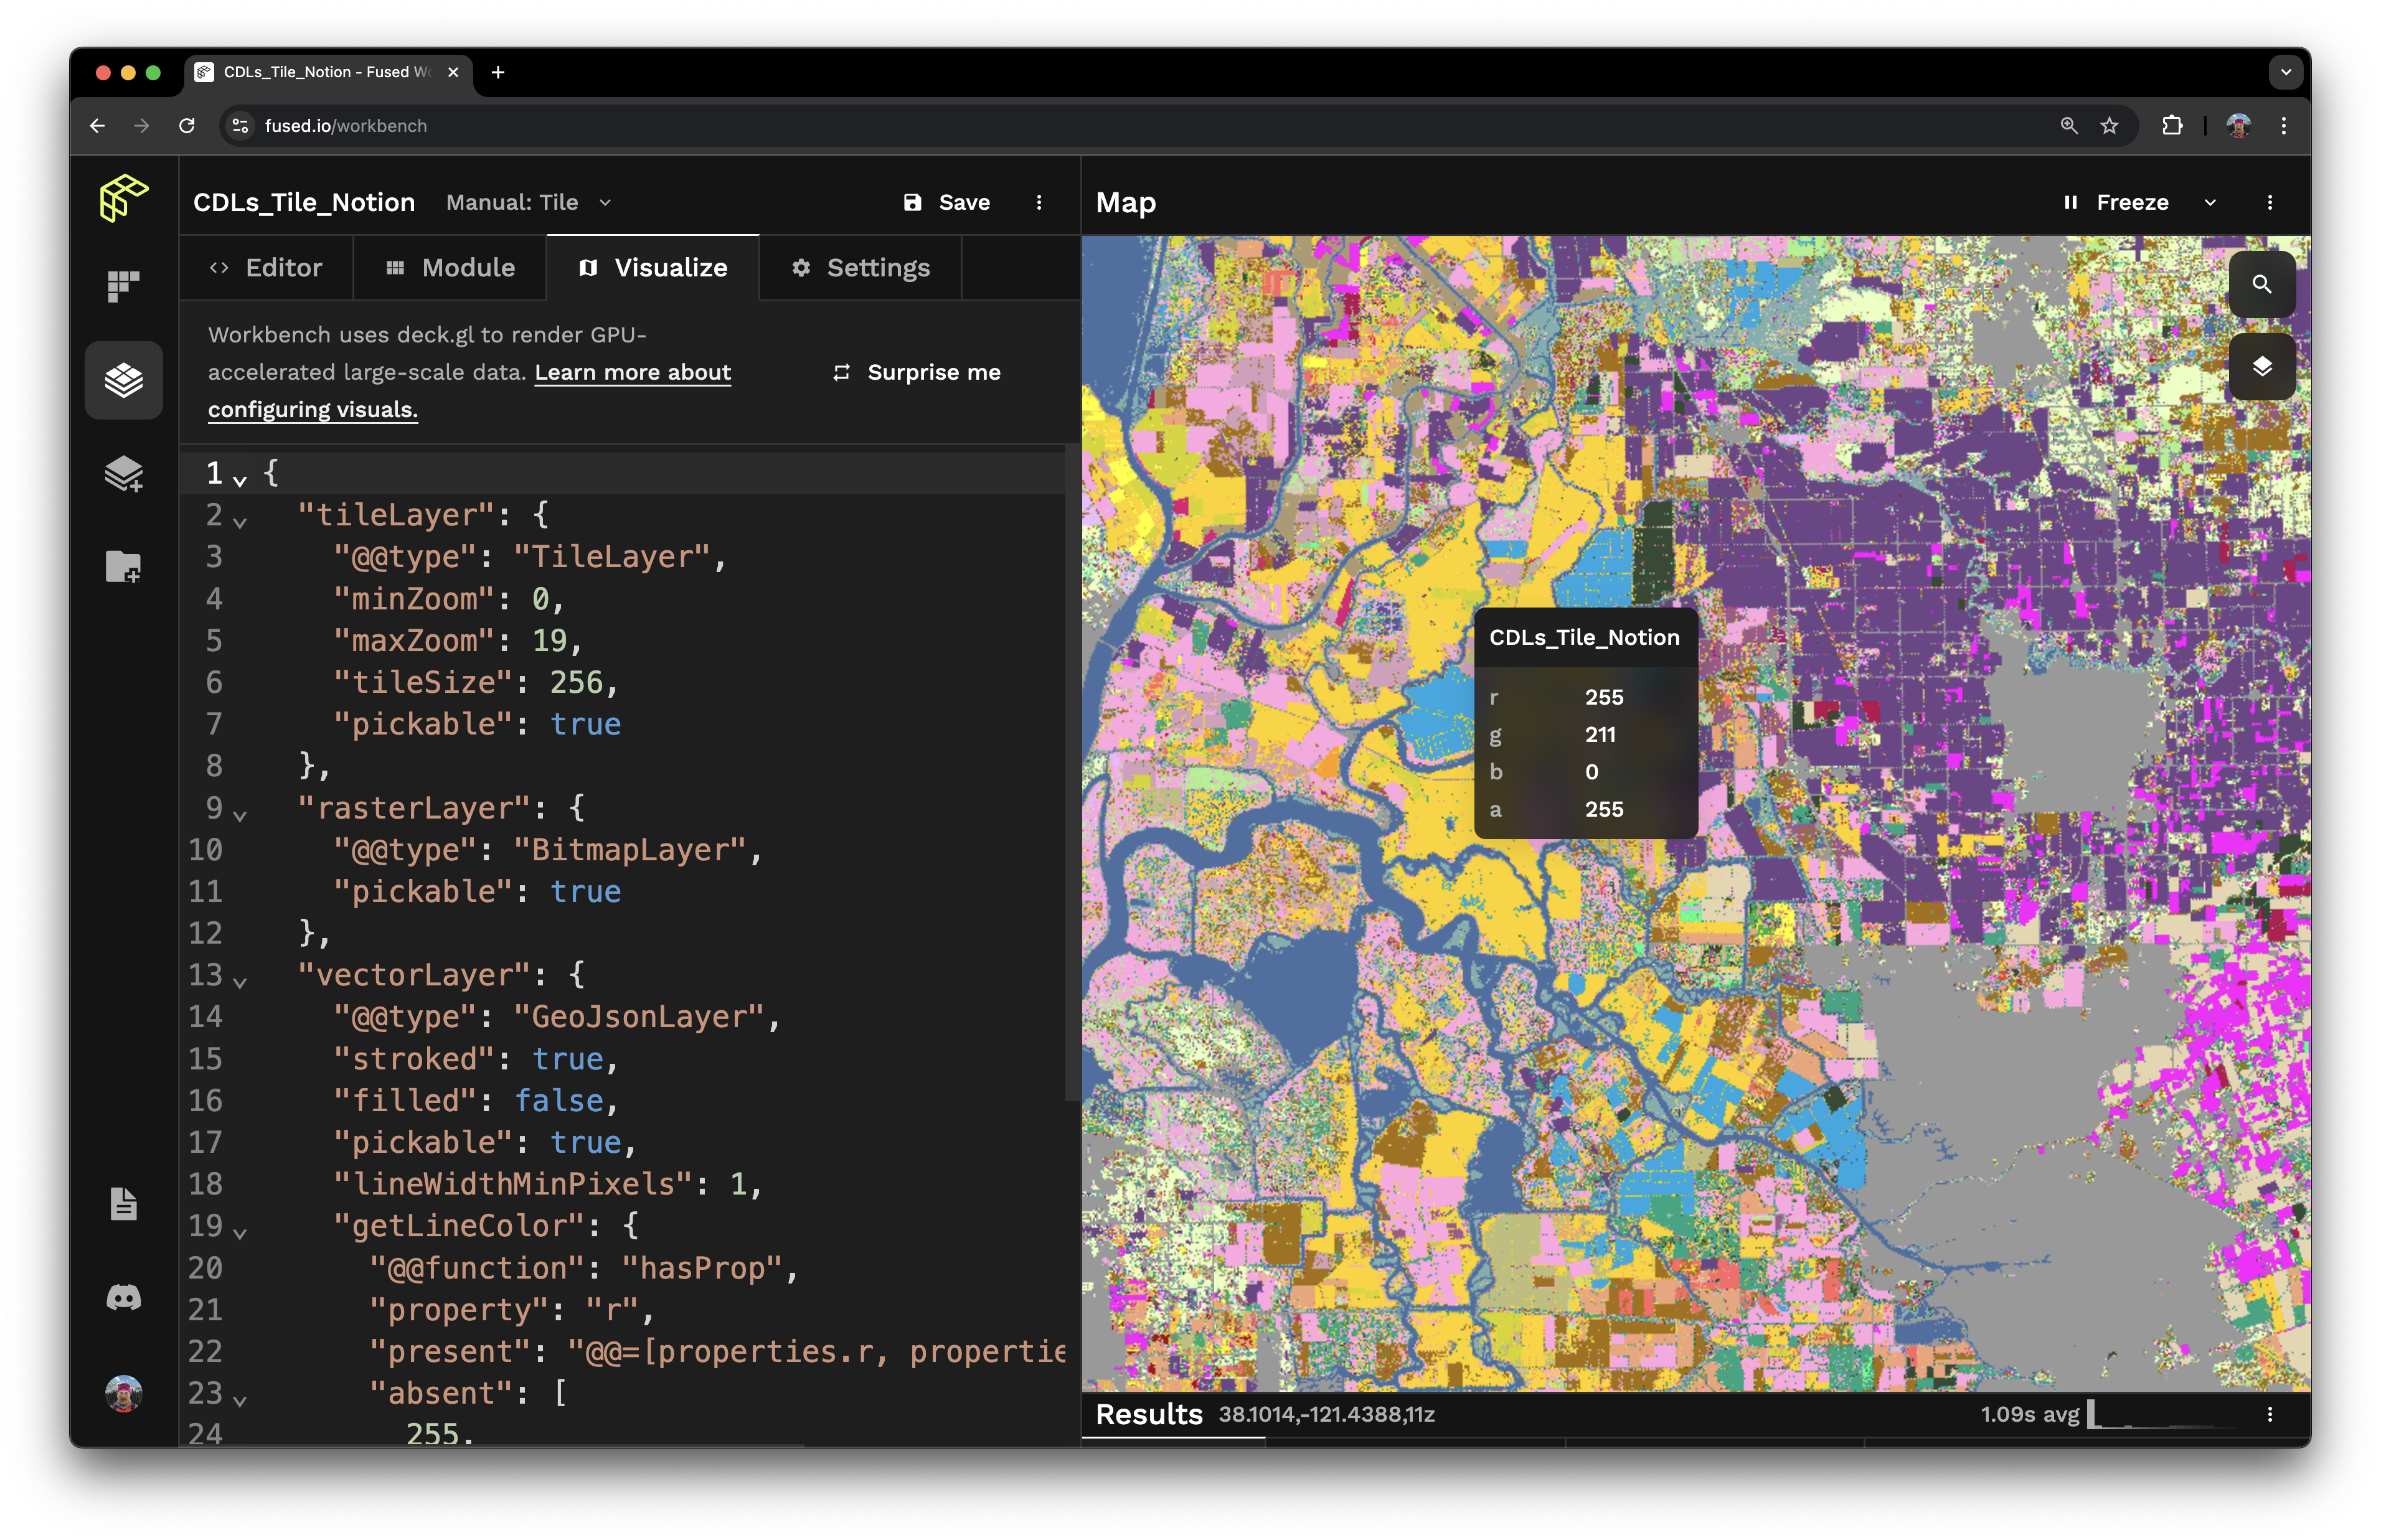
Layer Styling: Visualize Tab
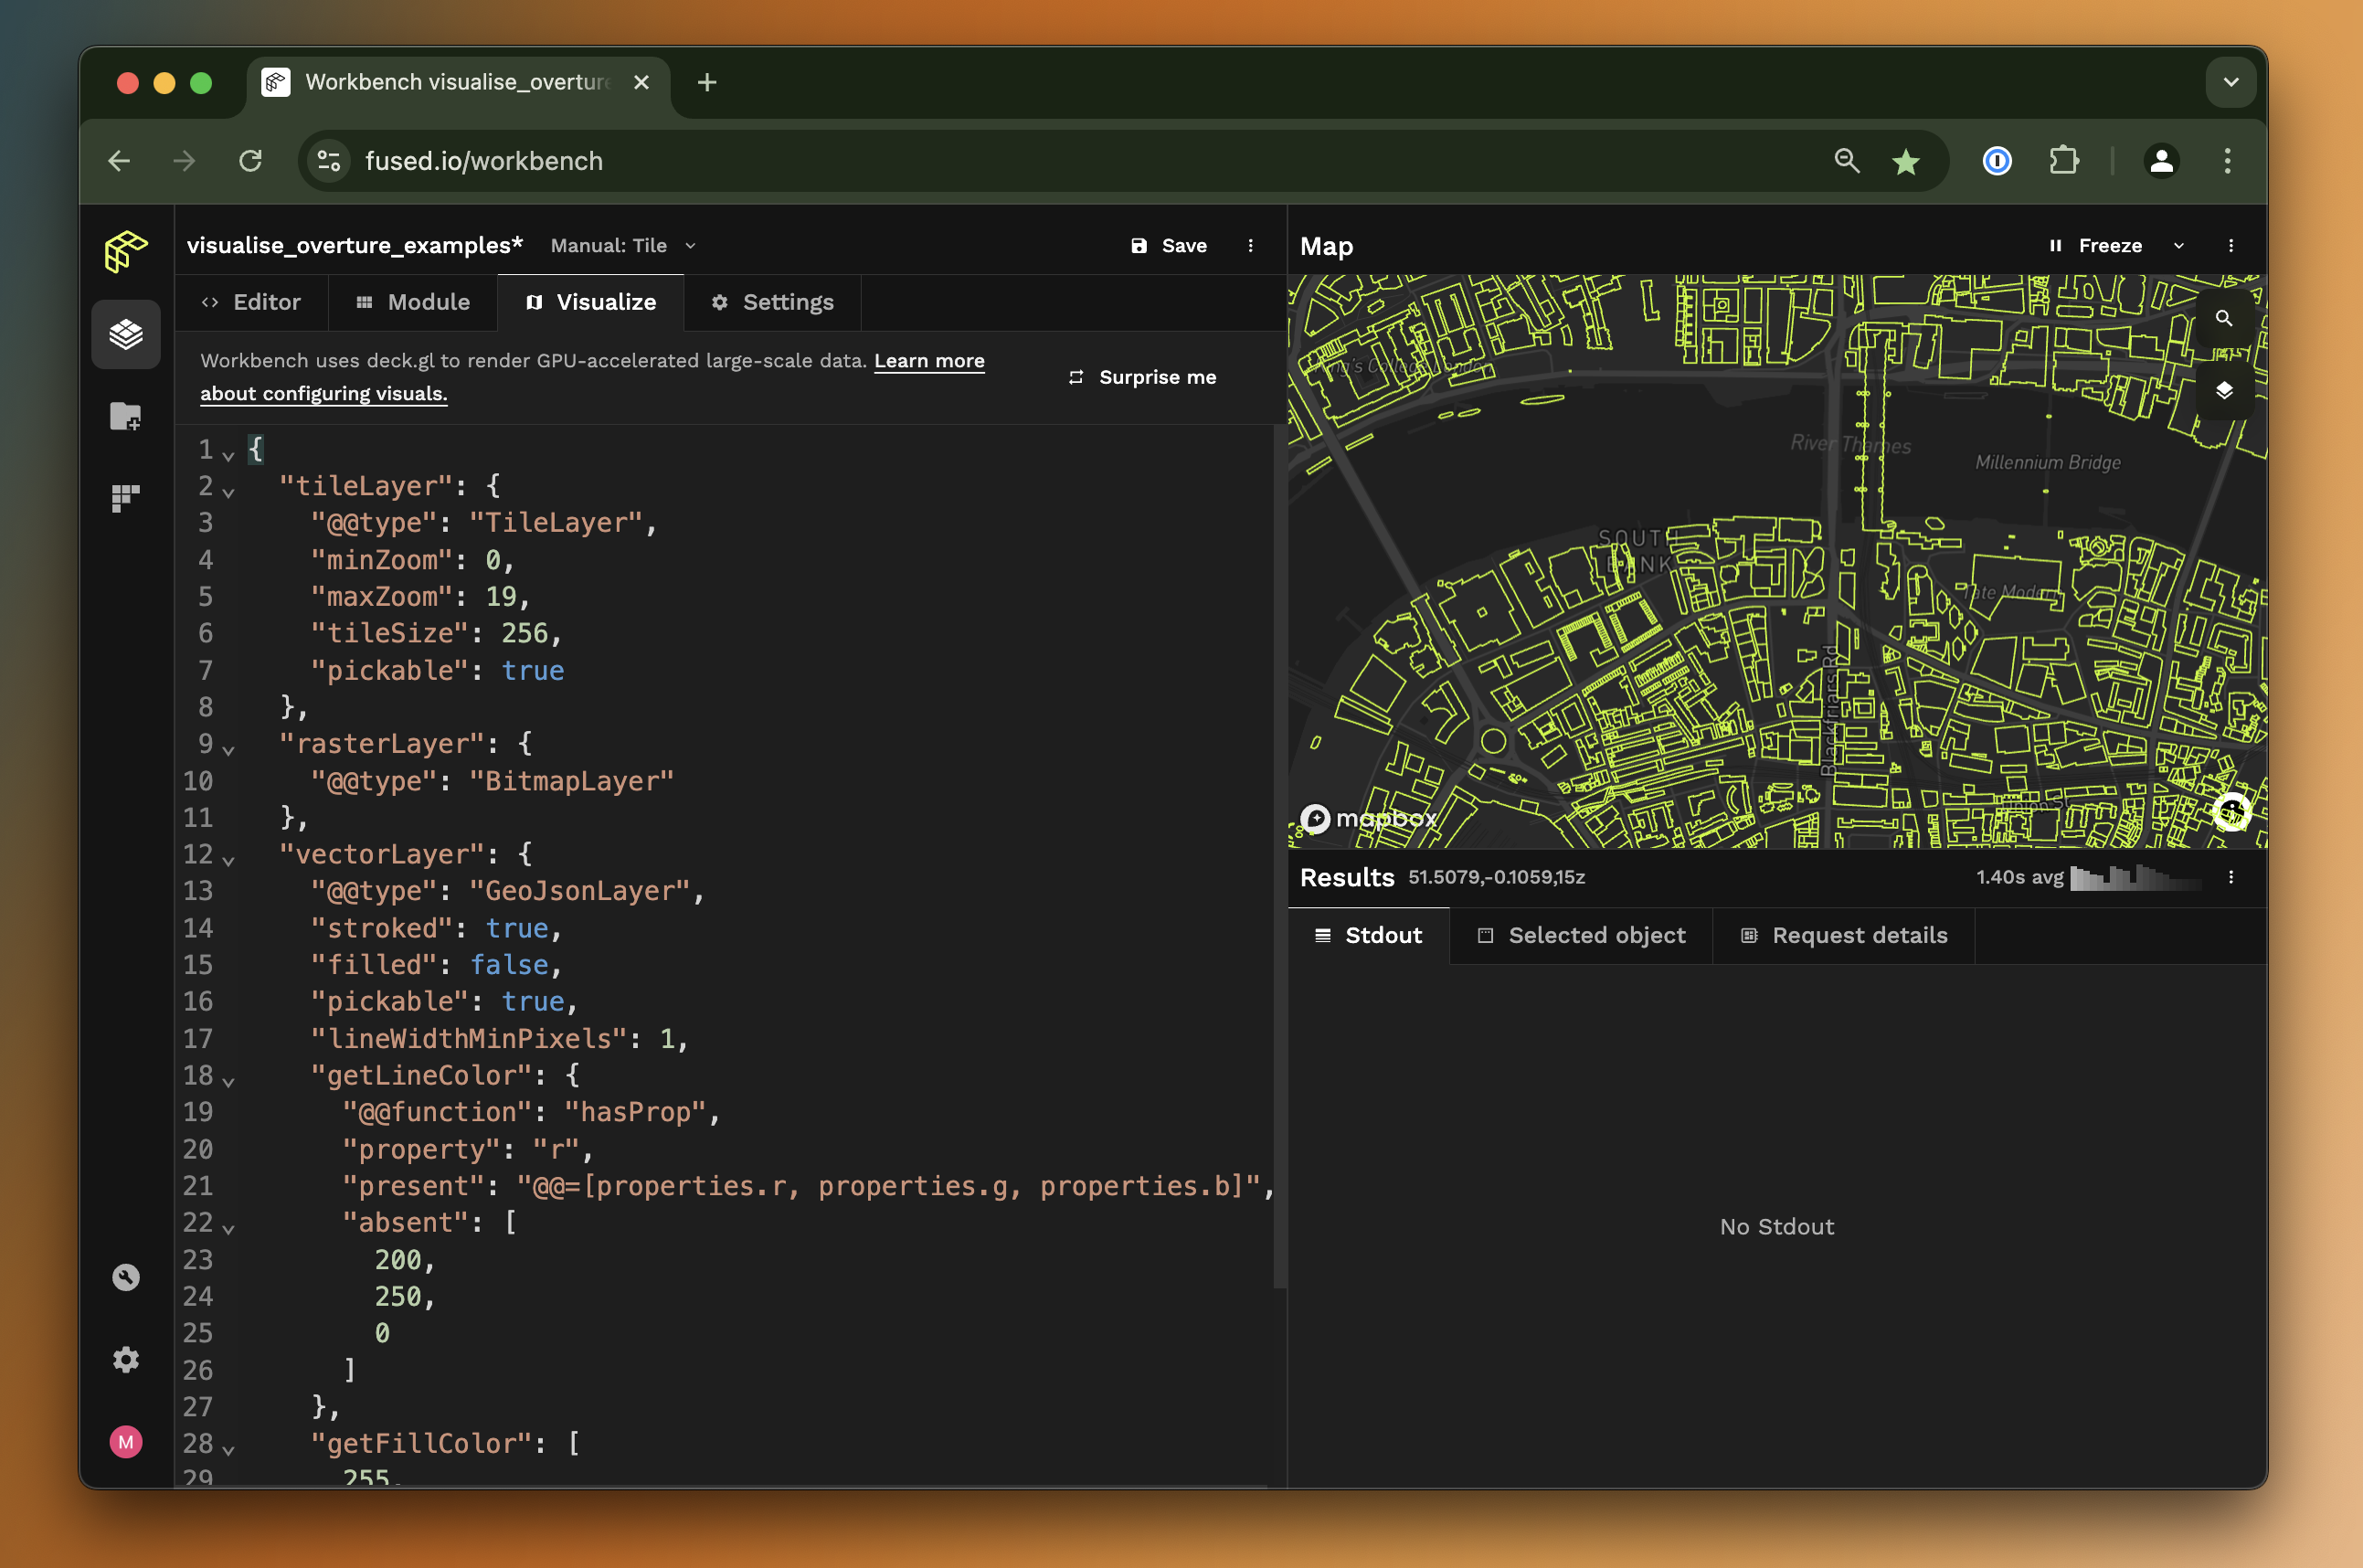
The UDF builder displays data from the UDF into the map view. You can change the visual representation of a UDF's output is configured under the "Visualize" tab:
You'll notice a few differences to the Editor:
- The Visualise tab isn't written in Python, rather this is a JSON file
- There are a few defaults namely
TileLayer,rasterLayerandvectorLayer - "Surprise Me" button. Try it out for yourself, see what happens! (you can always
Ctrl + Zto go back if you don't like it)
You can explore this example right here for yourself. Click on the "UDF Builder" icon on the left, just below the Fused logo to open the code editor:
Basics of Visualize Tab
The Visualize tab is built on top of DeckGL, a JavaScript front-end framework build for large dataset visualizations.
Fused works with on a either a File or Tile basis (read more about this here). The styling will differ for each:
Tile-> We're leveraging DeckGL'sTileLayerin the Map view as a basis allowing us to render only data that is in the viewport at any given moment.File-> All of the output data is in a single file, so theTileLayerpart is ignored and the sub-layersvectorLayerorrasterLayerare used directly:
We have created 2 Fused-specific sub-layers:
rasterLayerfor all raster-based visualisations (if your UDF returns a PNG for example)vectorLayerfor all vector-based visualisations (if your UDF returns aGeoDataFramefor example)
Under the hood Fused will use whichever sublayer fits your UDF output, but keep in mind that both are defined in each UDF:
// psuedo-code overview of Visualize tab parameters
{
  "tileLayer": {
    "@@type": "TileLayer",
    ...
  },
  // This is a Fused-specific sublayer for all raster outputs
  "rasterLayer": {
    "@@type": "BitmapLayer"
    ...
  },
  // This is a Fused-specific sublayer for all vector outputs
  "vectorLayer": {
    "@@type": "GeoJsonLayer",
    ...
  }
}
Depending on what your UDF returns, you can use different layer types (this is the current supported list):
- Vector
H3HexagonLayersfor UDFs returning a JSON with a column containing H3 indices - Vector
GeoJsonLayerfor UDFs returning aGeoDataFrame(or anyDataFramewith a geometry column) - Raster
BitmapLayerfor UDFs returning an array
Their visualization styles can be configured with DeckGL properties.
You can hold Cmd on MacOS or Ctrl on Windows / Linux to tilt the map view.
You can try it out in the map right below this in the "Vector H3HexagonLayer" section 👇
Vector H3HexagonLayer
At the moment, any pd.DataFrame will be rendered using the vectorLayer config. If your DataFrame does have H3 indices you can use H3HexagonLayer to display those as hexagon vectors.
In this case, the config column getHexagon should be set with the name of the DataFrame column of H3 indices. The rendered hexagons can be styled by setting values from a different column in getFillColor & getElevation.
Expand to see Visualise code
{
  "tileLayer": {
    "@@type": "TileLayer",
    "minZoom": 0,
    "maxZoom": 19,
    "tileSize": 256,
    "pickable": true
  },
  "vectorLayer": {
    "@@type": "H3HexagonLayer",
    "stroked": true,
    "filled": true,
    "pickable": true,
    "extruded": false,
    "opacity": 1,
    "coverage": 0.9,
    "lineWidthMinPixels": 5,
    // This assumes your UDF returns a DataFrame with a column called 'hex' containing all the H3 indices
    "getHexagon": "@@=properties.hex",
    "getLineColor": {
      "@@function": "hasProp",
      "property": "metric",
      "present": "@@=[(1 - properties.metric/500) * 255, 0, 255]",
      "absent": [200, 200, 200]
    },
    "getFillColor": {
      "@@function": "hasProp",
      "property": "metric",
      "present": "@@=[255, (1 - properties.metric/500) * 255, 0]",
      "absent": [220, 255, 100]
    },
    "getElevation": {
      "@@function": "hasProp",
      "property": "metric",
      "present": "@@=properties.metric",
      "absent": 1
    },
    "elevationScale": 10
  }
}
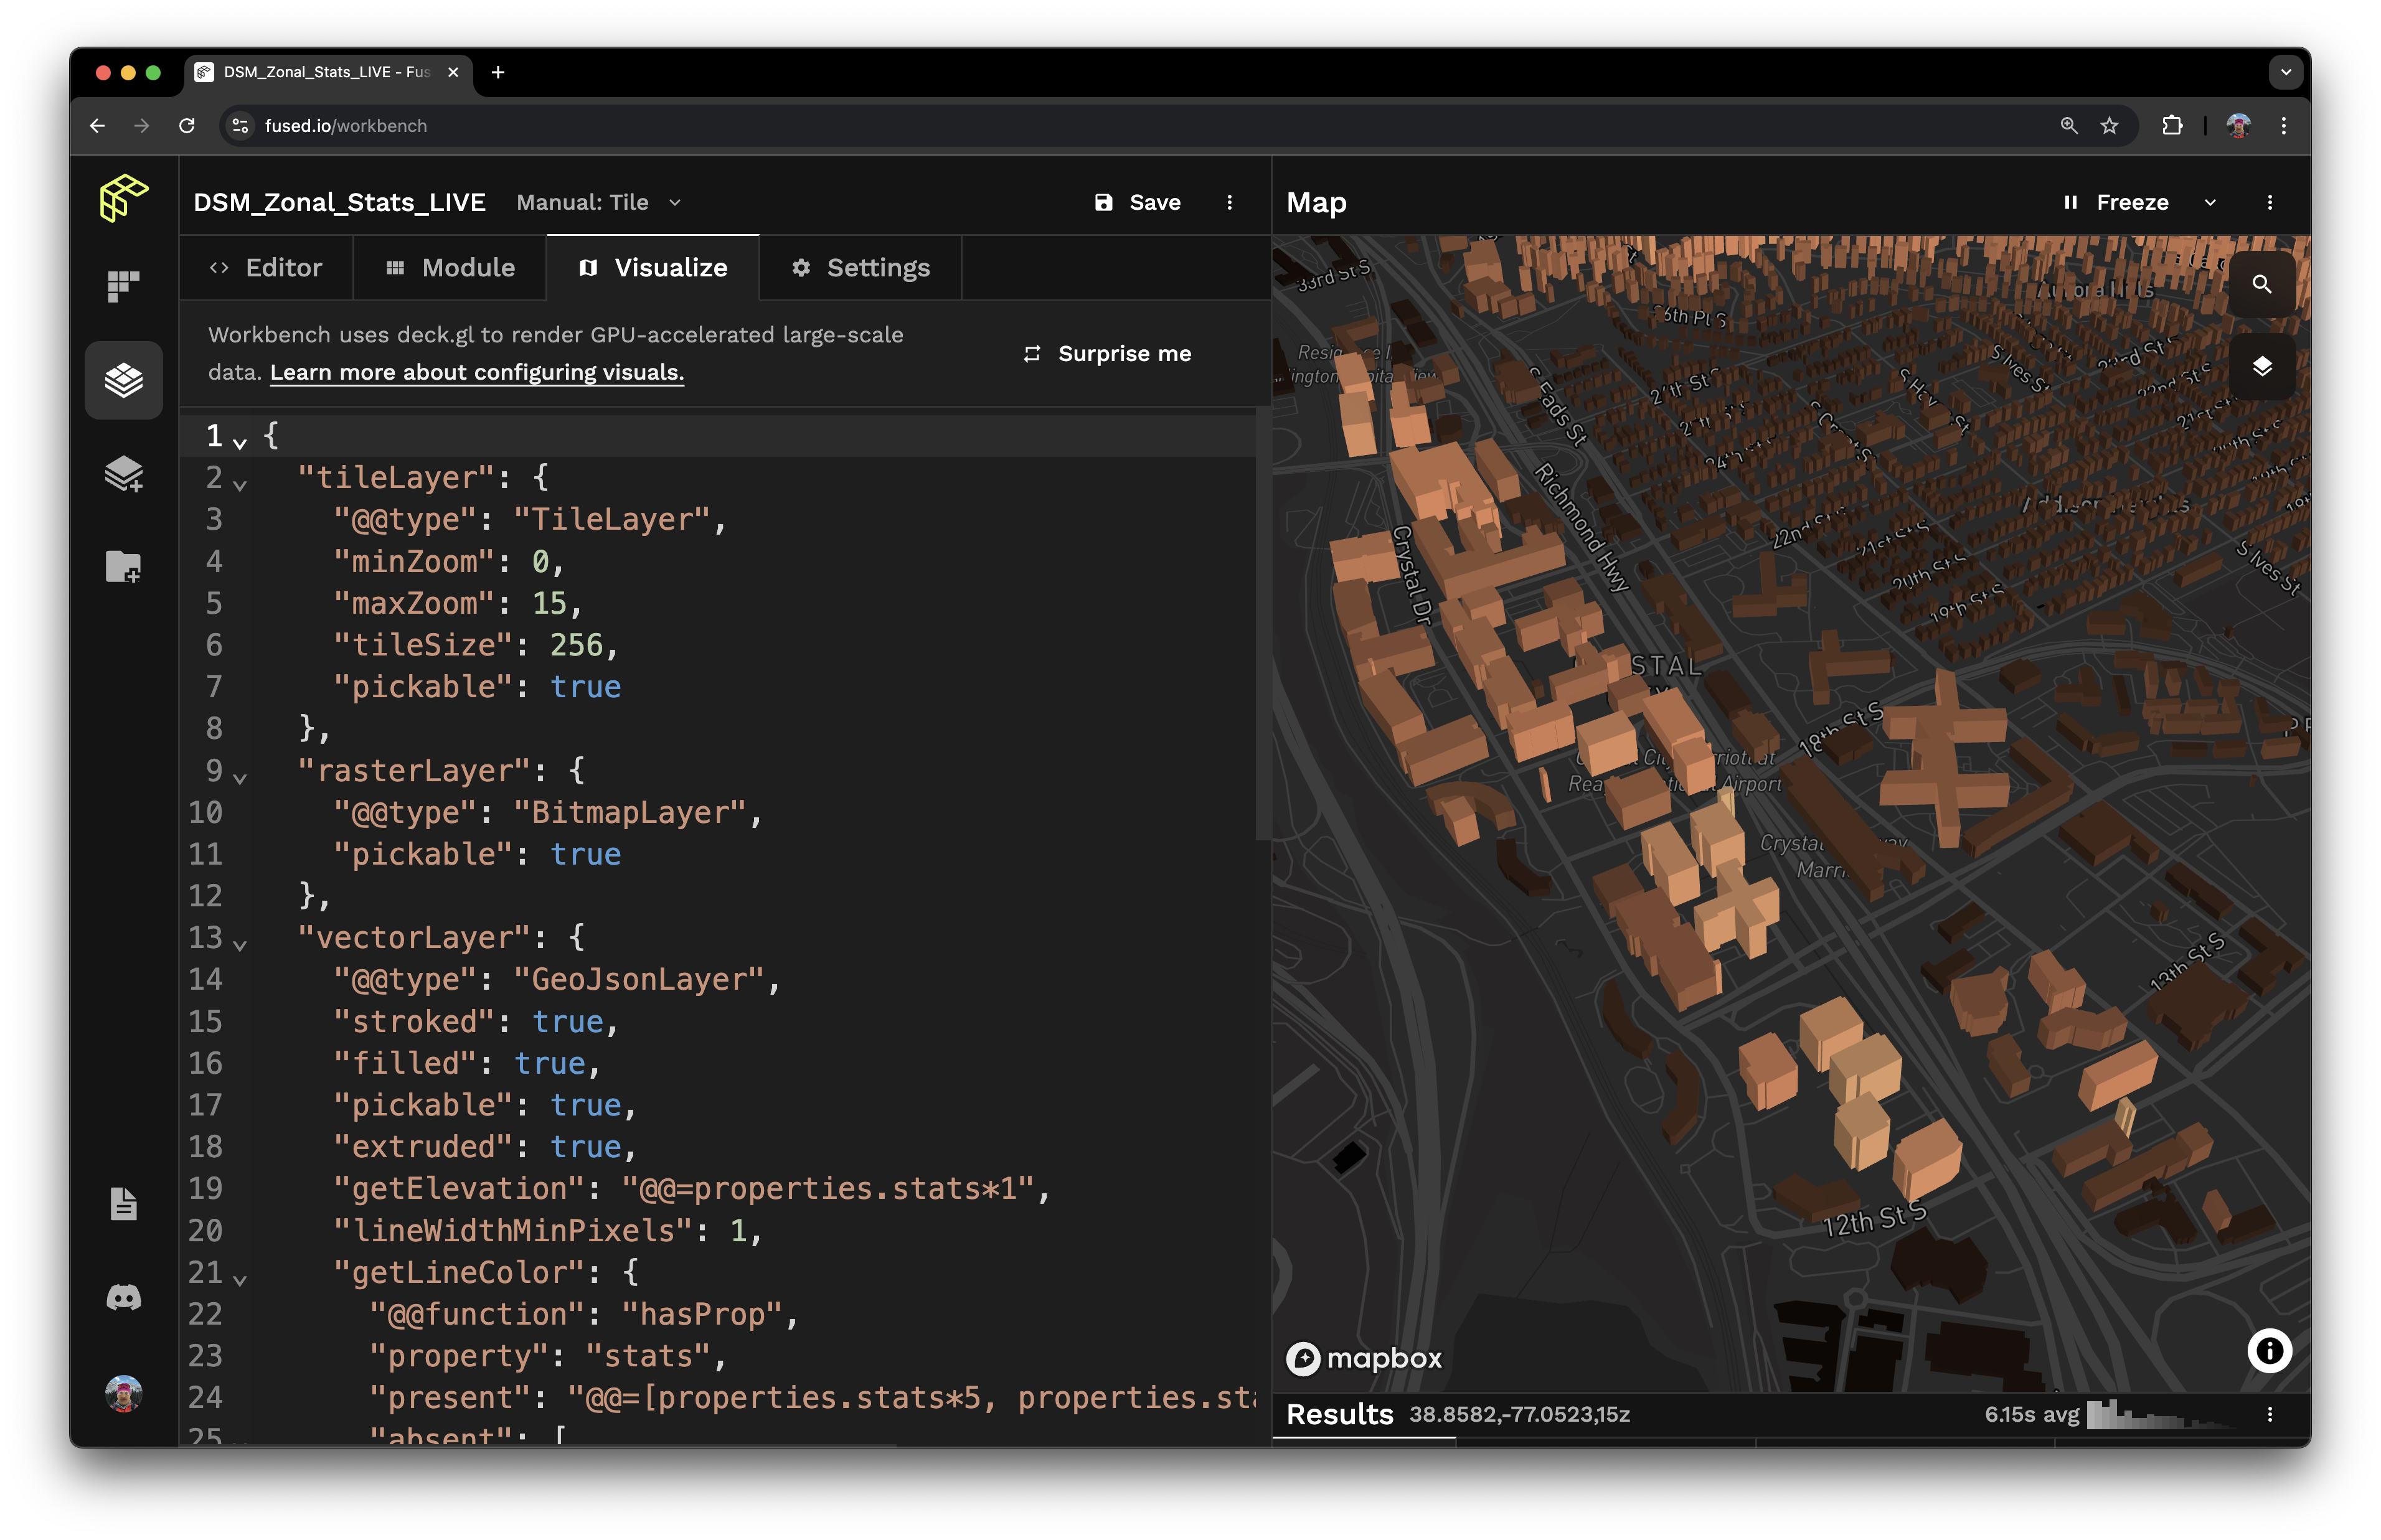
Vector GeoJsonLayer
The visualization of the output of a UDF that returns a DataFrame or GeoDataFrame can be configured dynamically based on column values. Attributes of the vectorLayer can be set to use either hardcoded values or column values, such as:
- Line color (
getLineColor) and line width (getLineWidth) - Elevation (
getElevation) withextrudedset to true lineWidthUnitshelps maintain visual consistency across zoom levels when set topixels
Expand to see Visualise code
{
  "tileLayer": {
    "@@type": "TileLayer",
    "minZoom": 0,
    "maxZoom": 15,
    "tileSize": 256,
    "pickable": true
  },
  "vectorLayer": {
    "@@type": "GeoJsonLayer",
    "stroked": true,
    "filled": true,
    "pickable": true,
    "extruded": true,
    "getElevation": "@@=properties.stats*1",
    "lineWidthMinPixels": 1,
    "getLineWidth": "@@=properties.stats*10",
    "getLineColor": {
      "@@function": "hasProp",
      "property": "stats",
      "present": "@@=[properties.stats*5, properties.stats*3, properties.stats*2]",
      "absent": [255, 0, 255]
    },
    "getFillColor": "@@=[properties.stats*5, properties.stats*3, properties.stats*2]"
  }
}
Color styling
There are 4 ways to set the color for the stroke (getLineColor) and fill (getFillColor) of a GeoJsonLayer. These examples show how to set it for the fill with getFillColor, and the same syntax applies for the stroke with getLineColor. They all modify the visualization config for this UDF.
@fused.udf
def udf(
    bbox: fused.types.Bbox = None,
    table_path: str = "s3://fused-asset/infra/building_msft_us/",
):
    import numpy as np
    import random
    utils = fused.load("https://github.com/fusedio/udfs/tree/eda5aec/public/common/").utils

    # Load data
    gdf=utils.table_to_tile(bbox, table=table_path)

    # Assign random numbers
    gdf['value'] = np.random.randint(0,10, len(gdf))

    # Assign random classes
    categories = ['residential', 'commercial', 'health', 'public']
    gdf['class'] = [random.choice(categories) for _ in range(len(gdf))]

    print(gdf)
    return gdf
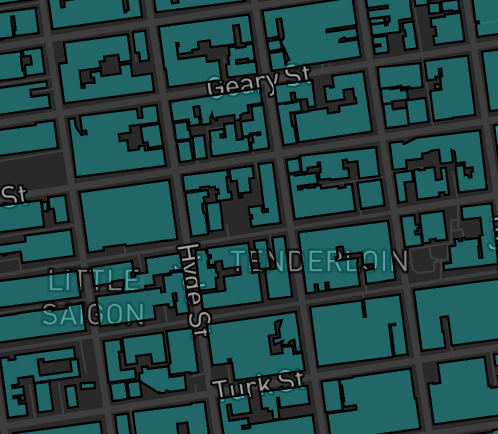
With a single hardcoded color
Expand to see Visualise code
{
  "tileLayer": {
    "@@type": "TileLayer",
    "minZoom": 0,
    "maxZoom": 19,
    "tileSize": 256,
    "pickable": true
  },
  "rasterLayer": {
    "@@type": "BitmapLayer",
    "pickable": true
  },
  "vectorLayer": {
    "@@type": "GeoJsonLayer",
    "stroked": true,
    "filled": true,
    "pickable": true,
    "lineWidthMinPixels": 1,
    "pointRadiusMinPixels": 1,
    "getFillColor": [20,200,200,100]
  }
}
Based on a property value
Expand to see Visualise code
{
  "tileLayer": {
    "@@type": "TileLayer",
    "minZoom": 0,
    "maxZoom": 15,
    "tileSize": 256,
    "pickable": true
  },
  "rasterLayer": {
    "@@type": "BitmapLayer",
    "pickable": true
  },
  "vectorLayer": {
    "@@type": "GeoJsonLayer",
    "stroked": true,
    "filled": true,
    "pickable": true,
    "extruded": true,
    "getElevation": "@@=properties.stats*1",
    "lineWidthMinPixels": 1,
    "getFillColor": "@@=[properties.value*50, properties.value*30, properties.value*2]"
  }
}
Alternatively, to support a default color when a value is absent.
Expand to see Visualise code
{
  "tileLayer": {
    "@@type": "TileLayer",
    "minZoom": 0,
    "maxZoom": 15,
    "tileSize": 256,
    "pickable": true
  },
  "rasterLayer": {
    "@@type": "BitmapLayer",
    "pickable": true
  },
  "vectorLayer": {
    "@@type": "GeoJsonLayer",
    "stroked": true,
    "filled": true,
    "pickable": true,
    "extruded": true,
    "getElevation": "@@=properties.stats*1",
    "lineWidthMinPixels": 1,
    "getFillColor": {
      "@@function": "hasProp",
      "property": "value",
      "present": "@@=[properties.value*50, properties.value*3, properties.value*2]",
      "absent": [
        255,
        0,
        255
      ]
    }
  }
}
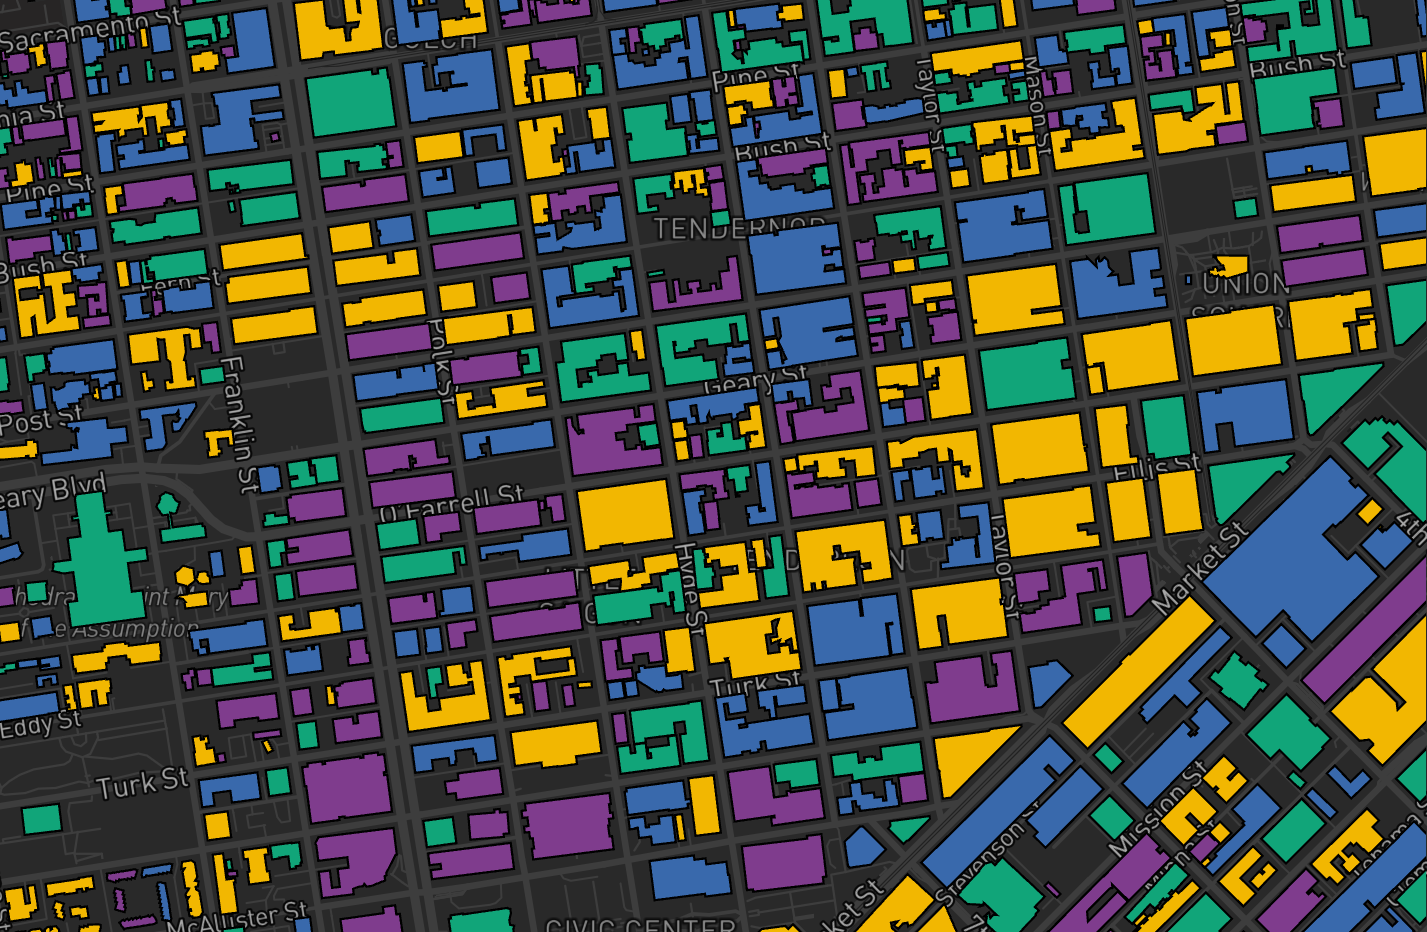
Using colorCategories
To set the color with colorCategories, use the attr property to specify the table column for the values, and the colors property to define the desired color palette.
Expand to see Visualise code
{
  "tileLayer": {
    "@@type": "TileLayer",
    "minZoom": 0,
    "maxZoom": 19,
    "tileSize": 256,
    "pickable": true
  },
  "rasterLayer": {
    "@@type": "BitmapLayer",
    "pickable": true
  },
  "vectorLayer": {
    "@@type": "GeoJsonLayer",
    "stroked": true,
    "filled": true,
    "pickable": true,
    "lineWidthMinPixels": 1,
    "pointRadiusMinPixels": 1,
    "getFillColor": {
      "@@function": "colorCategories",
      "attr": "class",
      "domain": [
        "residential",
        "commercial",
        "health",
        "public"
      ],
      "colors": "Bold"
    }
  }
}
Note that unexpected behaviors may arise if too many domains are used.
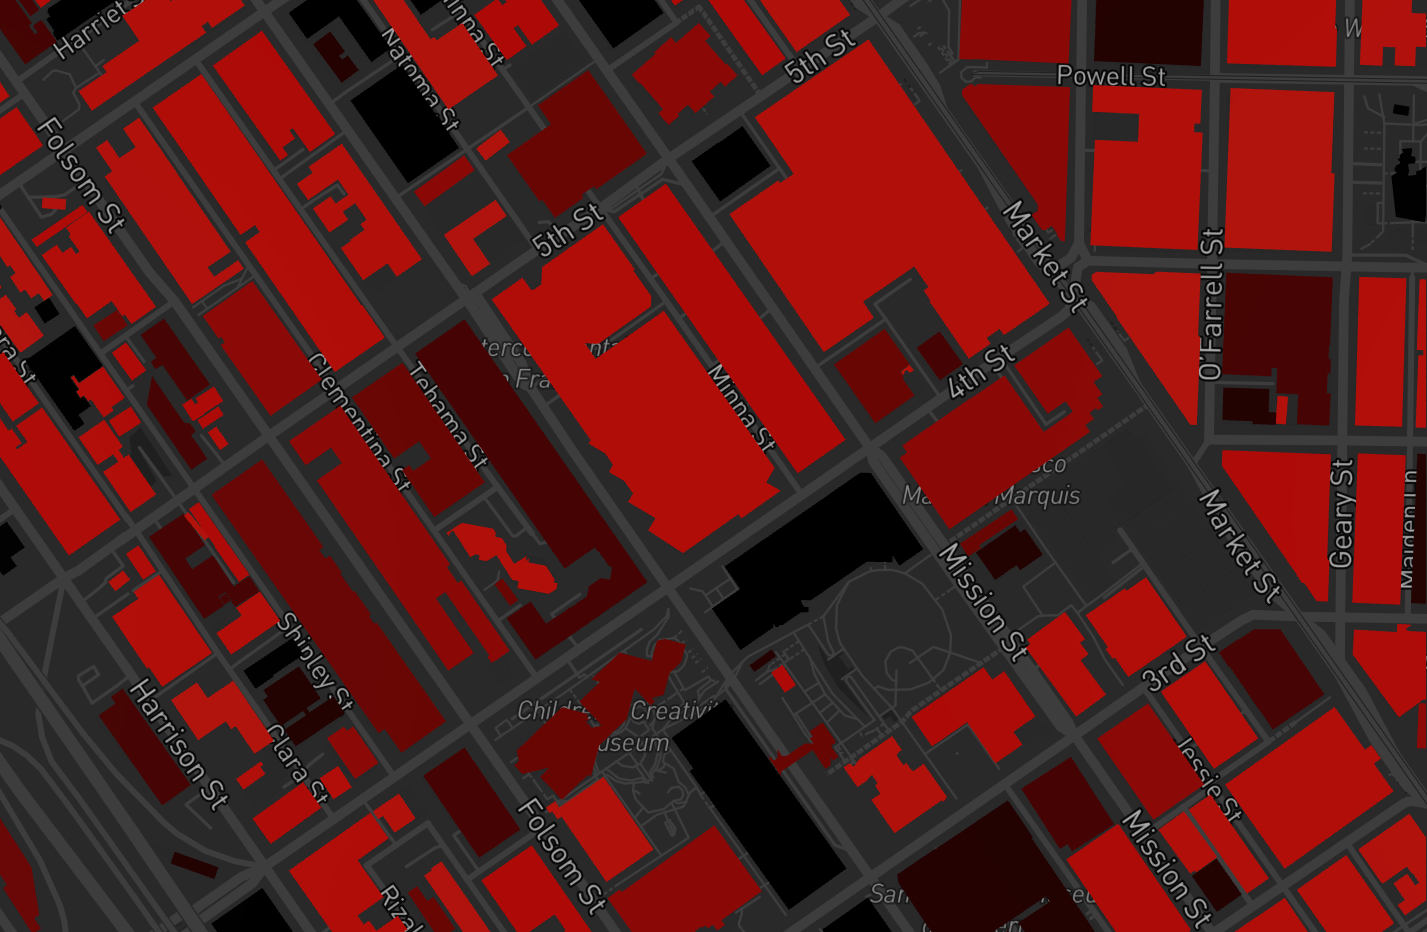
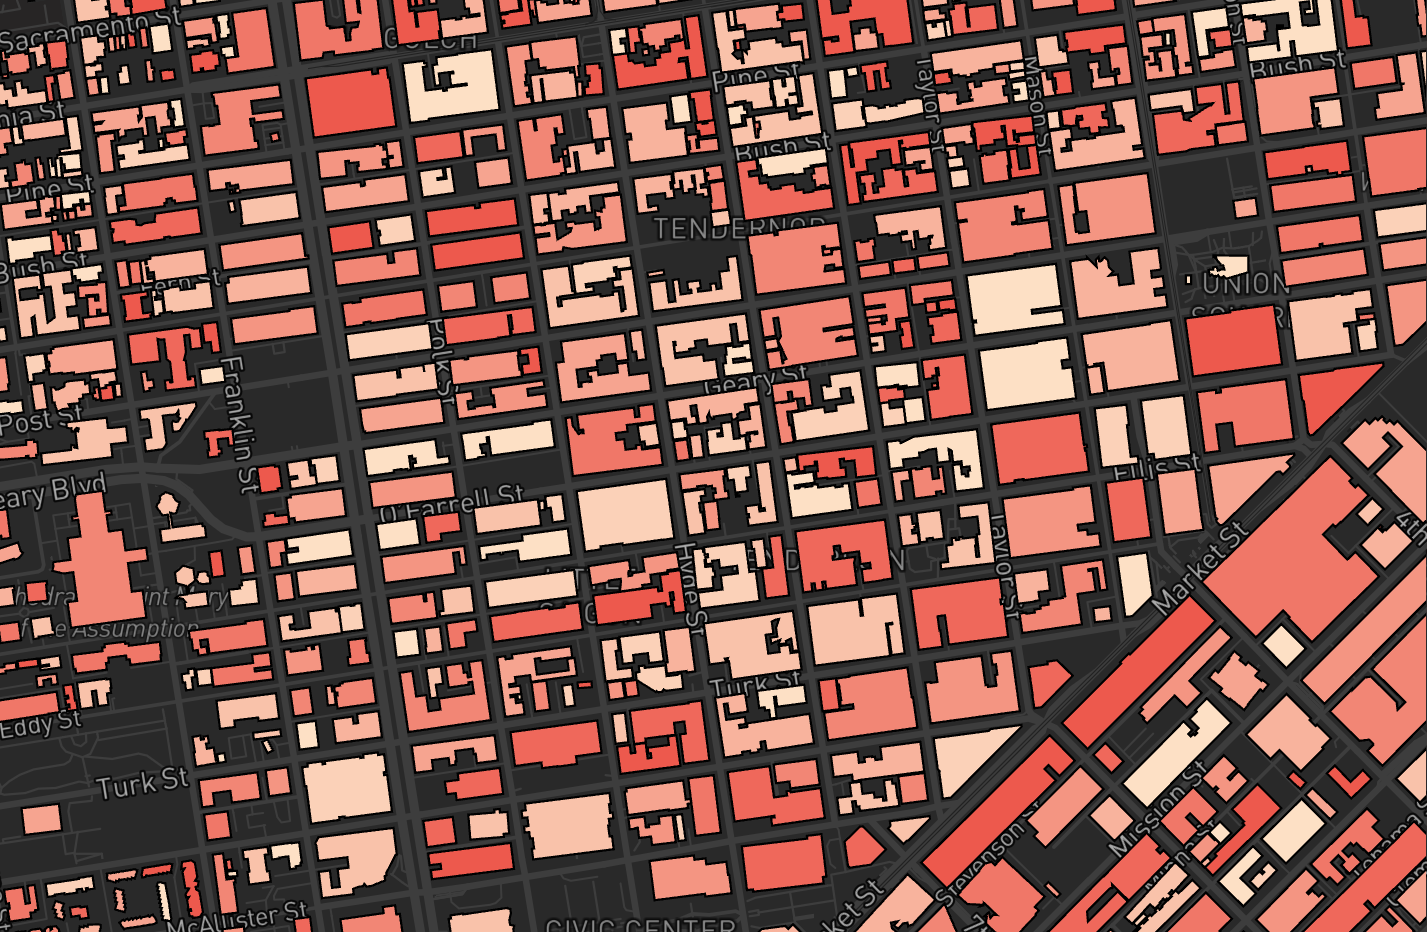
Using colorContinuous
To set the color with colorContinuous, use the attr property to specify the table column for the values, and the colors property to define the desired color palette.
Expand to see Visualise code
{
  "tileLayer": {
    "@@type": "TileLayer",
    "minZoom": 0,
    "maxZoom": 19,
    "tileSize": 256,
    "pickable": true
  },
  "rasterLayer": {
    "@@type": "BitmapLayer",
    "pickable": true
  },
  "vectorLayer": {
    "@@type": "GeoJsonLayer",
    "stroked": true,
    "filled": true,
    "pickable": true,
    "lineWidthMinPixels": 1,
    "pointRadiusMinPixels": 1,
    "getFillColor": {
      "@@function": "colorContinuous",
      "attr": "value",
      "domain": [
        0,
        10
      ],
      "colors": "Peach",
      "nullColor": [
        184,
        184,
        184
      ]
    }
  }
}
Raster BitmapLayer
Raster layers can be set to display a tooltip on hover by setting the pickable property to true. See DeckGL documentation.
Expand to see Visualise code
{
  "tileLayer": {
    "@@type": "TileLayer",
    "minZoom": 0,
    "maxZoom": 19,
    "tileSize": 256,
    "pickable": true
  },
  "rasterLayer": {
    "@@type": "BitmapLayer",
    "pickable": true
  }
}
The transparency of raster images can be set in two ways:
- In RGB images, the color black (0,0,0) is automatically set to full transparency.
If a 4-channel array is passed, i.e. RGBA, the value of the 4th channel is the transparency.
Custom loadingLayer and errorLayer
When tileLayer has "@@type": "DebugTileLayer" set loadingLayer and errorLayer can be configured to show the user that the UDF is still processing or that an error occurred. This is helpful for debugging.
Expand to see Visualise code
{
  "tileLayer": {
    "@@type": "DebugTileLayer",
    "minZoom": 0,
    "maxZoom": 15,
    "tileSize": 256,
    "pickable": true
  },
  "rasterLayer": {
    "@@type": "BitmapLayer",
    "pickable": true
  },
  "vectorLayer": {
    "@@type": "GeoJsonLayer",
    "stroked": true,
    "filled": true,
    "pickable": true,
    "extruded": true,
    "getElevation": "@@=properties.stats*1",
    "lineWidthMinPixels": 1,
    "getLineColor": {
      "@@function": "hasProp",
      "property": "stats",
      "present": "@@=[properties.stats*5, properties.stats*3, properties.stats*2]",
      "absent": [
        255,
        0,
        255
      ]
    },
    "getFillColor": "@@=[properties.stats*5, properties.stats*3, properties.stats*2]"
  },
  "loadingLayer": {
    "@@type": "GeoJsonLayer",
    "stroked": true,
    "filled": false,
    "pickable": true,
    "lineWidthMinPixels": 10,
    "getLineColor": [
      25,
      55,
      0,
      255
    ],
    "getFillColor": [
      5,
      20,
      255,
      40
    ]
  },
  "errorLayer": {
    "@@type": "GeoJsonLayer",
    "stroked": true,
    "filled": true,
    "pickable": true,
    "lineWidthMinPixels": 10,
    "getLineColor": [
      255,
      255,
      0,
      255
    ],
    "getFillColor": [
      255,
      20,
      255,
      40
    ]
  }
}