Layer Styling
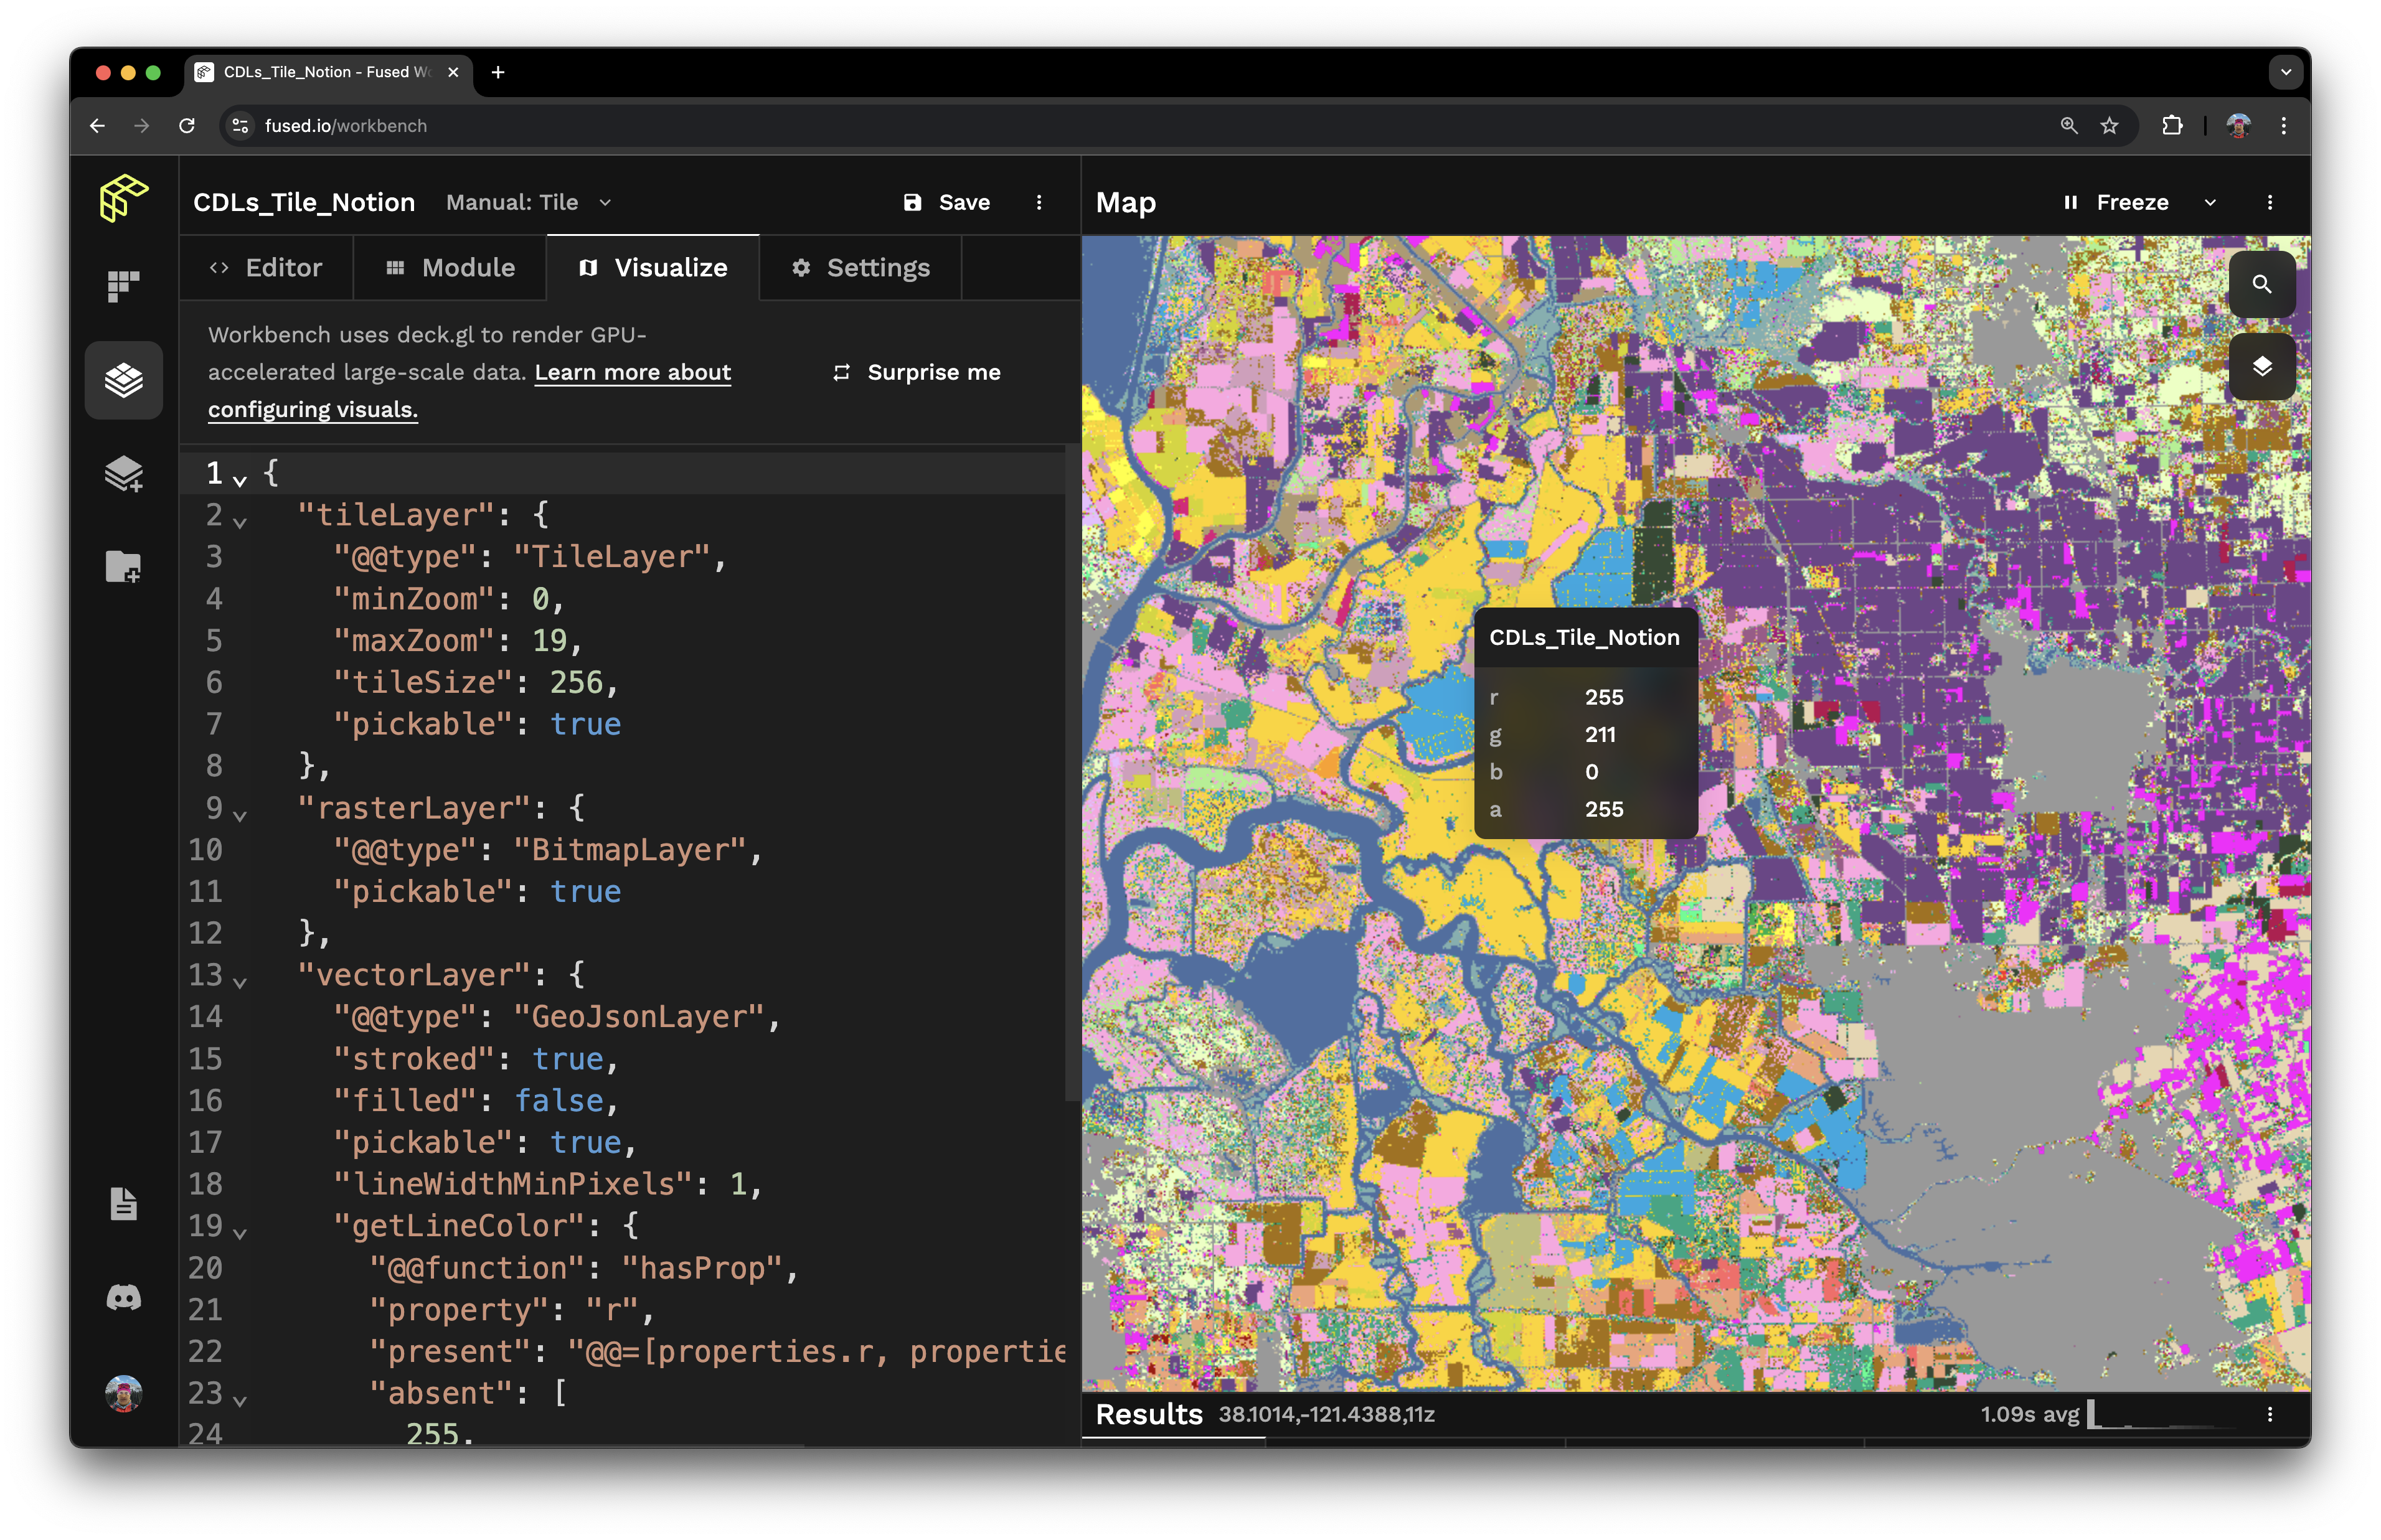
The visual representation of a UDF's output is configured under the "Visualize" tab.
The UDF Builder renders data on a DeckGL (@deck.gl/json) map as a TileLayer with a sublayer for either a rasterLayer or a vectorLayer. Both are set by default for flexibility, but only the one corresponding to the UDF output type is used.
The Fused UDF builder map supports the following layer types:
- Vector
H3HexagonLayers - Vector
GeoJsonLayer - Raster
BitmapLayer
Their visualization styles can be configured with DeckGL properties.
H3HexagonLayer
A UDF that returns a DataFrame (JSON) should set getHexagon with the name of a column of H3 indices. The rendered hexagons can be styled by setting values from a different column in getFillColor & getElevation.
{
  "tileLayer": {
    "@@type": "TileLayer",
    "minZoom": 0,
    "maxZoom": 19,
    "tileSize": 256,
    "pickable": true
  },
  "vectorLayer": {
    "@@type": "H3HexagonLayer",
    "stroked": true,
    "filled": true,
    "pickable": true,
    "extruded": false,
    "opacity": 1,
    "coverage": 0.9,
    "lineWidthMinPixels": 5,
    "getHexagon": "@@=properties.hex",
    "getLineColor": {
      "@@function": "hasProp",
      "property": "metric",
      "present": "@@=[(1 - properties.metric/500) * 255, 0, 255]",
      "absent": [200, 200, 200]
    },
    "getFillColor": {
      "@@function": "hasProp",
      "property": "metric",
      "present": "@@=[255, (1 - properties.metric/500) * 255, 0]",
      "absent": [220, 255, 100]
    },
    "getElevation": {
      "@@function": "hasProp",
      "property": "metric",
      "present": "@@=properties.metric",
      "absent": 1
    },
    "elevationScale": 10
  }
}
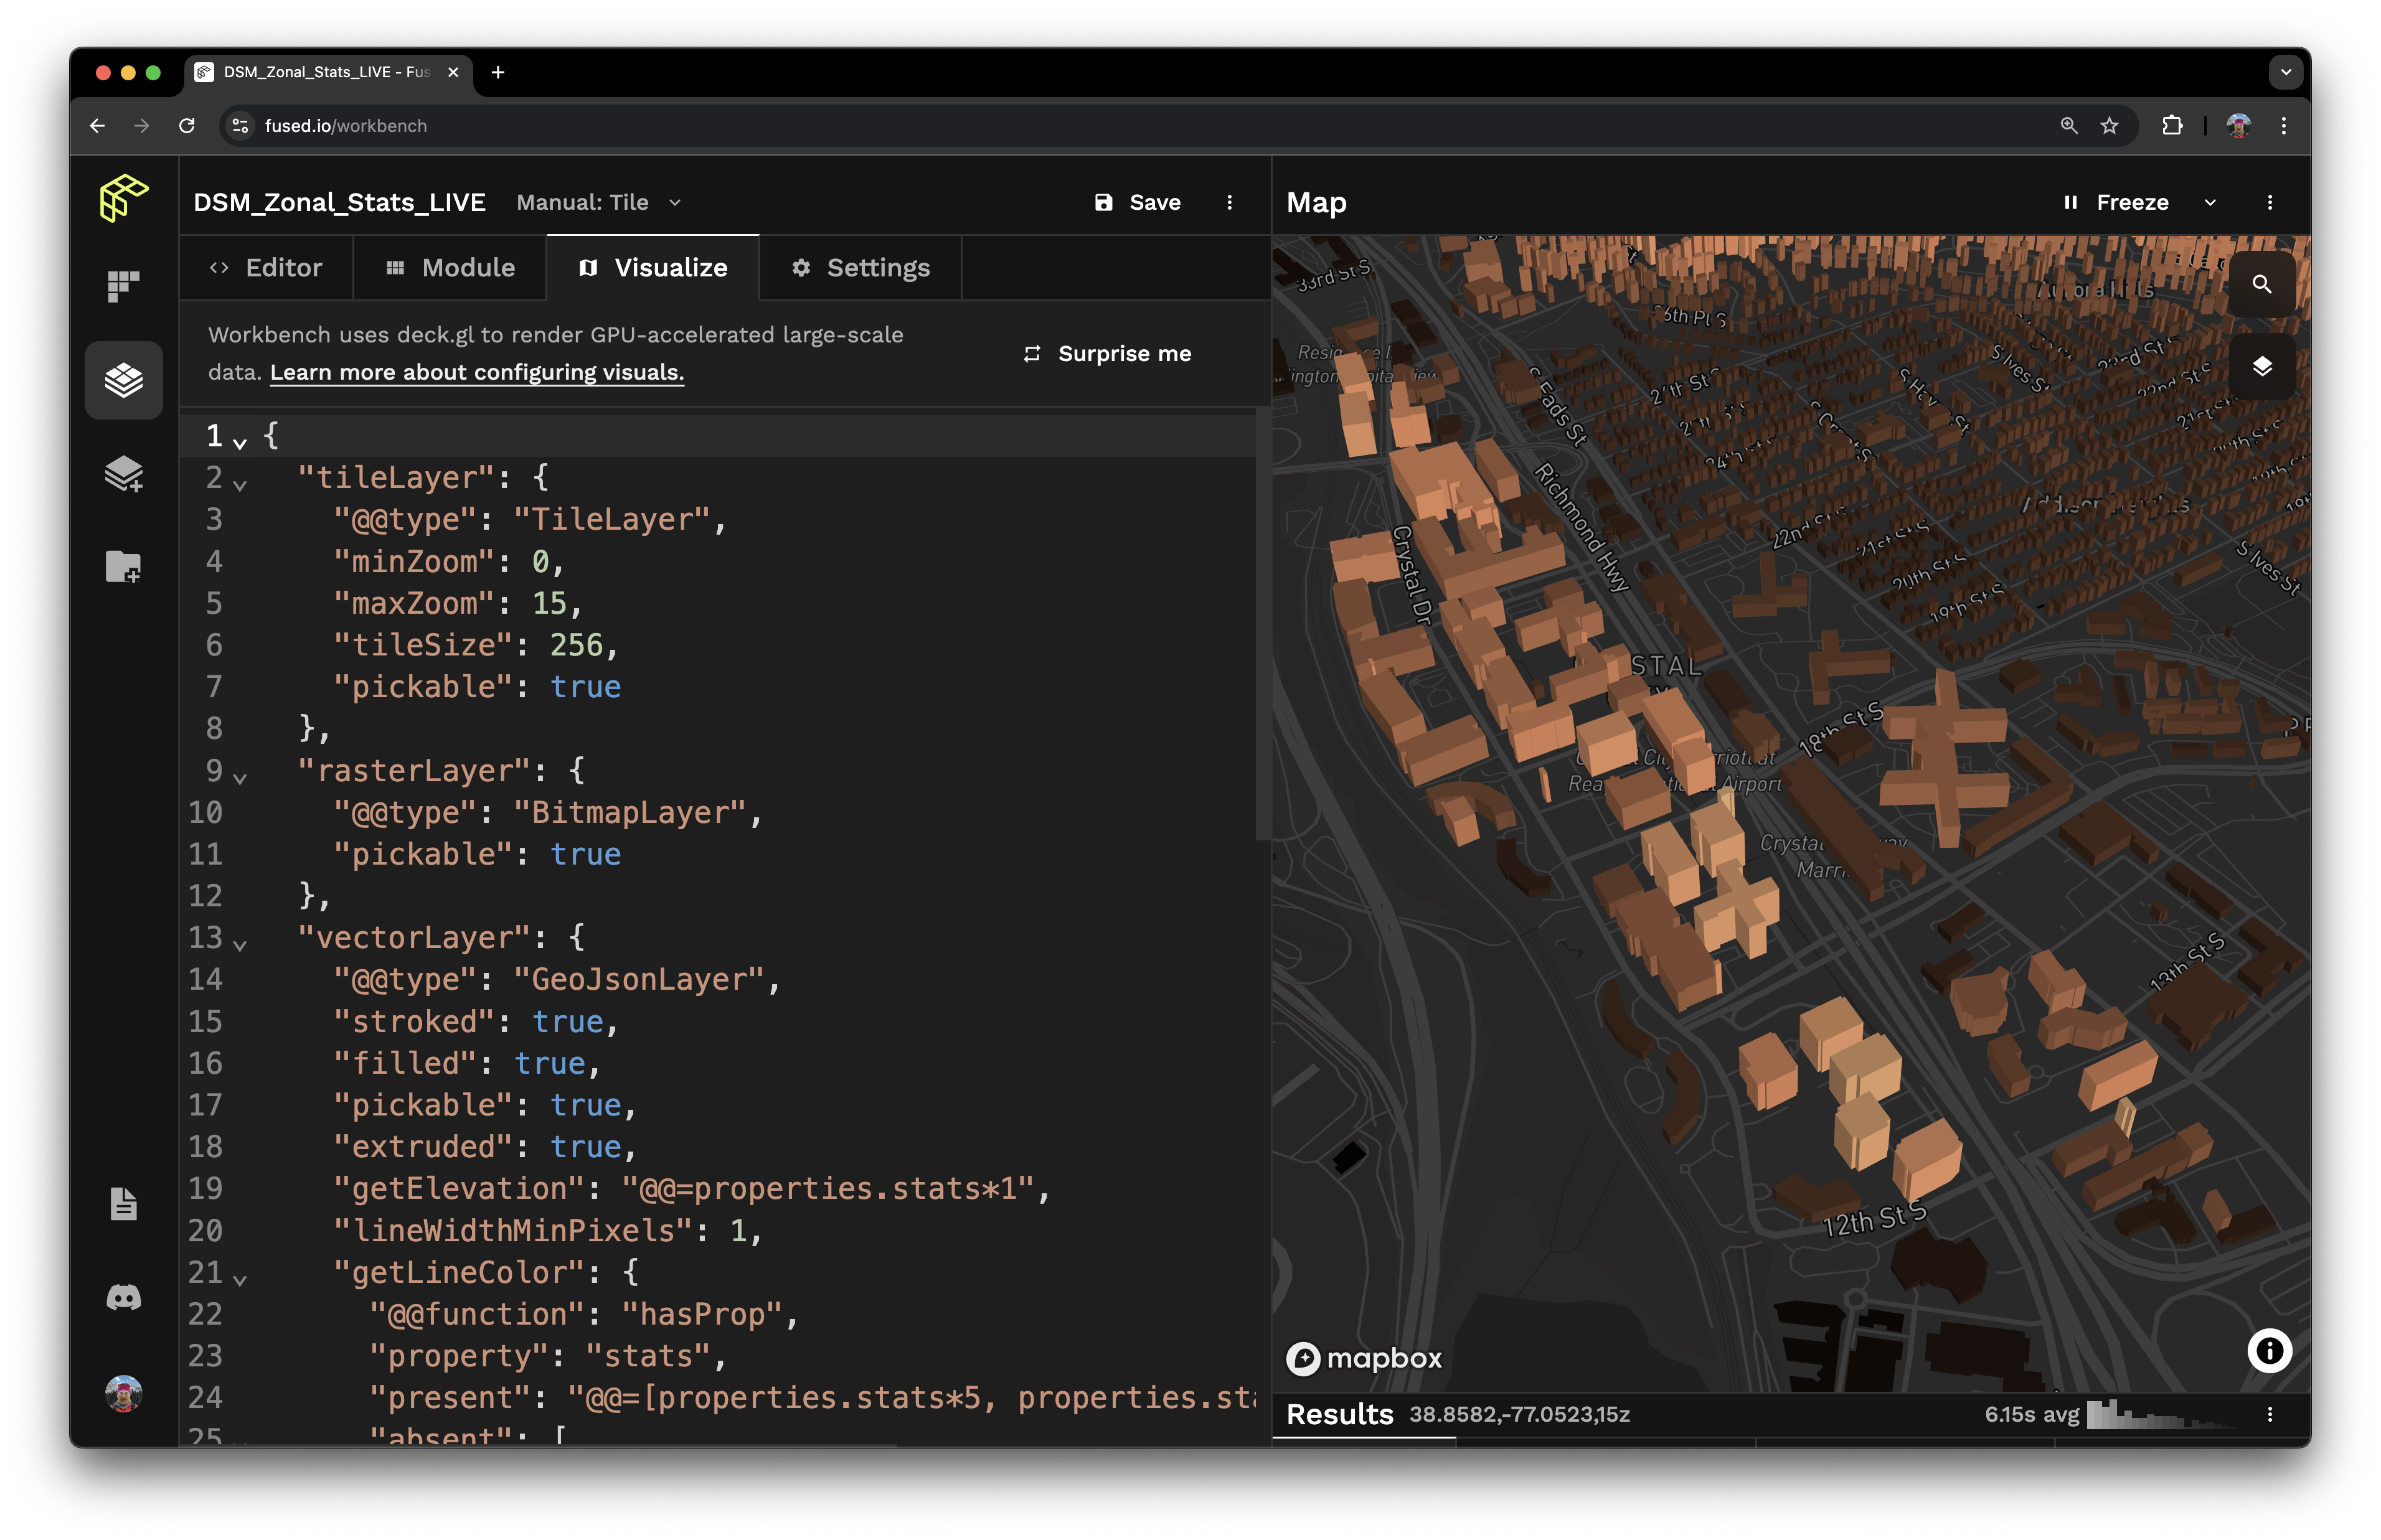
Vector GeoJsonLayer
The visualization of the output of a UDF that returns a DataFrame or GeoDataFrame can be configured dynamically based on column values. Attributes of the vectorLayer can be set to use either hardcoded values or column values, such as:
- Line color (
getLineColor) and line width (getLineWidth) - Elevation (
getElevation) withextrudedset to true lineWidthUnitshelps maintain visual consistency across zoom levels when set topixels
{
  "tileLayer": {
    "@@type": "TileLayer",
    "minZoom": 0,
    "maxZoom": 15,
    "tileSize": 256,
    "pickable": true
  },
  "vectorLayer": {
    "@@type": "GeoJsonLayer",
    "stroked": true,
    "filled": true,
    "pickable": true,
    "extruded": true,
    "getElevation": "@@=properties.stats*1",
    "lineWidthMinPixels": 1,
    "getLineWidth": "@@=properties.stats*10",
    "getLineColor": {
      "@@function": "hasProp",
      "property": "stats",
      "present": "@@=[properties.stats*5, properties.stats*3, properties.stats*2]",
      "absent": [255, 0, 255]
    },
    "getFillColor": "@@=[properties.stats*5, properties.stats*3, properties.stats*2]"
  }
}
Color styling
There are 4 ways to set the color for the stroke (getLineColor) and fill (getFillColor) of a GeoJsonLayer. These examples show how to set it for the fill with getFillColor, and the same syntax applies for the stroke with getLineColor. They all modify the visualization config for this UDF.
@fused.udf
def udf(
    bbox: fused.types.Bbox = None,
    table_path: str = "s3://fused-asset/infra/building_msft_us/",
):
    import numpy as np
    import random
    utils = fused.load("https://github.com/fusedio/udfs/tree/eda5aec/public/common/").utils

    # Load data
    gdf=utils.table_to_tile(bbox, table=table_path)

    # Assign random numbers
    gdf['value'] = np.random.randint(0,10, len(gdf))

    # Assign random classes
    categories = ['residential', 'commercial', 'health', 'public']
    gdf['class'] = [random.choice(categories) for _ in range(len(gdf))]

    print(gdf)
    return gdf
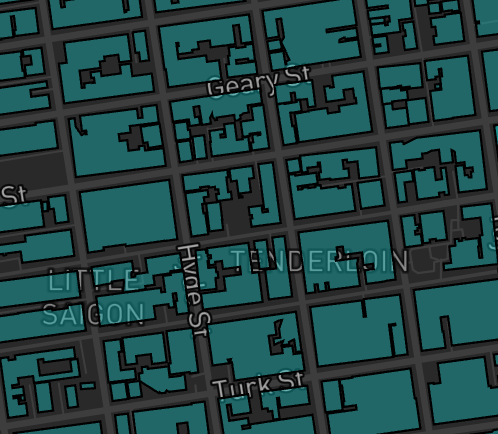
With a single hardcoded color
{
  "tileLayer": {
    "@@type": "TileLayer",
    "minZoom": 0,
    "maxZoom": 19,
    "tileSize": 256,
    "pickable": true
  },
  "rasterLayer": {
    "@@type": "BitmapLayer",
    "pickable": true
  },
  "vectorLayer": {
    "@@type": "GeoJsonLayer",
    "stroked": true,
    "filled": true,
    "pickable": true,
    "lineWidthMinPixels": 1,
    "pointRadiusMinPixels": 1,
    "getFillColor": [20,200,200,100]
  }
}
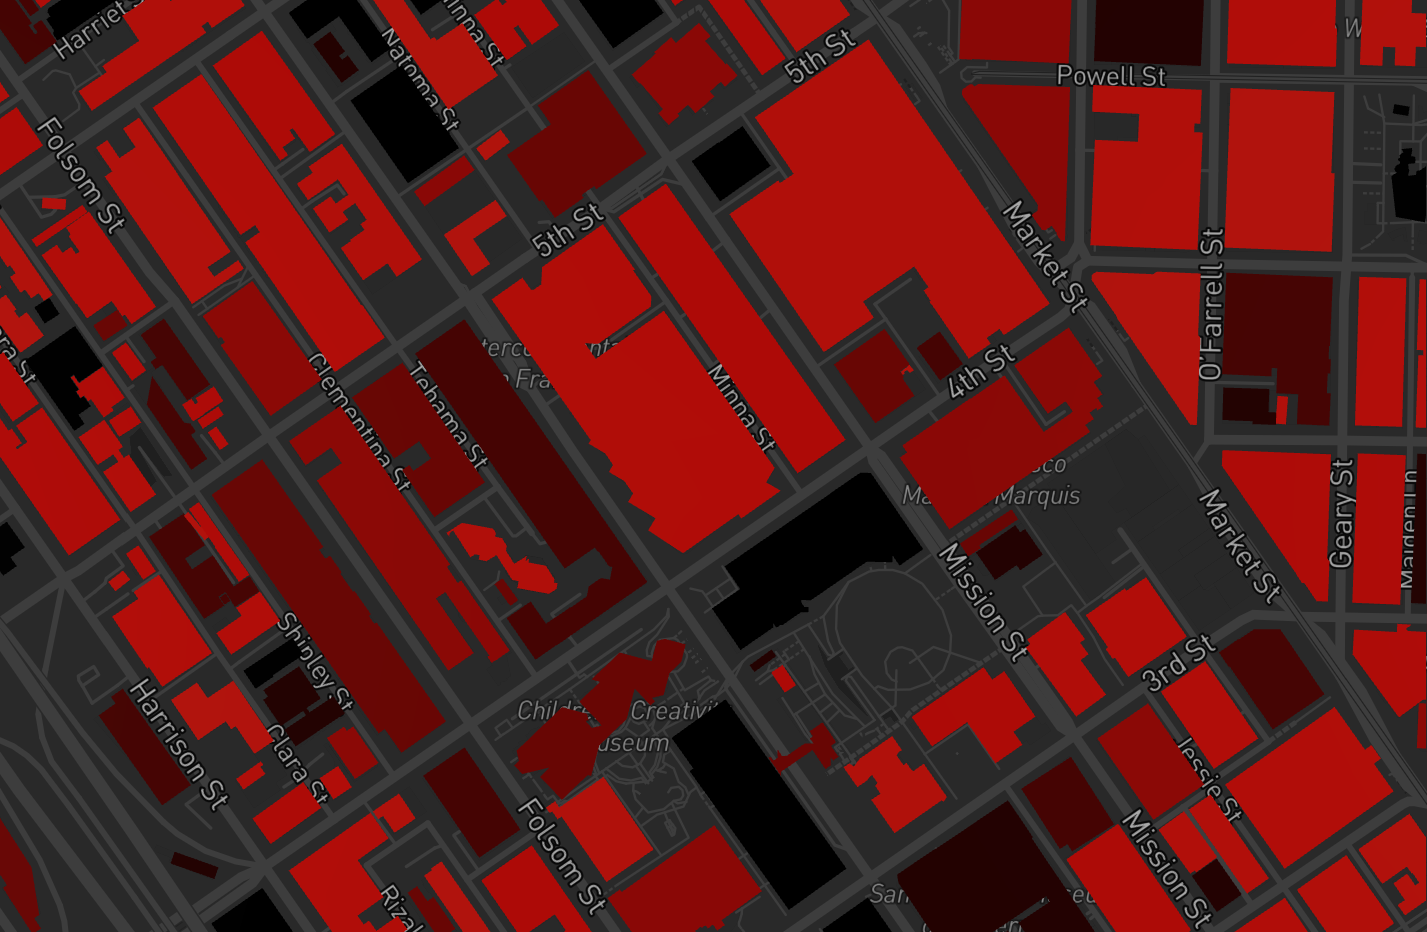
Based on a property value
{
  "tileLayer": {
    "@@type": "TileLayer",
    "minZoom": 0,
    "maxZoom": 15,
    "tileSize": 256,
    "pickable": true
  },
  "rasterLayer": {
    "@@type": "BitmapLayer",
    "pickable": true
  },
  "vectorLayer": {
    "@@type": "GeoJsonLayer",
    "stroked": true,
    "filled": true,
    "pickable": true,
    "extruded": true,
    "getElevation": "@@=properties.stats*1",
    "lineWidthMinPixels": 1,
    "getFillColor": "@@=[properties.value*50, properties.value*30, properties.value*2]"
  }
}
Alternatively, to support a default color when a value is absent.
{
  "tileLayer": {
    "@@type": "TileLayer",
    "minZoom": 0,
    "maxZoom": 15,
    "tileSize": 256,
    "pickable": true
  },
  "rasterLayer": {
    "@@type": "BitmapLayer",
    "pickable": true
  },
  "vectorLayer": {
    "@@type": "GeoJsonLayer",
    "stroked": true,
    "filled": true,
    "pickable": true,
    "extruded": true,
    "getElevation": "@@=properties.stats*1",
    "lineWidthMinPixels": 1,
    "getFillColor": {
      "@@function": "hasProp",
      "property": "value",
      "present": "@@=[properties.value*50, properties.value*3, properties.value*2]",
      "absent": [
        255,
        0,
        255
      ]
    }
  }
}
colorCategories
To set the color with colorCategories, use the attr property to specify the table column for the values, and the colors property to define the desired color palette.
{
  "tileLayer": {
    "@@type": "TileLayer",
    "minZoom": 0,
    "maxZoom": 19,
    "tileSize": 256,
    "pickable": true
  },
  "rasterLayer": {
    "@@type": "BitmapLayer",
    "pickable": true
  },
  "vectorLayer": {
    "@@type": "GeoJsonLayer",
    "stroked": true,
    "filled": true,
    "pickable": true,
    "lineWidthMinPixels": 1,
    "pointRadiusMinPixels": 1,
    "getFillColor": {
      "@@function": "colorCategories",
      "attr": "class",
      "domain": [
        "residential",
        "commercial",
        "health",
        "public"
      ],
      "colors": "Bold"
    }
  }
}
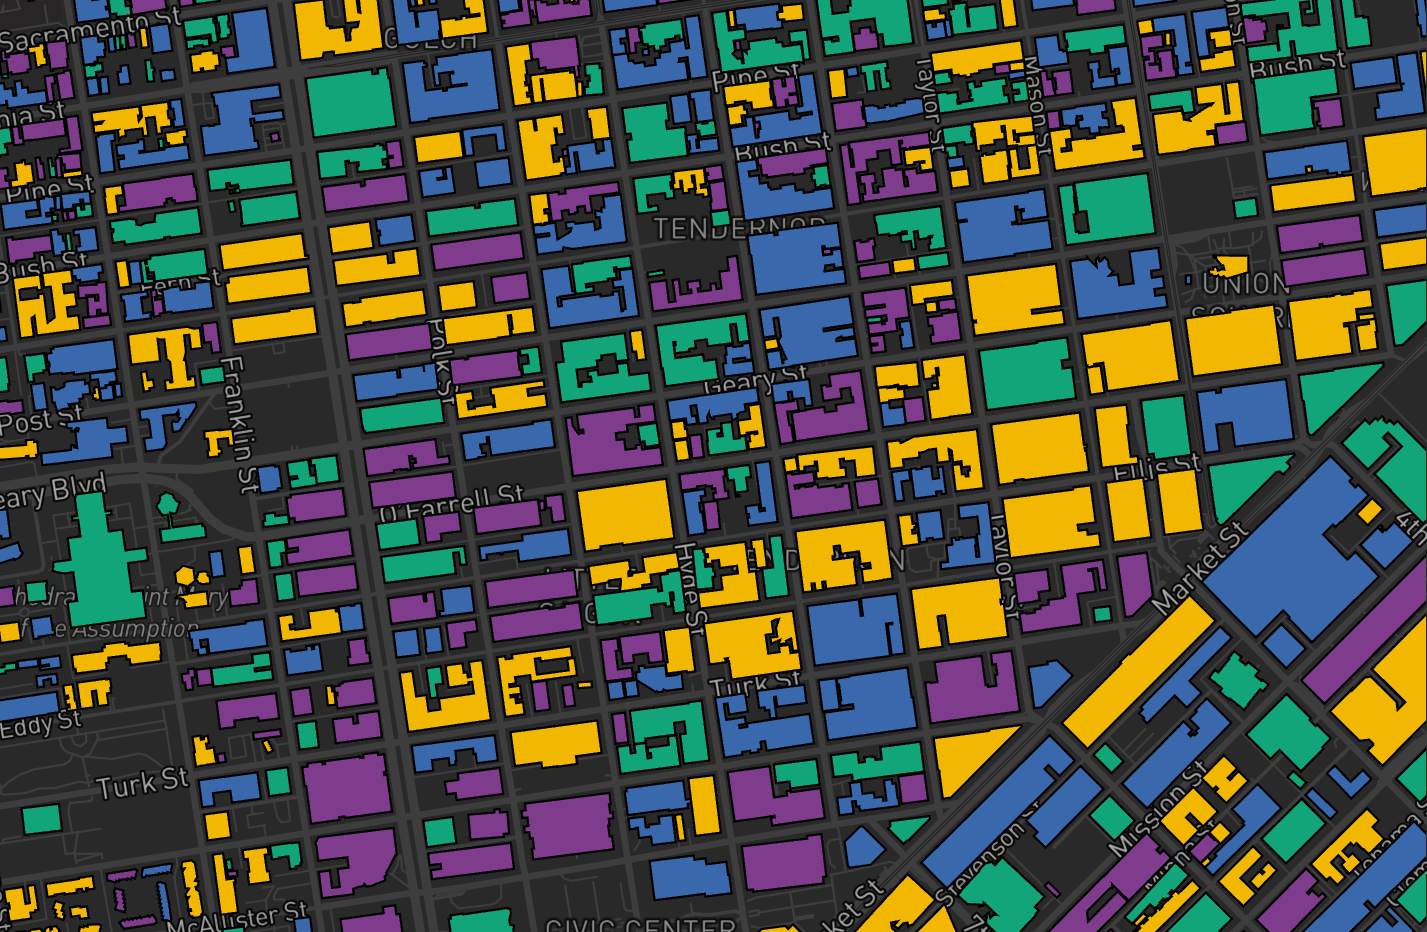
Note that unexpected behaviors may arise if too many domains are used.
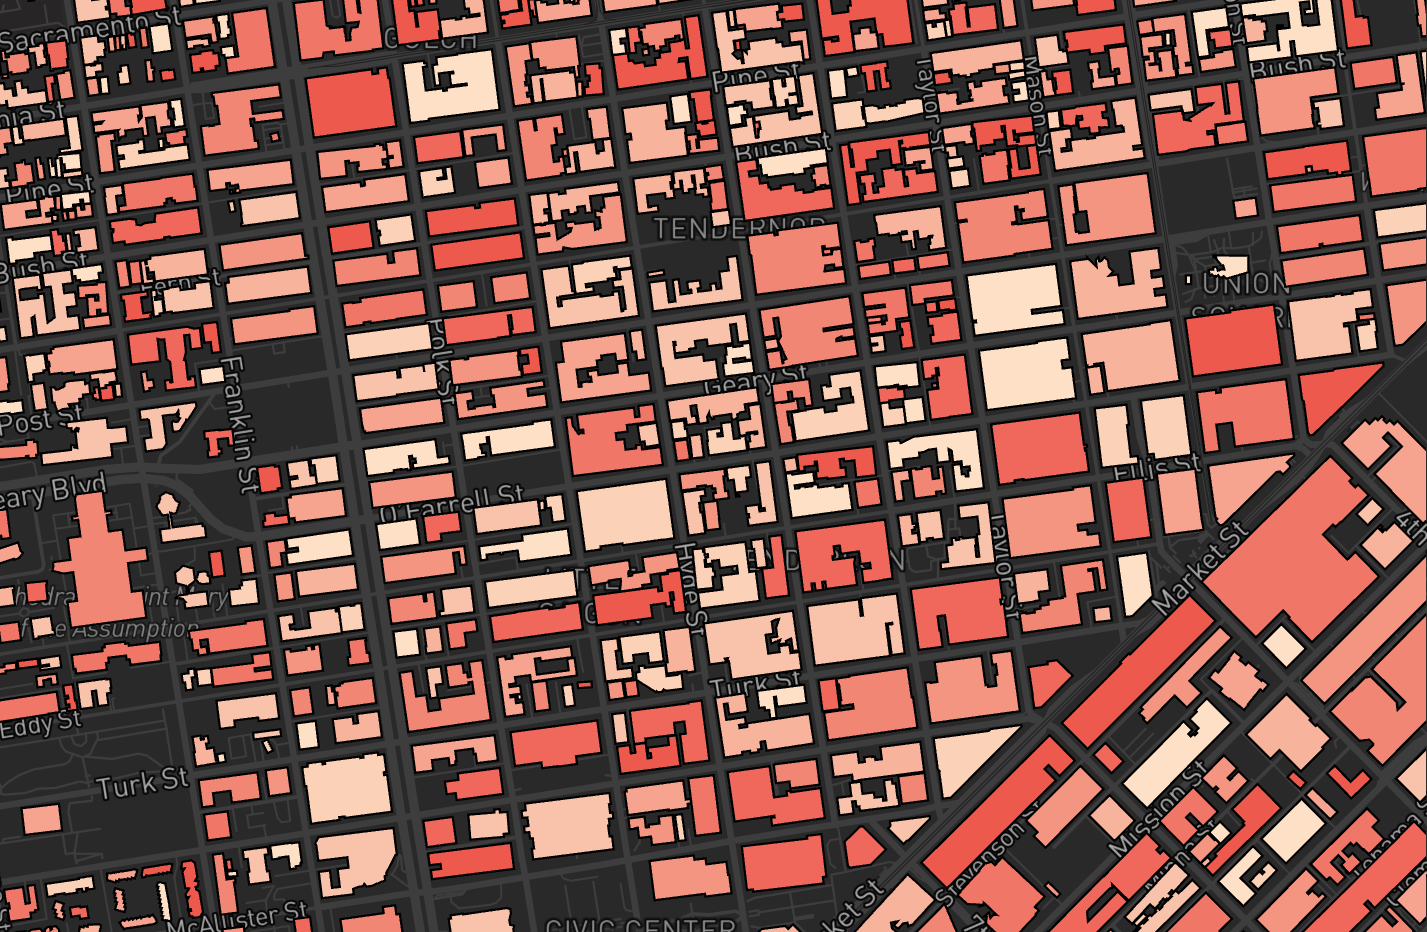
colorContinuous
To set the color with colorContinuous, use the attr property to specify the table column for the values, and the colors property to define the desired color palette.
{
  "tileLayer": {
    "@@type": "TileLayer",
    "minZoom": 0,
    "maxZoom": 19,
    "tileSize": 256,
    "pickable": true
  },
  "rasterLayer": {
    "@@type": "BitmapLayer",
    "pickable": true
  },
  "vectorLayer": {
    "@@type": "GeoJsonLayer",
    "stroked": true,
    "filled": true,
    "pickable": true,
    "lineWidthMinPixels": 1,
    "pointRadiusMinPixels": 1,
    "getFillColor": {
      "@@function": "colorContinuous",
      "attr": "value",
      "domain": [
        0,
        10
      ],
      "colors": "Peach",
      "nullColor": [
        184,
        184,
        184
      ]
    }
  }
}
Raster BitmapLayer
Raster layers can be set to display a tooltip on hover by setting the pickable property to true. See DeckGL documentation.
{
  "tileLayer": {
    "@@type": "TileLayer",
    "minZoom": 0,
    "maxZoom": 19,
    "tileSize": 256,
    "pickable": true
  },
  "rasterLayer": {
    "@@type": "BitmapLayer",
    "pickable": true
  }
}
The transparency of raster images can be set in two ways:
- In RGB images, the color black (0,0,0) is automatically set to full transparency.
If a 4-channel array is passed, i.e. RGBA, the value of the 4th channel is the transparency.
Custom loadingLayer and errorLayer
When tileLayer has "@@type": "DebugTileLayer" set loadingLayer and errorLayer can be configured to show the user that the UDF is still processing or that an error occurred. This is helpful for debugging.
{
  "tileLayer": {
    "@@type": "DebugTileLayer",
    "minZoom": 0,
    "maxZoom": 15,
    "tileSize": 256,
    "pickable": true
  },
  "rasterLayer": {
    "@@type": "BitmapLayer",
    "pickable": true
  },
  "vectorLayer": {
    "@@type": "GeoJsonLayer",
    "stroked": true,
    "filled": true,
    "pickable": true,
    "extruded": true,
    "getElevation": "@@=properties.stats*1",
    "lineWidthMinPixels": 1,
    "getLineColor": {
      "@@function": "hasProp",
      "property": "stats",
      "present": "@@=[properties.stats*5, properties.stats*3, properties.stats*2]",
      "absent": [
        255,
        0,
        255
      ]
    },
    "getFillColor": "@@=[properties.stats*5, properties.stats*3, properties.stats*2]"
  },
  "loadingLayer": {
    "@@type": "GeoJsonLayer",
    "stroked": true,
    "filled": false,
    "pickable": true,
    "lineWidthMinPixels": 10,
    "getLineColor": [
      25,
      55,
      0,
      255
    ],
    "getFillColor": [
      5,
      20,
      255,
      40
    ]
  },
  "errorLayer": {
    "@@type": "GeoJsonLayer",
    "stroked": true,
    "filled": true,
    "pickable": true,
    "lineWidthMinPixels": 10,
    "getLineColor": [
      255,
      255,
      0,
      255
    ],
    "getFillColor": [
      255,
      20,
      255,
      40
    ]
  }
}