H3 Visualization
A Fused Map draws H3 cells as hexagons. The map only needs rows with a cell column, so where those rows come from decides the method:
- From a UDF: a UDF returns the cells and an
h3layer draws them. - From an indexed dataset: a
fused-hexlayer draws a dataset indexed withfused.h3, with no UDF. Or anh3-querywidget fetches rows from it and a map draws them. - Cross-filtering: a histogram and a category list filter the map, and the map's view filters the charts.
The fused-hex layer is the easiest way to map an indexed dataset: one layer, no code.
From a UDF
Use a UDF when the cells need work in Python first, such as a join, an aggregation or a filter. The map runs the UDF and draws the table it returns.
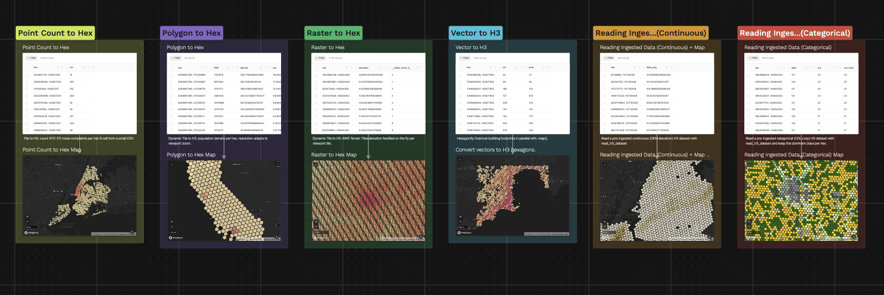
An h3 layer draws the table a UDF returns. "{{point_count_to_hex}}" references the UDF and h3Column names the cell column.
Code
UDF
import fused


@fused.udf
def udf(
    res: int = 9
):
    noise_311_link = "https://gist.githubusercontent.com/kashuk/670a350ea1f9fc543c3f6916ab392f62/raw/4c5ced45cc94d5b00e3699dd211ad7125ee6c4d3/NYC311_noise.csv"
    common = fused.load("https://github.com/fusedio/udfs/tree/b6786d6/public/common/")
    con = common.duckdb_connect()

    df = con.execute(
        """
        SELECT
          h3_latlng_to_cell(lat, lng, ?) AS hex,
          COUNT(*) AS cnt
        FROM read_csv_auto(?)
        WHERE lat IS NOT NULL AND lng IS NOT NULL
        GROUP BY 1
        """,
        [res, noise_311_link],
    ).df()

    return df
Widget
{
  "type": "fused-map",
  "props": {
    "showSidebar": true,
    "layers": [
      {
        "id": "point_count_to_hex",
        "name": "311 Noise Complaints",
        "udf": "{{point_count_to_hex}}",
        "type": "h3",
        "h3Column": "hex",
        "tooltip": true,
        "legend": true,
        "style": {
          "fillColor": {
            "type": "continuous",
            "attr": "cnt",
            "palette": "OrYel",
            "domain": [
              0,
              200
            ]
          },
          "opacity": 0.7
        }
      }
    ]
  }
}
To map an indexed dataset from a UDF, call fused.h3.query in it and return the rows. Step 4 of the end-to-end example does this for Overture buildings.
From an indexed dataset
A dataset indexed with the H3 Data Retrieval Service goes on a map with no UDF, in one of two ways:
| Way | What you add | Use it for |
|---|---|---|
fused-hex layer | One map layer that draws the dataset. | Browsing a whole dataset at any zoom. |
h3-query widget and a map | An h3-query widget that fetches the rows of one query, and a map that draws them. | Running SQL, tables and charts on those rows as well as mapping them. |
Draw a dataset with a fused-hex layer
A fused-hex layer draws an indexed dataset straight on the map. The browser fetches the cells in view as you pan and zoom, so you don't need a UDF or a server of your own.
Code
{
  "type": "fused-map",
  "props": {
    "basemap": "mapbox://styles/mapbox/dark-v11",
    "showSidebar": true,
    "layers": [
      {
        "id": "nyc311",
        "name": "NYC 311 requests (Jan 2024)",
        "type": "fused-hex",
        "h3Column": "hex",
        "source": {
          "path": "s3://fused-asset/data/nyc311/",
          "timeColumn": "created_date",
          "dateMin": "2024-01-01",
          "dateMax": "2024-01-31T23:59:59",
          "variables": [
            "year"
          ],
          "reduce": "sum",
          "overview": {}
        },
        "tooltip": [
          "hex",
          "count",
          "date_min",
          "date_max"
        ],
        "legend": {
          "title": "311 requests"
        },
        "style": {
          "fillColor": {
            "type": "continuous",
            "attr": "count",
            "palette": "Sunset",
            "domain": [
              0,
              50
            ]
          },
          "opacity": 0.8
        }
      }
    ],
    "centerLng": -73.95,
    "centerLat": 40.72,
    "zoom": 11,
    "autoFit": false
  }
}
The layer needs only three settings:
h3Column: the cell column,hexfor a dataset written byfused.h3.partition.source.path: the indexed dataset.source.overview: {}: draws an overview of the dataset when you zoom out.
Everything else is optional, such as the time window in the example. The layer doesn't move the map to its data, so set centerLng, centerLat and zoom. For the other keys, see the Fused Map widget reference.
The H3 Data Retrieval Visualization canvas has this map in nyc311_hex_map, and ais_hex_map maps one day of AIS ship positions in New York Harbor.
Map the rows of an h3-query widget
An h3-query widget doesn't draw anything. It fetches the rows of one query on an indexed dataset and shares them as a SQL source, {{name}}, for tables, charts and maps. To map the rows, add a fused-map layer with "data": "{{name}}", in the same widget or in a node with an edge from the h3-query node.
In this example, nyc311_query_map is one widget. Its h3-query fetches one day of NYC 311 calls in Lower Manhattan, the map on the left draws them and the table on the right lists them by complaint type. List hex in columns so the map has the cells. The layer's sql counts the calls in each cell, so each cell is drawn once.
Code
{
  "type": "div",
  "props": { "style": "display:flex;flex-direction:row;gap:12px;height:100%;min-height:0" },
  "children": [
    {
      "type": "h3-query",
      "props": {
        "name": "nyc311",
        "path": "s3://fused-asset/data/nyc311/",
        "minLng": -74.02, "minLat": 40.70, "maxLng": -73.97, "maxLat": 40.73,
        "timeMin": "2024-07-01", "timeMax": "2024-07-01T23:59:59",
        "columns": ["hex", "complaint_type"]
      }
    },
    {
      "type": "fused-map",
      "props": {
        "style": "flex:1;min-width:0;height:100%",
        "basemap": "mapbox://styles/mapbox/dark-v11",
        "centerLng": -73.995, "centerLat": 40.715, "zoom": 13.5,
        "layers": [
          {
            "id": "nyc311_calls",
            "name": "NYC 311 calls, July 1 2024",
            "type": "h3",
            "h3Column": "hex",
            "data": "{{nyc311}}",
            "sql": "SELECT hex, COUNT(*) AS calls FROM {{source}} GROUP BY 1",
            "tooltip": ["hex", "calls"],
            "style": {
              "fillColor": {"type": "continuous", "attr": "calls", "palette": "Sunset", "domain": [0, 6]},
              "opacity": 0.8
            }
          }
        ]
      }
    },
    {
      "type": "sql-table",
      "props": {
        "style": "flex:0 0 400px;height:100%;overflow:auto",
        "sql": "SELECT complaint_type, COUNT(*) AS calls FROM {{nyc311}} GROUP BY 1 ORDER BY 2 DESC"
      }
    }
  ]
}
Cross-filtering
This HTML template node maps one hour of AIS ship positions in New York Harbor. Its h3-query fetches the positions in the map's view, and dragging over the speed histogram or clicking a vessel type filters the map.
Code: ais_query_crossfilter HTML template
<!doctype html>
<html>
<head>
<meta charset="utf-8" />
<style>
  :root {
    --bg: #0d1117;
    --fg: #e6edf3;
    --muted: #8b949e;
    --border: #30363d;
    --surface: #161b22;
    --bar: #3a4250;
    --accent: #E8FF59;
  }
  * { box-sizing: border-box; }
  html, body { height: 100%; }
  body {
    margin: 0;
    padding: 10px;
    height: 100vh;
    display: grid;
    grid-template-columns: 1fr 340px;
    gap: 10px;
    background: var(--bg);
    color: var(--fg);
    font: 13px/1.4 -apple-system, BlinkMacSystemFont, "Segoe UI", Helvetica, Arial, sans-serif;
  }
  .side { display: flex; flex-direction: column; gap: 10px; min-height: 0; overflow-y: auto; }
  .card { background: var(--surface); border: 1px solid var(--border); border-radius: 6px; padding: 10px; }
  .card h3 { margin: 0 0 6px; font-size: 12px; font-weight: 600; text-transform: uppercase; letter-spacing: .04em; color: var(--muted); }
  .kpi { font-size: 22px; font-weight: 600; }
  .kpi small { font-size: 12px; font-weight: 400; color: var(--muted); }
  .hint { font-size: 11px; color: var(--muted); margin-top: 4px; }
  #hist { display: block; width: 100%; height: 140px; cursor: crosshair; user-select: none; }
  #kinds .row { display: grid; grid-template-columns: 80px 1fr 48px; gap: 6px; align-items: center; padding: 2px 0; cursor: pointer; }
  #kinds .row:hover .name { color: var(--accent); }
  #kinds .track { position: relative; height: 12px; }
  #kinds .track div { position: absolute; left: 0; top: 0; bottom: 0; border-radius: 2px; }
  #kinds .num { text-align: right; color: var(--muted); font-variant-numeric: tabular-nums; }
  #kinds .row.on .name { color: var(--accent); font-weight: 600; }
  .chips { display: flex; flex-wrap: wrap; gap: 6px; }
  .chip { background: var(--bg); border: 1px solid var(--border); border-radius: 12px; padding: 1px 8px; font-size: 12px; }
  button { background: var(--bg); color: var(--fg); border: 1px solid var(--border); border-radius: 4px; padding: 3px 10px; font: inherit; cursor: pointer; }
  button:hover { border-color: var(--accent); }
  #detail { white-space: pre-wrap; margin: 0; font-size: 12px; }
  #status { color: #ff7b72; font-size: 12px; white-space: pre-wrap; }
</style>
</head>
<body>
<fused-widget style="display:block;height:100%">
  { "type": "fused-map",
    "props": {
      "style": "height:100%",
      "centerLng": -74.02, "centerLat": 40.65, "zoom": 11, "minZoom": 11,
      "param": "q_bounds", "autoSend": true, "autoSendDebounceMs": 0,
      "clickParam": "q_click", "hoverParam": "q_hover",
      "selectParam": "q_sel", "selectKey": "MMSI",
      "sourceParam": "q_sources",
      "layers": [{
        "id": "ships_h3", "name": "AIS positions", "type": "h3", "h3Column": "hex", "data": "{{ais_q}}",
        "sql": "SELECT *, LEAST(CAST(floor(COALESCE(SOG, 0)) AS INT), 25) AS kn, CASE WHEN VesselType BETWEEN 60 AND 69 THEN 'Passenger' WHEN VesselType BETWEEN 70 AND 79 THEN 'Cargo' WHEN VesselType BETWEEN 80 AND 89 THEN 'Tanker' WHEN VesselType IN (31, 32, 52) THEN 'Tug / tow' WHEN VesselType IN (36, 37) THEN 'Pleasure' WHEN VesselType = 30 THEN 'Fishing' WHEN VesselType BETWEEN 50 AND 59 THEN 'Service' ELSE 'Other' END AS kind FROM {{source}}",
        "tooltip": ["VesselName", "MMSI", "SOG", "kind", "BaseDateTime"],
        "filters": [
          { "attr": "kn", "type": "range", "min": "$q_lo", "max": "$q_hi" },
          { "attr": "kind", "type": "categories", "values": "$q_kinds" }
        ],
        "style": { "fillColor": { "type": "continuous", "attr": "kn", "palette": "Sunset" }, "opacity": 0.8 }
      }] } }
</fused-widget>

<div class="side">
  <div class="card">
    <h3>Source: /h3/query</h3>
    <fused-widget style="display:block;height:40px">
      { "type": "h3-query",
        "props": {
          "name": "ais_q",
          "path": "s3://fused-asset/data/ais/ais_week_h3_v2/",
          "minLng": "$q_w", "minLat": "$q_s", "maxLng": "$q_e", "maxLat": "$q_n",
          "timeMin": "2024-07-03T12:00:00", "timeMax": "2024-07-03T12:59:59",
          "columns": ["hex", "MMSI", "VesselName", "BaseDateTime", "LAT", "LON", "SOG", "COG", "VesselType", "Length"],
          "maxPages": 4 } }
    </fused-widget>
    <div class="hint">An h3-query widget in this page fetches the map's view of AIS (12:00 to 13:00 UTC, July 3 2024) on every pan.</div>
  </div>
  <div class="card">
    <h3>Positions</h3>
    <div class="kpi" id="kpi">–</div>
    <div class="hint">Pan to fetch a new view. Shift+drag on the map to box-select, shift+click a cell to pick that vessel.</div>
  </div>

  <div class="card">
    <h3>Speed over ground (knots)</h3>
    <svg id="hist"></svg>
    <div class="hint">Drag to filter the map by speed. Click to clear.</div>
  </div>

  <div class="card">
    <h3>Vessel type</h3>
    <div id="kinds"></div>
    <div class="hint">Click a type to filter the map. Click again to remove it.</div>
  </div>

  <div class="card">
    <h3>Active filters</h3>
    <div class="chips" id="chips"></div>
    <p style="margin:8px 0 0"><button id="select-view">Select view</button> <button id="reset">Reset all</button></p>
  </div>

  <div class="card">
    <h3>Feature</h3>
    <pre id="detail">Hover or click a cell</pre>
  </div>
  <div id="status"></div>
</div>

<script>
  const P = "q_";
  const LAYER = "ships_h3";
  const SRC = "{".repeat(2) + LAYER + "}".repeat(2);
  const KN = "LEAST(CAST(floor(COALESCE(SOG, 0)) AS INT), 25)";
  const KIND = "CASE WHEN VesselType BETWEEN 60 AND 69 THEN 'Passenger' WHEN VesselType BETWEEN 70 AND 79 THEN 'Cargo' WHEN VesselType BETWEEN 80 AND 89 THEN 'Tanker' WHEN VesselType IN (31, 32, 52) THEN 'Tug / tow' WHEN VesselType IN (36, 37) THEN 'Pleasure' WHEN VesselType = 30 THEN 'Fishing' WHEN VesselType BETWEEN 50 AND 59 THEN 'Service' ELSE 'Other' END";
  const BINS = 26;
  const pv = (p, k) => p[P + k];
  const q = (sql, opts) => fused.query(sql.replaceAll("@", "$").replaceAll("{src}", SRC), opts);
  const span = (a, b) => ({ min: a ?? null, max: b ?? null });
  const fmt = (n) => Number(n || 0).toLocaleString();
  const el = (id) => document.getElementById(id);
  const HINT = { not_ready: "layer still loading", not_allowed: "source not in reach", query_error: "query failed", invalid_args: "bad query params" };
  const fail = (e) => { if (e && e.type !== "aborted") el("status").textContent = (HINT[e.type] || "error") + ": " + e.message; };
  const kindList = (p) => (Array.isArray(pv(p, "kinds")) ? pv(p, "kinds") : []);

  function buildQuery(p) {
    const conds = [], params = {};
    const b = pv(p, "bounds");
    if (Array.isArray(b) && b.length === 4) {
      conds.push("LON BETWEEN @vx AND LAT BETWEEN @vy");
      params.vx = span(b[0], b[2]); params.vy = span(b[1], b[3]);
    }
    const sel = pv(p, "sel");
    if (sel && Array.isArray(sel.bbox)) {
      conds.push("LON BETWEEN @sx AND LAT BETWEEN @sy");
      params.sx = span(sel.bbox[0], sel.bbox[2]); params.sy = span(sel.bbox[1], sel.bbox[3]);
    } else if (sel && Array.isArray(sel.ids) && sel.ids.length) {
      conds.push("MMSI IN @ids");
      params.ids = sel.ids;
    }
    params.r = span(pv(p, "lo"), pv(p, "hi"));
    const kinds = kindList(p);
    let pass = KN + " BETWEEN @r";
    if (kinds.length) { pass += " AND " + KIND + " IN @kinds"; params.kinds = kinds; }
    const where = conds.length ? " WHERE " + conds.join(" AND ") : "";
    return { where, pass, params };
  }

  let hist = [], kinds = [], busy = false, again = false;
  async function refresh() {
    if (busy) { again = true; return; }
    busy = true;
    try {
      do {
        again = false;
        const { where, pass, params } = buildQuery(fused.params.getAll());
        const agg = "COUNT(*) AS n, COUNT(*) FILTER (WHERE " + pass + ") AS hit FROM {src}" + where;
        const rows = await q(
          "SELECT 'h' AS d, CAST(" + KN + " AS VARCHAR) AS k, " + agg + " GROUP BY 2" +
          " UNION ALL SELECT 'k' AS d, " + KIND + " AS k, " + agg + " GROUP BY 2",
          { params, key: null });
        const byBin = new Map(rows.filter((r) => r.d === "h").map((r) => [Number(r.k), r]));
        hist = Array.from({ length: BINS }, (_, k) => ({ k, n: Number(byBin.get(k)?.n || 0), hit: Number(byBin.get(k)?.hit || 0) }));
        kinds = rows.filter((r) => r.d === "k").map((r) => ({ k: r.k, n: Number(r.n), hit: Number(r.hit) })).sort((x, y) => y.n - x.n);
        el("status").textContent = "";
        paint();
      } while (again);
    } catch (e) { fail(e); } finally { busy = false; }
  }

  const svg = el("hist");
  const AXIS = 16;
  let brush = null;
  function paintHist() {
    const p = fused.params.getAll();
    const W = svg.clientWidth, H = svg.clientHeight - AXIS, w = W / BINS;
    const max = Math.max(1, ...hist.map((b) => b.n));
    const lo = pv(p, "lo"), hi = pv(p, "hi");
    const rect = (x, y, rw, rh, fill, extra) => '<rect x="' + x + '" y="' + y + '" width="' + rw + '" height="' + rh + '" fill="' + fill + '"' + (extra || "") + "/>";
    let out = "";
    if (lo != null || hi != null) {
      const a = lo ?? 0, b = hi ?? BINS - 1;
      out += rect(a * w, 0, (b - a + 1) * w, H, "rgba(232,255,89,0.08)");
    }
    hist.forEach((b, i) => {
      const nh = (H * b.n) / max, hh = (H * b.hit) / max;
      out += rect(i * w + 1, H - nh, Math.max(1, w - 2), nh, "var(--bar)");
      out += rect(i * w + 1, H - hh, Math.max(1, w - 2), hh, "var(--accent)");
    });
    [0, 5, 10, 15, 20, 25].forEach((k) => {
      out += '<text x="' + (k * w + w / 2) + '" y="' + (H + 12) + '" fill="var(--muted)" font-size="10" text-anchor="middle">' + (k === 25 ? "25+" : k) + "</text>";
    });
    if (brush) {
      const a = Math.min(brush.x0, brush.x1), b = Math.max(brush.x0, brush.x1);
      out += rect(a, 0, b - a, H, "rgba(232,255,89,0.2)", ' stroke="var(--accent)"');
    }
    svg.innerHTML = out;
  }

  function paintKinds() {
    const on = kindList(fused.params.getAll());
    const max = Math.max(1, ...kinds.map((r) => r.n));
    const box = el("kinds");
    box.innerHTML = "";
    if (!kinds.length) { box.innerHTML = '<div class="hint">No positions in view</div>'; return; }
    for (const r of kinds) {
      const row = document.createElement("div");
      row.className = "row" + (on.includes(r.k) ? " on" : "");
      row.innerHTML = '<span class="name"></span><div class="track"><div style="width:' + (100 * r.n) / max + '%;background:var(--bar)"></div><div style="width:' + (100 * r.hit) / max + '%;background:var(--accent)"></div></div><span class="num">' + fmt(r.hit) + "</span>";
      row.querySelector(".name").textContent = r.k;
      row.onclick = () => {
        const cur = kindList(fused.params.getAll());
        const next = cur.includes(r.k) ? cur.filter((x) => x !== r.k) : cur.concat([r.k]);
        fused.params.set(P + "kinds", next.length ? next : null);
      };
      box.appendChild(row);
    }
  }

  function paintChips() {
    const p = fused.params.getAll(), chips = [];
    if (pv(p, "lo") != null || pv(p, "hi") != null) chips.push("speed " + (pv(p, "lo") ?? 0) + "–" + (pv(p, "hi") ?? "25+") + " kn");
    const ks = kindList(p);
    if (ks.length) chips.push("type: " + ks.join(", "));
    const sel = pv(p, "sel");
    if (sel?.bbox) chips.push("map box selection");
    else if (sel?.ids?.length) chips.push(sel.ids.length + " picked vessels");
    el("chips").innerHTML = chips.length ? "" : '<span class="hint">None, showing everything in view</span>';
    chips.forEach((c) => { const s = document.createElement("span"); s.className = "chip"; s.textContent = c; el("chips").appendChild(s); });
  }

  function paint() {
    const total = hist.reduce((s, b) => s + b.n, 0), hit = hist.reduce((s, b) => s + b.hit, 0);
    el("kpi").innerHTML = fmt(hit) + " <small>of " + fmt(total) + " in view</small>";
    paintHist();
    paintKinds();
    paintChips();
  }

  const xOf = (e) => Math.max(0, Math.min(svg.clientWidth, e.clientX - svg.getBoundingClientRect().left));
  const kAt = (x) => Math.min(BINS - 1, Math.max(0, Math.floor((x / svg.clientWidth) * BINS)));
  svg.addEventListener("mousedown", (e) => { brush = { x0: xOf(e), x1: xOf(e) }; paintHist(); });
  function sendBrush(final) {
    const a = Math.min(brush.x0, brush.x1), b = Math.max(brush.x0, brush.x1);
    if (b - a < 3) { if (final) fused.params.set({ [P + "lo"]: null, [P + "hi"]: null }); return; }
    const lo = kAt(a), hi = kAt(b), p = fused.params.getAll();
    if (lo !== pv(p, "lo") || hi !== pv(p, "hi")) fused.params.set({ [P + "lo"]: lo, [P + "hi"]: hi });
  }
  window.addEventListener("mousemove", (e) => { if (brush) { brush.x1 = xOf(e); paintHist(); sendBrush(false); } });
  window.addEventListener("mouseup", () => {
    if (!brush) return;
    sendBrush(true);
    brush = null;
    paintHist();
  });

  el("select-view").onclick = () => { const b = fused.params.get(P + "bounds"); if (b) fused.params.set(P + "sel", { bbox: b }); };
  el("reset").onclick = () => fused.params.set({ [P + "sel"]: null, [P + "lo"]: null, [P + "hi"]: null, [P + "kinds"]: null });

  function showFeature(label, f) {
    if (!f) return false;
    el("detail").textContent = label + "\n" + Object.entries(f).map(([k, v]) => k + ": " + v).join("\n");
    return true;
  }

  function splitBounds(p) {
    const b = pv(p, "bounds")?.map((v) => +v.toFixed(4));
    if (b && JSON.stringify(b) !== JSON.stringify([p.q_w, p.q_s, p.q_e, p.q_n])) fused.params.set({ q_w: b[0], q_s: b[1], q_e: b[2], q_n: b[3] });
  }
  fused.params.onChange(splitBounds);
  splitBounds(fused.params.getAll());
  let seen = "";
  function onParams(p) {
    if (!showFeature("Hover", pv(p, "hover"))) showFeature("Clicked", pv(p, "click"));
    const src = pv(p, "sources")?.[LAYER];
    if (src?.error) el("status").textContent = "layer error: " + src.error;
    const version = src?.version;
    const key = JSON.stringify([version, pv(p, "bounds"), pv(p, "lo"), pv(p, "hi"), pv(p, "kinds"), pv(p, "sel")?.bbox ?? pv(p, "sel")?.ids]);
    if (version && key !== seen) {
      seen = key;
      refresh();
    } else if (!version && !src?.error) {
      el("kpi").innerHTML = "<small>Waiting for /h3/query…</small>";
    }
  }
  fused.params.onChange(onParams);
  onParams(fused.params.getAll());
  window.addEventListener("resize", () => paint());
</script>
</body>
</html>
See also
- Partition, Index and Query: build an indexed dataset
GET /h3/query: every query parameter- Fused Map and H3 Query widget references
- HTML template:
fused.queryandfused.params
In Workbench Map Viewer
Quick styling options for H3 data in Workbench:
Feel free to directly reach out to us at info@fused.io if you have any questions on implementing this yourself